Pseudoheterodyne Detection in Nearfield Optics - Zurich Instruments
Pseudoheterodyne Detection in Nearfield Optics - Zurich Instruments
Pseudoheterodyne Detection in Nearfield Optics - Zurich Instruments

Create successful ePaper yourself
Turn your PDF publications into a flip-book with our unique Google optimized e-Paper software.
select the modulator from a larger subset (electro-optical<br />
EOM, or piezo-electrical phase modulators PEPM).<br />
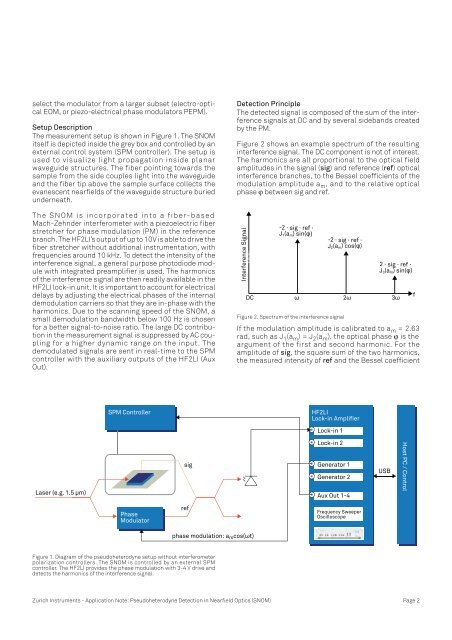
Setup Description<br />
The measurement setup is shown <strong>in</strong> Figure 1. The SNOM<br />
itself is depicted <strong>in</strong>side the grey box and controlled by an<br />
external control system (SPM controller). The setup is<br />
used to visualize light propagation <strong>in</strong>side planar<br />
waveguide structures. The fiber po<strong>in</strong>t<strong>in</strong>g towards the<br />
sample from the side couples light <strong>in</strong>to the waveguide<br />
and the fiber tip above the sample surface collects the<br />
evanescent nearfields of the waveguide structure buried<br />
underneath.<br />
The SNOM is <strong>in</strong>corporated <strong>in</strong>to a fiber-based<br />
Mach-Zehnder <strong>in</strong>terferometer with a piezoelectric fiber<br />
stretcher for phase modulation (PM) <strong>in</strong> the reference<br />
branch. The HF2LI’s output of up to 10V is able to drive the<br />
fiber stretcher without additional <strong>in</strong>strumentation, with<br />
frequencies around 10 kHz. To detect the <strong>in</strong>tensity of the<br />
<strong>in</strong>terference signal, a general purpose photodiode module<br />
with <strong>in</strong>tegrated preamplifier is used. The harmonics<br />
of the <strong>in</strong>terference signal are then readily available <strong>in</strong> the<br />
HF2LI lock-<strong>in</strong> unit. It is important to account for electrical<br />
delays by adjust<strong>in</strong>g the electrical phases of the <strong>in</strong>ternal<br />
demodulation carriers so that they are <strong>in</strong>-phase with the<br />
harmonics. Due to the scann<strong>in</strong>g speed of the SNOM, a<br />
small demodulation bandwidth below 100 Hz is chosen<br />
for a better signal-to-noise ratio. The large DC contribution<br />
<strong>in</strong> the measurement signal is suppressed by AC coupl<strong>in</strong>g<br />
for a higher dynamic range on the <strong>in</strong>put. The<br />
demodulated signals are sent <strong>in</strong> real-time to the SPM<br />
controller with the auxiliary outputs of the HF2LI (Aux<br />
Out).<br />
�������������������<br />
��������������<br />
�����<br />
���������<br />
Figure 1. Diagram of the pseudoheterodyne setup without <strong>in</strong>terferometer<br />
polarization controllers. The SNOM is controlled by an external SPM<br />
controller. The HF2LI provides the phase modulation with 3-4 V drive and<br />
detects the harmonics of the <strong>in</strong>terference signal.<br />
���<br />
���<br />
������������������� ��������<br />
<strong>Detection</strong> Pr<strong>in</strong>ciple<br />
The detected signal is composed of the sum of the <strong>in</strong>terference<br />
signals at DC and by several sidebands created<br />
by the PM.<br />
Figure 2 shows an example spectrum of the result<strong>in</strong>g<br />
<strong>in</strong>terference signal. The DC component is not of <strong>in</strong>terest.<br />
The harmonics are all proportional to the optical field<br />
amplitudes <strong>in</strong> the signal (sig) and reference (ref) optical<br />
<strong>in</strong>terference branches, to the Bessel coefficients of the<br />
modulation amplitude a m , and to the relative optical<br />
phase ϕ between sig and ref.<br />
�����<br />
�����������������<br />
���������<br />
���������<br />
�����������<br />
�����������<br />
�����������<br />
�����������������<br />
������������<br />
<strong>Zurich</strong> <strong>Instruments</strong> - Application Note: <strong>Pseudoheterodyne</strong> <strong>Detection</strong> <strong>in</strong> <strong>Nearfield</strong> <strong>Optics</strong> (SNOM) Page 2<br />
�������������������<br />
��<br />
�����������������<br />
�������������<br />
Figure 2. Spectrum of the <strong>in</strong>terference signal<br />
�����������������<br />
�������������<br />
����������������<br />
�������������<br />
� �� ��<br />
If the modulation amplitude is calibrated to a m = 2.63<br />
rad, such as J 1 (a m ) = J 2 (a m ), the optical phase ϕ is the<br />
argument of the first and second harmonic. For the<br />
amplitude of sig, the square sum of the two harmonics,<br />
the measured <strong>in</strong>tensity of ref and the Bessel coefficient<br />
���<br />
�����������������<br />
�