

GlobalWorkplaceReport_2013
GlobalWorkplaceReport_2013
GlobalWorkplaceReport_2013

Create successful ePaper yourself
Turn your PDF publications into a flip-book with our unique Google optimized e-Paper software.
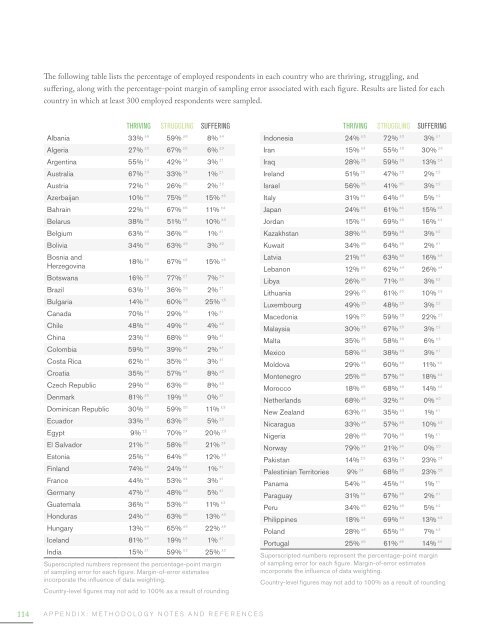
The following table lists the percentage of employed respondents in each country who are thriving, struggling, and<br />
suffering, along with the percentage-point margin of sampling error associated with each figure. Results are listed for each<br />
country in which at least 300 employed respondents were sampled.<br />
Thriving Struggling Suffering<br />
Albania 33% ±6 59% ±6 8% ±4<br />
Algeria 27% ±5 67% ±5 6% ±3<br />
Argentina 55% ±4 42% ±4 3% ±1<br />
Australia 67% ±4 33% ±4 1% ±1<br />
Austria 72% ±5 26% ±5 2% ±2<br />
Azerbaijan 10% ±4 75% ±5 15% ±5<br />
Bahrain 22% ±5 67% ±6 11% ±4<br />
Belarus 38% ±5 51% ±5 10% ±3<br />
Belgium 63% ±6 36% ±6 1% ±1<br />
Bolivia 34% ±5 63% ±5 3% ±2<br />
Bosnia and<br />
Herzegovina<br />
18% ±5 67% ±6 15% ±5<br />
Botswana 16% ±6 77% ±7 7% ±4<br />
Brazil 63% ±3 36% ±3 2% ±1<br />
Bulgaria 14% ±4 60% ±6 25% ±5<br />
Canada 70% ±3 29% ±3 1% ±1<br />
Chile 48% ±4 49% ±4 4% ±2<br />
China 23% ±2 68% ±3 9% ±1<br />
Colombia 59% ±5 39% ±4 2% ±1<br />
Costa Rica 62% ±4 35% ±4 3% ±1<br />
Croatia 35% ±4 57% ±4 8% ±2<br />
Czech Republic 29% ±5 63% ±5 8% ±3<br />
Denmark 81% ±5 19% ±5 0% ±1<br />
Dominican Republic 30% ±5 59% ±5 11% ±3<br />
Ecuador 33% ±5 63% ±5 5% ±2<br />
Egypt 9% ±2 70% ±4 20% ±3<br />
El Salvador 21% ±4 58% ±5 21% ±4<br />
Estonia 25% ±4 64% ±5 12% ±3<br />
Finland 74% ±4 24% ±4 1% ±1<br />
France 44% ±4 53% ±4 3% ±1<br />
Germany 47% ±3 48% ±3 5% ±1<br />
Guatemala 36% ±5 53% ±5 11% ±3<br />
Honduras 24% ±4 63% ±5 13% ±3<br />
Hungary 13% ±4 65% ±5 22% ±5<br />
Iceland 81% ±4 19% ±3 1% ±1<br />
India 15% ±1 59% ±2 25% ±2<br />
Superscripted numbers represent the percentage-point margin<br />
of sampling error for each figure. Margin-of-error estimates<br />
incorporate the influence of data weighting.<br />
Country-level figures may not add to 100% as a result of rounding<br />
Thriving Struggling Suffering<br />
Indonesia 24% ±3 72% ±3 3% ±1<br />
Iran 15% ±4 55% ±6 30% ±6<br />
Iraq 28% ±6 59% ±6 13% ±4<br />
Ireland 51% ±6 47% ±6 2% ±2<br />
Israel 56% ±5 41% ±5 3% ±2<br />
Italy 31% ±4 64% ±5 5% ±2<br />
Japan 24% ±3 61% ±4 15% ±3<br />
Jordan 15% ±4 69% ±5 16% ±4<br />
Kazakhstan 38% ±5 59% ±6 3% ±2<br />
Kuwait 34% ±5 64% ±5 2% ±1<br />
Latvia 21% ±4 63% ±5 16% ±4<br />
Lebanon 12% ±3 62% ±4 26% ±4<br />
Libya 26% ±5 71% ±5 3% ±2<br />
Lithuania 29% ±5 61% ±5 10% ±3<br />
Luxembourg 49% ±5 48% ±5 3% ±2<br />
Macedonia 19% ±6 59% ±8 22% ±7<br />
Malaysia 30% ±5 67% ±5 3% ±2<br />
Malta 35% ±5 58% ±6 6% ±3<br />
Mexico 58% ±3 38% ±3 3% ±1<br />
Moldova 29% ±5 60% ±6 11% ±4<br />
Montenegro 25% ±5 57% ±6 18% ±4<br />
Morocco 18% ±5 68% ±6 14% ±4<br />
Netherlands 68% ±5 32% ±5 0% ±0<br />
New Zealand 63% ±3 35% ±3 1% ±1<br />
Nicaragua 33% ±4 57% ±5 10% ±3<br />
Nigeria 28% ±6 70% ±6 1% ±1<br />
Norway 79% ±4 21% ±4 0% ±0<br />
Pakistan 14% ±3 63% ±4 23% ±4<br />
Palestinian Territories 9% ±4 68% ±6 23% ±6<br />
Panama 54% ±4 45% ±4 1% ±1<br />
Paraguay 31% ±4 67% ±5 2% ±1<br />
Peru 34% ±5 62% ±5 5% ±2<br />
Philippines 18% ±4 69% ±4 13% ±3<br />
Poland 28% ±6 65% ±6 7% ±3<br />
Portugal 25% ±5 61% ±6 14% ±4<br />
Superscripted numbers represent the percentage-point margin<br />
of sampling error for each figure. Margin-of-error estimates<br />
incorporate the influence of data weighting.<br />
Country-level figures may not add to 100% as a result of rounding<br />
114 APPENDIX: METHODOLOGY NOTES AND REFERENCES