WEEKLY ECONOMIC BRIEF â 5 October 2012 Chief ... - LGsuper
WEEKLY ECONOMIC BRIEF â 5 October 2012 Chief ... - LGsuper
WEEKLY ECONOMIC BRIEF â 5 October 2012 Chief ... - LGsuper

Create successful ePaper yourself
Turn your PDF publications into a flip-book with our unique Google optimized e-Paper software.
Economic Update<br />
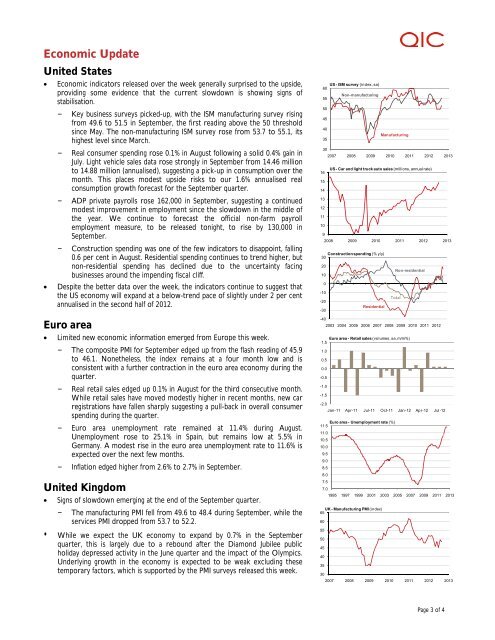
United States<br />
• Economic indicators released over the week generally surprised to the upside,<br />
providing some evidence that the current slowdown is showing signs of<br />
stabilisation.<br />
– Key business surveys picked-up, with the ISM manufacturing survey rising<br />
from 49.6 to 51.5 in September, the first reading above the 50 threshold<br />
since May. The non-manufacturing ISM survey rose from 53.7 to 55.1, its<br />
highest level since March.<br />
– Real consumer spending rose 0.1% in August following a solid 0.4% gain in<br />
July. Light vehicle sales data rose strongly in September from 14.46 million<br />
to 14.88 million (annualised), suggesting a pick-up in consumption over the<br />
month. This places modest upside risks to our 1.6% annualised real<br />
consumption growth forecast for the September quarter.<br />
– ADP private payrolls rose 162,000 in September, suggesting a continued<br />
modest improvement in employment since the slowdown in the middle of<br />
the year. We continue to forecast the official non-farm payroll<br />
employment measure, to be released tonight, to rise by 130,000 in<br />
September.<br />
– Construction spending was one of the few indicators to disappoint, falling<br />
0.6 per cent in August. Residential spending continues to trend higher, but<br />
non-residential spending has declined due to the uncertainty facing<br />
businesses around the impending fiscal cliff.<br />
• Despite the better data over the week, the indicators continue to suggest that<br />
the US economy will expand at a below-trend pace of slightly under 2 per cent<br />
annualised in the second half of <strong>2012</strong>.<br />
Euro area<br />
• Limited new economic information emerged from Europe this week.<br />
– The composite PMI for September edged up from the flash reading of 45.9<br />
to 46.1. Nonetheless, the index remains at a four month low and is<br />
consistent with a further contraction in the euro area economy during the<br />
quarter.<br />
– Real retail sales edged up 0.1% in August for the third consecutive month.<br />
While retail sales have moved modestly higher in recent months, new car<br />
registrations have fallen sharply suggesting a pull-back in overall consumer<br />
spending during the quarter.<br />
– Euro area unemployment rate remained at 11.4% during August.<br />
Unemployment rose to 25.1% in Spain, but remains low at 5.5% in<br />
Germany. A modest rise in the euro area unemployment rate to 11.6% is<br />
expected over the next few months.<br />
– Inflation edged higher from 2.6% to 2.7% in September.<br />
United Kingdom<br />
• Signs of slowdown emerging at the end of the September quarter.<br />
– The manufacturing PMI fell from 49.6 to 48.4 during September, while the<br />
services PMI dropped from 53.7 to 52.2.<br />
• While we expect the UK economy to expand by 0.7% in the September<br />
quarter, this is largely due to a rebound after the Diamond Jubilee public<br />
holiday depressed activity in the June quarter and the impact of the Olympics.<br />
Underlying growth in the economy is expected to be weak excluding these<br />
temporary factors, which is supported by the PMI surveys released this week.<br />
US -ISM survey (index, sa)<br />
60<br />
Non-manufacturing<br />
55<br />
50<br />
45<br />
40<br />
Manufacturing<br />
35<br />
30<br />
2007 2008 2009 2010 2011 <strong>2012</strong> 2013<br />
US -Car and light truck auto sales (millions, annual rate)<br />
16<br />
15<br />
14<br />
13<br />
12<br />
11<br />
10<br />
9<br />
2008 2009 2010 2011 <strong>2012</strong> 2013<br />
Construction spending (% y/y)<br />
30<br />
20<br />
10<br />
0<br />
-10<br />
-20<br />
Residential<br />
-30<br />
-40<br />
Non-residential<br />
Total<br />
2003 2004 2005 2006 2007 2008 2009 2010 2011 <strong>2012</strong><br />
Euro area -Retailsales (volumes, sa, m/m%)<br />
1.5<br />
1.0<br />
0.5<br />
0.0<br />
-0.5<br />
-1.0<br />
-1.5<br />
-2.0<br />
Jan-11 Apr-11 Jul-11 Oct-11 Jan-12 Apr-12 Jul-12<br />
Euro area -Unemployment rate (%)<br />
11.5<br />
11.0<br />
10.5<br />
10.0<br />
9.5<br />
9.0<br />
8.5<br />
8.0<br />
7.5<br />
7.0<br />
1995 1997 1999 2001 2003 2005 2007 2009 2011 2013<br />
UK -Manufacturing PMI (index)<br />
65<br />
60<br />
55<br />
50<br />
45<br />
40<br />
35<br />
30<br />
2007 2008 2009 2010 2011 <strong>2012</strong> 2013<br />
Page 3 of 4