WEEKLY ECONOMIC BRIEF â 12 October 2012 Chief ... - LGsuper
WEEKLY ECONOMIC BRIEF â 12 October 2012 Chief ... - LGsuper
WEEKLY ECONOMIC BRIEF â 12 October 2012 Chief ... - LGsuper

Create successful ePaper yourself
Turn your PDF publications into a flip-book with our unique Google optimized e-Paper software.
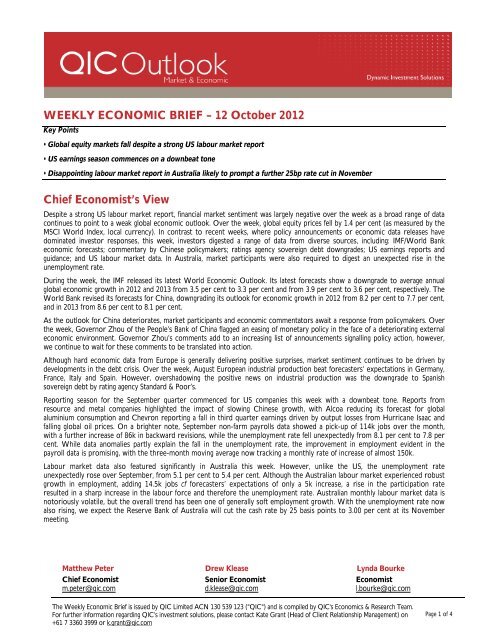
<strong>WEEKLY</strong> <strong>ECONOMIC</strong> <strong>BRIEF</strong> – <strong>12</strong> <strong>October</strong> 20<strong>12</strong><br />
Key Points<br />
• Global equity markets fall despite a strong US labour market report<br />
• US earnings season commences on a downbeat tone<br />
• Disappointing labour market report in Australia likely to prompt a further 25bp rate cut in November<br />
<strong>Chief</strong> Economist’s View<br />
Despite a strong US labour market report, financial market sentiment was largely negative over the week as a broad range of data<br />
continues to point to a weak global economic outlook. Over the week, global equity prices fell by 1.4 per cent (as measured by the<br />
MSCI World Index, local currency). In contrast to recent weeks, where policy announcements or economic data releases have<br />
dominated investor responses, this week, investors digested a range of data from diverse sources, including: IMF/World Bank<br />
economic forecasts; commentary by Chinese policymakers; ratings agency sovereign debt downgrades; US earnings reports and<br />
guidance; and US labour market data. In Australia, market participants were also required to digest an unexpected rise in the<br />
unemployment rate.<br />
During the week, the IMF released its latest World Economic Outlook. Its latest forecasts show a downgrade to average annual<br />
global economic growth in 20<strong>12</strong> and 2013 from 3.5 per cent to 3.3 per cent and from 3.9 per cent to 3.6 per cent, respectively. The<br />
World Bank revised its forecasts for China, downgrading its outlook for economic growth in 20<strong>12</strong> from 8.2 per cent to 7.7 per cent,<br />
and in 2013 from 8.6 per cent to 8.1 per cent.<br />
As the outlook for China deteriorates, market participants and economic commentators await a response from policymakers. Over<br />
the week, Governor Zhou of the People’s Bank of China flagged an easing of monetary policy in the face of a deteriorating external<br />
economic environment. Governor Zhou’s comments add to an increasing list of announcements signalling policy action, however,<br />
we continue to wait for these comments to be translated into action.<br />
Although hard economic data from Europe is generally delivering positive surprises, market sentiment continues to be driven by<br />
developments in the debt crisis. Over the week, August European industrial production beat forecasters’ expectations in Germany,<br />
France, Italy and Spain. However, overshadowing the positive news on industrial production was the downgrade to Spanish<br />
sovereign debt by rating agency Standard & Poor’s.<br />
Reporting season for the September quarter commenced for US companies this week with a downbeat tone. Reports from<br />
resource and metal companies highlighted the impact of slowing Chinese growth, with Alcoa reducing its forecast for global<br />
aluminium consumption and Chevron reporting a fall in third quarter earnings driven by output losses from Hurricane Isaac and<br />
falling global oil prices. On a brighter note, September non-farm payrolls data showed a pick-up of 114k jobs over the month,<br />
with a further increase of 86k in backward revisions, while the unemployment rate fell unexpectedly from 8.1 per cent to 7.8 per<br />
cent. While data anomalies partly explain the fall in the unemployment rate, the improvement in employment evident in the<br />
payroll data is promising, with the three-month moving average now tracking a monthly rate of increase of almost 150k.<br />
Labour market data also featured significantly in Australia this week. However, unlike the US, the unemployment rate<br />
unexpectedly rose over September, from 5.1 per cent to 5.4 per cent. Although the Australian labour market experienced robust<br />
growth in employment, adding 14.5k jobs cf forecasters’ expectations of only a 5k increase, a rise in the participation rate<br />
resulted in a sharp increase in the labour force and therefore the unemployment rate. Australian monthly labour market data is<br />
notoriously volatile, but the overall trend has been one of generally soft employment growth. With the unemployment rate now<br />
also rising, we expect the Reserve Bank of Australia will cut the cash rate by 25 basis points to 3.00 per cent at its November<br />
meeting.<br />
Matthew Peter<br />
<strong>Chief</strong> Economist<br />
m.peter@qic.com<br />
Drew Klease<br />
Senior Economist<br />
d.klease@qic.com<br />
Lynda Bourke...<br />
Economist<br />
l.bourke@qic.com<br />
The Weekly Economic Brief is issued by QIC Limited ACN 130 539 <strong>12</strong>3 ("QIC") and is compiled by QIC's Economics & Research Team.<br />
For further information regarding QIC’s investment solutions, please contact Kate Grant (Head of Client Relationship Management) on<br />
+61 7 3360 3999 or k.grant@qic.com<br />
Page 1 of 4
Financial Market Update<br />
• Global equity markets fell in the last week as global growth projections from both the IMF and World Bank were revised lower,<br />
Spain’s credit rating was downgraded by Standard and Poor’s to just above junk status, and the US earnings reporting season<br />
kicked off on a poor note. Japanese equities underperformed, with falling machinery orders seen as evidence that territorial<br />
disputes with China are beginning to have a real impact on the economy. The MSCI World Index fell by 1.4 per cent during the<br />
week, but remains largely unchanged so far this month and is 10 per cent higher than the start of the year.<br />
• In the US, the S&P500 fell by 2.0 per cent this week, while the tech-heavy NASDAQ fell by 3.2 per cent as the technology<br />
sector underperformed. The key earnings report so far this week was from aluminium producer Alcoa, which reported a loss<br />
from continuing operations, and reduced its estimates for global aluminium demand due to weakness in China in the second half<br />
of the year. Oil company Chevron reported a fall in Q3 earnings driven by output losses from Hurricane Isaac and falling prices.<br />
Consumer stocks have fared better, however, with retailer Wal-Mart commenting that back-to-school sales were very strong,<br />
while Costco beat expectations with strong volume growth induced by discounting. Bloomberg reports that analyst<br />
expectations for Q3 are quite downbeat, with earnings-per-share of S&P500 companies expected to fall 1.7 per cent in the third<br />
quarter and sales falling by 0.6 per cent.<br />
• Ten-year government bond yields were unchanged in the US this week, but rose in Europe as hard economic data suggested<br />
that the European economy is not as weak as suggested by recent survey measures. In the US, non-farm payroll data for<br />
September were stronger than expected (after allowing for revisions to the last two months) and the unemployment rate fell<br />
from 8.1 per cent to 7.8 per cent. This helped offset the negative impact from IMF/World Bank growth projections.<br />
• In currency markets, the US dollar strengthened against the Euro and Sterling, but weakened slightly against the Yen and $A.<br />
The Euro was weighed down by an IMF report that estimated European banks may need to sell an additional $4.5 trillion of<br />
assets to restructure their balance sheets in a downside global growth scenario, up 18 per cent on their April estimate.<br />
Table 1. Financial market movements, 4 - 11 <strong>October</strong> 20<strong>12</strong><br />
Equity markets Level Change<br />
MSCI World Index (local currency) 914.1 -1.4%<br />
US - S&P 500 1,432.8 -2.0%<br />
Japan - Nikkei 8,546.8 -3.1%<br />
UK - FTSE 100 5,829.8 0.0%<br />
Germany - DAX 7,281.7 -0.3%<br />
France - CAC 3,413.7 0.4%<br />
Australia - S&P/ASX 200 4,483.5 0.7%<br />
Fixed interest (10 yr sovereign yields) Yield Change<br />
US 1.67% -0.3 bps<br />
Japan 0.76% -1.6 bps<br />
UK 1.78% 8.0 bps<br />
Germany 1.50% 5.6 bps<br />
Australia 3.03% 4.8 bps<br />
Foreign exchange Rate Change<br />
USD-JPY 78.340 -0.2%<br />
EUR-USD 1.293 -0.7%<br />
GBP-USD 1.605 -0.9%<br />
AUD-USD 1.026 0.2%<br />
Commodity markets Level Change<br />
WTI oil price (US$/barrel) 92.07 0.4%<br />
CRB index 308.87 -0.5%<br />
Other Level Change<br />
VIX 15.59 7.1%<br />
Source: Bloomberg<br />
Page 2 of 4
Economic Update<br />
United States<br />
• Labour market conditions continue to gradually improve in the US<br />
– Non-farm payroll employment rose by 114,000 in September, in line with<br />
market expectations but modestly below our forecast of 130,000.<br />
However, substantial backward revisions to July and August, totalling<br />
86,000 jobs, revealed a healthier labour market in the September quarter.<br />
Over the past three months, the average monthly gain in payrolls has been<br />
146,000 a significant improvement from the 67,000 average gain in the<br />
three months to June.<br />
– The big surprise in the labour market report was the sharp fall in the<br />
unemployment rate, which fell from 8.1% to 7.8%. This was due to an<br />
873,000 gain in employment according to the household survey.<br />
– Initial jobless claims fell by 30,000 to 339,000 in the week ending <strong>October</strong><br />
6, the lowest level since February 2008.<br />
– The unexpectedly sharp fall in the unemployment rate and drop in jobless<br />
claims likely reflects statistical noise and therefore is expected to be<br />
largely reversed in the next data release. Nonetheless, looking through<br />
the volatility there has been a clear gradual improvement in the US labour<br />
market over recent months and we expect this trend will continue<br />
through to the end of the year. Whether it can continue into 2013, will<br />
depend on whether US politicians enact policies to avoid the impending<br />
fiscal cliff.<br />
• Trade deficit widens during August<br />
– The trade deficit widened from US$42.5 billion to US$44.2 billion with<br />
exports falling more than imports over the month.<br />
– Based on the trade data to date, we expect net exports to subtract 30<br />
basis points from annualised real GDP growth in the September quarter<br />
(which we currently forecast at 1.8%).<br />
Euro area<br />
• Incoming ‘hard’ activity data continues to point towards a smaller contraction<br />
in the September quarter than suggested by the survey indicators<br />
– Industrial production (IP) for the euro area looks set to rise in August for<br />
the second consecutive month. Individual country reports revealed a 1.7%<br />
gain in Italy over the month, a 1.5% gain in France, a 1.3% gain in Spain, a<br />
2.5% gain in Greece, a 0.5% gain in the Netherlands, a 6.8% gain in<br />
Portugal and a flat result in Ireland. While IP fell 0.5% in Germany, this<br />
followed a strong gain in the previous month, with IP up more than 5%<br />
annualised in the quarter to date.<br />
– Germany’s seasonally adjusted trade surplus rose from €16.3 to €18.3<br />
billion due to a 2.4% gain in exports.<br />
– Overall, in our view the ‘hard’ activity data continues to suggest a<br />
contraction in real GDP of 0.2% in the euro area during the September<br />
quarter, slightly better than the 0.6% fall suggested by the PMI surveys.<br />
United Kingdom<br />
• Activity deteriorates in August after the post Jubilee holiday bounce in July.<br />
– Industrial production fell 0.5% in August after a 2.8% gain in July.<br />
– The trade deficit deteriorated from £1.7 billion to £4.2 billion due to a<br />
2.4% drop in exports and a 3.4% gain in imports.<br />
– We continue to expect the UK economy to expand by 0.7% in the<br />
September quarter, but this is largely due to a rebound after the Diamond<br />
Jubilee public holiday and the impact of the Olympics.<br />
US -Change in non-farm payrolls (sa, 000s)<br />
300<br />
250<br />
200<br />
150<br />
100<br />
11<br />
10<br />
9<br />
8<br />
7<br />
6<br />
5<br />
4<br />
50<br />
480<br />
460<br />
440<br />
420<br />
400<br />
380<br />
360<br />
340<br />
320<br />
-25<br />
-30<br />
-35<br />
-40<br />
-45<br />
-50<br />
-55<br />
-60<br />
-65<br />
-70<br />
0<br />
3-month<br />
moving average<br />
Jul-11 Oct-11 Jan-<strong>12</strong> Apr-<strong>12</strong> Jul-<strong>12</strong><br />
US -Unemployment rate (%)<br />
2005 2007 2009 2011 2013<br />
US -Initial jobless claims (sa, 000s)<br />
Claims<br />
4-wk moving average<br />
Jan-11 Apr-11 Jul-11 Oct-11 Jan-<strong>12</strong> Apr-<strong>12</strong> Jul-<strong>12</strong> Oct-<strong>12</strong><br />
US -Trade balance (sa, $USbns)<br />
-20<br />
2003 2005 2007 2009 2011 2013<br />
Germany -Industrialproduction (sa, index, 2005=100)<br />
<strong>12</strong>0<br />
115<br />
110<br />
105<br />
100<br />
103<br />
102<br />
101<br />
100<br />
99<br />
98<br />
97<br />
95<br />
90<br />
85<br />
2007 2009 2011 2013<br />
UK -Industrial production (sa, Index, 2008 = 100)<br />
104<br />
2009 2010 2011 20<strong>12</strong> 2013<br />
Page 3 of 4
Japan<br />
• Bank of Japan left monetary policy unchanged at their meeting last week.<br />
6<br />
5<br />
SouthKorea-Policy rate (%)<br />
South Korea<br />
• Bank of Korea cut the base rate by 25bps to 2.75%.<br />
– The move was widely anticipated by the market, although the decision was<br />
not unanimous among committee members.<br />
– The BOK cut their growth forecasts from 3% to 2.4% for 20<strong>12</strong> and from<br />
2.8% to 3.2% for 2013 due to weaker external and domestic demand.<br />
– The BOK also announced their inflation target for 2013-2015 at 2.5%-3.5%,<br />
narrower than the current 2-4% range.<br />
Australia<br />
• Unemployment rate rises sharply in September<br />
– The unemployment rate rose sharply from 5.1% to 5.4% in September.<br />
– Although employment rose a stronger-than-expected 14,500 over the<br />
month, the unemployment rate rose sharply due to a jump in the size of<br />
the labour force, with the participation rate rising from 65% to 65.2%.<br />
• Both business and consumer confidence remains subdued<br />
– Business conditions fell 3.5pts to -3.1 in September. Although, business<br />
confidence improved 2.6pts to 0 in September, it remains at a low level.<br />
– Consumer sentiment rose 1% in <strong>October</strong> to 99.2, remaining under 100<br />
for the eighth consecutive month. It appears the surprise move by the<br />
RBA to cut the cash rate to 3.25% on <strong>October</strong> 2 has had little impact on<br />
consumer confidence.<br />
• With confidence remaining weak and the unemployment rate beginning to rise,<br />
we continue to expect the RBA will cut rates by a further 25 basis points to<br />
3.00% in November.<br />
4<br />
3<br />
2<br />
1<br />
0<br />
2006 2007 2008 2009 2010 2011 20<strong>12</strong> 2013<br />
Australia -Unemployment rate (sa, %)<br />
6.0<br />
5.5<br />
5.0<br />
4.5<br />
4.0<br />
3.5<br />
2004 2006 2008 2010 20<strong>12</strong><br />
Australia -NAB Business conditions and confidence (sa, net balance)<br />
20<br />
15<br />
10<br />
5<br />
0<br />
-5<br />
-10<br />
-15<br />
-20<br />
-25<br />
-30<br />
-35<br />
2007 2008 2009 2010 2011 20<strong>12</strong> 2013<br />
Australia -Westpac consumer confidence (index)<br />
<strong>12</strong>5<br />
<strong>12</strong>0<br />
115<br />
110<br />
105<br />
100<br />
95<br />
90<br />
85<br />
80<br />
75<br />
Confidence<br />
Conditions<br />
2002 2004 2006 2008 2010 20<strong>12</strong><br />
Sources: Thomson Reuters, ABS<br />
QIC is a wholesale funds manager and its products and services are not directly available to retail investors. QIC is a company<br />
government owned corporation constituted under the Queensland Investment Corporation Act 1991 (Qld). QIC is regulated by<br />
State Government legislation pertaining to government owned corporations in addition to the Corporations Act 2001<br />
(“Corporations Act”). QIC does not hold an Australian financial services (“AFS”) licence and certain provisions (including the<br />
financial product disclosure provisions) of the Corporations Act do not apply to QIC. Please note however that some wholly<br />
owned subsidiaries of QIC have been issued with an AFS licence and are required to comply with the Corporations Act. QIC, its<br />
subsidiaries, associated entities, their directors, employees and representatives (“the QIC Parties”) do not warrant the accuracy<br />
or completeness of the information contained in this document (“the Information”). To the extent permitted by law, the QIC<br />
Parties disclaim all responsibility and liability for any loss or damage of any nature whatsoever which may be suffered by any<br />
person directly or indirectly through relying on the Information, whether that loss or damage is caused by any fault or negligence<br />
of the QIC Parties or otherwise. The Information is not intended to constitute advice and persons should seek professional<br />
advice before relying on the Information. QIC owns the copyright and all other intellectual property rights in all Information, or<br />
has a licence or agreement to use that copyright where it is owned by someone else. You may only reproduce the Information<br />
for personal or non-commercial use, and it must not be distributed or transmitted to any other person, or used in any other<br />
way (except to the extent permitted by law).<br />
Page 4 of 4