Enrollment Management Strategic Plan 2012-2013 - Institutional ...
Enrollment Management Strategic Plan 2012-2013 - Institutional ...
Enrollment Management Strategic Plan 2012-2013 - Institutional ...

You also want an ePaper? Increase the reach of your titles
YUMPU automatically turns print PDFs into web optimized ePapers that Google loves.
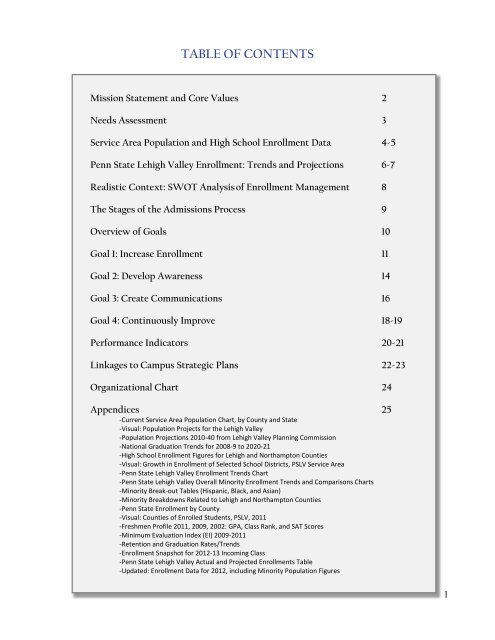
TABLE OF CONTENTS<br />
Mission Statement and Core Values 2<br />
Needs Assessment 3<br />
Service Area Population and High School <strong>Enrollment</strong> Data 4-5<br />
Penn State Lehigh Valley <strong>Enrollment</strong>: Trends and Projections 6-7<br />
Realistic Context: SWOT Analysis of <strong>Enrollment</strong> <strong>Management</strong> 8<br />
The Stages of the Admissions Process 9<br />
Overview of Goals 10<br />
Goal 1: Increase <strong>Enrollment</strong> 11<br />
Goal 2: Develop Awareness 14<br />
Goal 3: Create Communications 16<br />
Goal 4: Continuously Improve 18-19<br />
Performance Indicators 20-21<br />
Linkages to Campus <strong>Strategic</strong> <strong>Plan</strong>s 22-23<br />
Organizational Chart 24<br />
Appendices 25<br />
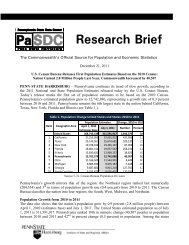
-Current Service Area Population Chart, by County and State<br />
-Visual: Population Projects for the Lehigh Valley<br />
-Population Projections 2010-40 from Lehigh Valley <strong>Plan</strong>ning Commission<br />
-National Graduation Trends for 2008-9 to 2020-21<br />
-High School <strong>Enrollment</strong> Figures for Lehigh and Northampton Counties<br />
-Visual: Growth in <strong>Enrollment</strong> of Selected School Districts, PSLV Service Area<br />
-Penn State Lehigh Valley <strong>Enrollment</strong> Trends Chart<br />
-Penn State Lehigh Valley Overall Minority <strong>Enrollment</strong> Trends and Comparisons Charts<br />
-Minority Break-out Tables (Hispanic, Black, and Asian)<br />
-Minority Breakdowns Related to Lehigh and Northampton Counties<br />
-Penn State <strong>Enrollment</strong> by County<br />
-Visual: Counties of Enrolled Students, PSLV, 2011<br />
-Freshmen Profile 2011, 2009, 2002: GPA, Class Rank, and SAT Scores<br />
-Minimum Evaluation Index (EI) 2009-2011<br />
-Retention and Graduation Rates/Trends<br />
-<strong>Enrollment</strong> Snapshot for <strong>2012</strong>-13 Incoming Class<br />
-Penn State Lehigh Valley Actual and Projected <strong>Enrollment</strong>s Table<br />
-Updated: <strong>Enrollment</strong> Data for <strong>2012</strong>, including Minority Population Figures<br />
1