Enrollment Management Strategic Plan 2012-2013 - Institutional ...
Enrollment Management Strategic Plan 2012-2013 - Institutional ...
Enrollment Management Strategic Plan 2012-2013 - Institutional ...

Create successful ePaper yourself
Turn your PDF publications into a flip-book with our unique Google optimized e-Paper software.
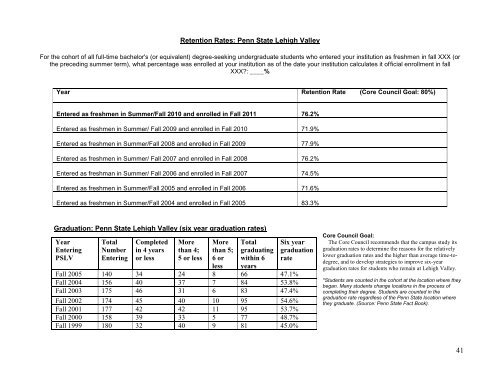
Retention Rates: Penn State Lehigh Valley<br />
For the cohort of all full-time bachelor's (or equivalent) degree-seeking undergraduate students who entered your institution as freshmen in fall XXX (or<br />
the preceding summer term), what percentage was enrolled at your institution as of the date your institution calculates it official enrollment in fall<br />
XXX?: ____%<br />
Year Retention Rate (Core Council Goal: 80%)<br />
Entered as freshmen in Summer/Fall 2010 and enrolled in Fall 2011 76.2%<br />
Entered as freshmen in Summer/ Fall 2009 and enrolled in Fall 2010 71.9%<br />
Entered as freshmen in Summer/Fall 2008 and enrolled in Fall 2009 77.9%<br />
Entered as freshmen in Summer/ Fall 2007 and enrolled in Fall 2008 76.2%<br />
Entered as freshman in Summer/ Fall 2006 and enrolled in Fall 2007 74.5%<br />
Entered as freshmen in Summer/Fall 2005 and enrolled in Fall 2006 71.6%<br />
Entered as freshmen in Summer/Fall 2004 and enrolled in Fall 2005 83.3%<br />
Graduation: Penn State Lehigh Valley (six year graduation rates)<br />
Year<br />
Entering<br />
PSLV<br />
Total<br />
Number<br />
Entering<br />
Completed<br />
in 4 years<br />
or less<br />
More<br />
than 4;<br />
5 or less<br />
More<br />
than 5;<br />
6 or<br />
less<br />
Total<br />
graduating<br />
within 6<br />
years<br />
Six year<br />
graduation<br />
rate<br />
Fall 2005 140 34 24 8 66 47.1%<br />
Fall 2004 156 40 37 7 84 53.8%<br />
Fall 2003 175 46 31 6 83 47.4%<br />
Fall 2002 174 45 40 10 95 54.6%<br />
Fall 2001 177 42 42 11 95 53.7%<br />
Fall 2000 158 39 33 5 77 48.7%<br />
Fall 1999 180 32 40 9 81 45.0%<br />
Core Council Goal:<br />
The Core Council recommends that the campus study its<br />
graduation rates to determine the reasons for the relatively<br />
lower graduation rates and the higher than average time-todegree,<br />
and to develop strategies to improve six-year<br />
graduation rates for students who remain at Lehigh Valley.<br />
*Students are counted in the cohort at the location where they<br />
began. Many students change locations in the process of<br />
completing their degree. Students are counted in the<br />
graduation rate regardless of the Penn State location where<br />
they graduate. (Source: Penn State Fact Book).<br />
41