- Page 1 and 2: Contract No.: 0600-03-60130 MPR Ref
- Page 3 and 4: A CKNOWLEDGMENTS This report reflec
- Page 5 and 6: C ONTENTS Chapter Page ACRONYMS ...
- Page 7 and 8: Chapter Page V (CONTINUED) B. SERVI
- Page 9 and 10: Chapter Page X (CONTINUED) B. RECEN
- Page 11 and 12: Chapter Page XIII (CONTINUED) 4. Lo
- Page 13 and 14: E XHIBITS Exhibit Page I.1 POPULATI
- Page 15 and 16: Exhibit Page IV.4 AGENCIES AND INDI
- Page 17 and 18: Exhibit Page VI.7 OCCUPATION AND IN
- Page 19 and 20: Exhibit Page X.2 REVENUES AND TICKE
- Page 21 and 22: A CRONYMS The following acronyms ar
- Page 23 and 24: E XECUTIVE S UMMARY The Ticket to W
- Page 25 and 26: Beneficiary Demand for Employment S
- Page 27 and 28: xxvii obtain Tickets from many of t
- Page 29 and 30: IMPACTS OF TTW ON BENEFICIARY BEHAV
- Page 31 and 32: xxxi Furthermore, the changes sough
- Page 33 and 34: C HAPTER I I NTRODUCTION The Ticket
- Page 35 and 36: operating capital and introducing a
- Page 37 and 38: 4. Extended Medicare Coverage. Medi
- Page 39 and 40: serve beneficiaries whom they think
- Page 41 and 42: procedures that accommodate the nee
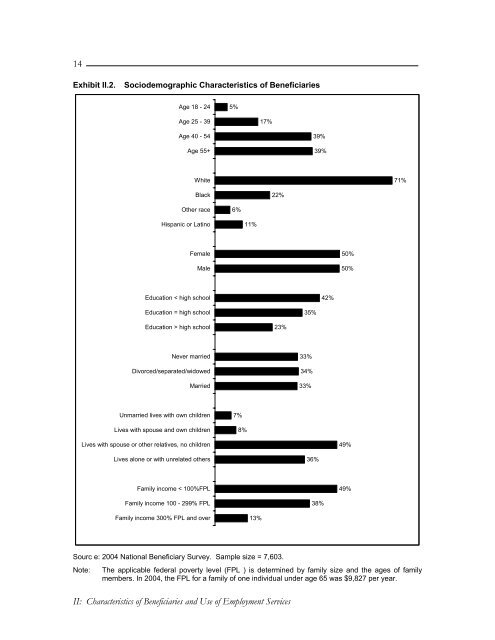
- Page 43 and 44: C HAPTER II C HARACTERISTICS OF W O
- Page 45: eport receiving any other non-SSA c
- Page 49 and 50: Exhibit II.3. Age at Disability Ons
- Page 51 and 52: Exhibit II.5. Percent of Beneficiar
- Page 53 and 54: Exhibit II.7. Current General Healt
- Page 55 and 56: for not working, although many more
- Page 57 and 58: Phase 1 states where TTW had been f
- Page 59 and 60: 3. School Enrollment and Degree-See
- Page 61 and 62: program like TTW could address. Whe
- Page 63 and 64: C HAPTER III B ENEFICIARY P ARTICIP
- Page 65 and 66: stands out as a particularly import
- Page 67 and 68: the beginning of each rollout, rate
- Page 69 and 70: a substantial difference between th
- Page 71 and 72: Exhibit III.4. Percentage of Benefi
- Page 73 and 74: in-use Tickets were under the tradi
- Page 75 and 76: period 8 to 15 months after the sta
- Page 77 and 78: South Dakota’s participation rate
- Page 79 and 80: • Was already using one of the wo
- Page 81 and 82: those with less than a high school
- Page 83 and 84: fact that such individuals have ent
- Page 85 and 86: experienced disability onset at age
- Page 87 and 88: C HAPTER IV E XPERIENCES OF TTW PAR
- Page 89 and 90: • Most had positive experiences w
- Page 91 and 92: some information on ENs before assi
- Page 93 and 94: Exhibit IV.5. Participant Awareness
- Page 95 and 96: designated in their individualized
- Page 97 and 98:
cited problems with both types of p
- Page 99 and 100:
Exhibit IV.12. Participants’ Pers
- Page 101 and 102:
C HAPTER V E XPERIENCES OF TTW PART
- Page 103 and 104:
participants were aware that they h
- Page 105 and 106:
Exhibit V.2. Selected Reasons for U
- Page 107 and 108:
procedures), but TTW service users
- Page 109 and 110:
C. SCHOOL ENROLLMENT AND DEGREE-SEE
- Page 111 and 112:
Exhibit V.8. Phase 1 Beneficiaries
- Page 113 and 114:
Exhibit V.9. Service Use Among Bene
- Page 115 and 116:
Exhibit V.11. Types of Services Use
- Page 117 and 118:
C HAPTER VI E XPERIENCES OF TTW PAR
- Page 119 and 120:
have the same level of alternative
- Page 121 and 122:
Exhibit VI.1. Employment Rates for
- Page 123 and 124:
Exhibit VI.3. Benefits Associated w
- Page 125 and 126:
pipeline cases in terms of characte
- Page 127 and 128:
Exhibit VI.7. Occupation and Indust
- Page 129 and 130:
Exhibit VI.9. Employer-Provided Acc
- Page 131 and 132:
Exhibit VI.11. Job Satisfaction Amo
- Page 133 and 134:
C HAPTER VII N ONPARTICIPATION IN T
- Page 135 and 136:
percentage of beneficiaries worked
- Page 137 and 138:
somewhat higher Section 1619(b) use
- Page 139 and 140:
Exhibit VII.4. Rates of Unsuccessfu
- Page 141 and 142:
children living with them. They are
- Page 143 and 144:
Exhibit VII.6. Simulated Probabilit
- Page 145 and 146:
The above discussion is not intende
- Page 147 and 148:
C HAPTER VIII E MPLOYMENT N ETWORK
- Page 149 and 150:
e an “unpopular” program. In ou
- Page 151 and 152:
Exhibit VIII.3. Ticket Assignments
- Page 153 and 154:
Exhibit VIII.6. Effective Provider
- Page 155 and 156:
Exhibit VIII.8. Distribution of EN
- Page 157 and 158:
This analysis is limited to earning
- Page 159 and 160:
In 2003, SSA introduced the Certifi
- Page 161 and 162:
C HAPTER IX E MPLOYMENT N ETWORK R
- Page 163 and 164:
eneficiary assigning a Ticket. Howe
- Page 165 and 166:
payments, we estimate that follow-u
- Page 167 and 168:
for each additional outcome payment
- Page 169 and 170:
Exhibit IX.3. Comparison of Current
- Page 171 and 172:
percent of the average benefit, kee
- Page 173 and 174:
• An EN could break even by reduc
- Page 175 and 176:
Exhibit IX.4. Hypothetical EN Reven
- Page 177 and 178:
72 percent, increasing revenue by 1
- Page 179 and 180:
would have to place into employment
- Page 181 and 182:
C HAPTER X E XPERIENCE OF S ELECTED
- Page 183 and 184:
2. Financing TTW For nearly all of
- Page 185 and 186:
employment services) did not expand
- Page 187 and 188:
that would reduce their costs and/o
- Page 189 and 190:
Of the remaining 11 ENs, 4 have acc
- Page 191 and 192:
3. Funding and Services In general,
- Page 193 and 194:
Exhibit X.1. EN Revenues per Ticket
- Page 195 and 196:
the rest away is the most essential
- Page 197 and 198:
consistently has trouble obtaining
- Page 199 and 200:
practices may be worth considering,
- Page 201 and 202:
C HAPTER XI E XPERIENCE OF S TATE V
- Page 203 and 204:
• Priority category one includes
- Page 205 and 206:
Ticket until they know whether the
- Page 207 and 208:
may only check in with the client q
- Page 209 and 210:
Claims Allowed The number of benefi
- Page 211 and 212:
counselors, emphasizing its own eli
- Page 213 and 214:
traditional system—a feature in o
- Page 215 and 216:
C HAPTER XII TTW PROGRAM I MPLEMENT
- Page 217 and 218:
office had more experience processi
- Page 219 and 220:
eneficiaries, down from 65,000 to 7
- Page 221 and 222:
C. INFORMING PROVIDERS To increase
- Page 223 and 224:
The Program Manager has produced tw
- Page 225 and 226:
1. Training and Technical Assistanc
- Page 227 and 228:
verification, store EN data, and ge
- Page 229 and 230:
ehabilitation services. The TTW leg
- Page 231 and 232:
C HAPTER XIII TTW OUTCOMES AND I MP
- Page 233 and 234:
Additionally, the relatively small
- Page 235 and 236:
included an upper age restriction t
- Page 237 and 238:
Exhibit XIII.2. Summary of Outcome
- Page 239 and 240:
were living in states where TTW had
- Page 241 and 242:
D. IMPACTS ON SERVICE ENROLLMENT Th
- Page 243 and 244:
The aggregate upper-bound estimates
- Page 245 and 246:
eneficiaries (approximately 10 perc
- Page 247 and 248:
earlier cohorts indicate the presen
- Page 249 and 250:
The opportunities for generating ad
- Page 251 and 252:
C HAPTER XIV P AYMENTS M ADE U NDER
- Page 253 and 254:
We do not have any data on the exte
- Page 255 and 256:
those with no payments) was $258. S
- Page 257 and 258:
cohorts. Also considered are the di
- Page 259 and 260:
earnings at a level that would redu
- Page 261 and 262:
in that group. Each graph shows the
- Page 263 and 264:
Exhibit XIV.7. Tickets with Payment
- Page 265 and 266:
Even if the percentage of participa
- Page 267 and 268:
C HAPTER XV TTW PARTICIPATION BY B
- Page 269 and 270:
provider and payment types to which
- Page 271 and 272:
cost accommodations. Appendix E sho
- Page 273 and 274:
Exhibit XV.2. Selected Beneficiary
- Page 275 and 276:
1 and 2 differ in some important re
- Page 277 and 278:
etardation as a condition causing l
- Page 279 and 280:
Exhibit XV.5 clearly shows the rela
- Page 281 and 282:
C HAPTER XVI C ONCLUSIONS AND I MPL
- Page 283 and 284:
difference might reflect unrealisti
- Page 285 and 286:
TTW has not yet substantially expan
- Page 287 and 288:
SSA’s proposed new regulations of
- Page 289 and 290:
the administrative and other effort
- Page 291 and 292:
oll out gradually over the period,
- Page 293 and 294:
R EFERENCES Adequacy of Incentives
- Page 295 and 296:
Mashaw, Jerry L., and Virginia P. R
- Page 297 and 298:
White, Justin S., William E. Black,
- Page 299 and 300:
A PPENDIX A T ICKET TO W ORK T IMEL
- Page 301:
Table A.2. States and Territories I


