

Tailpipe Rule - GlobalWarming.org
Tailpipe Rule - GlobalWarming.org
Tailpipe Rule - GlobalWarming.org

You also want an ePaper? Increase the reach of your titles
YUMPU automatically turns print PDFs into web optimized ePapers that Google loves.
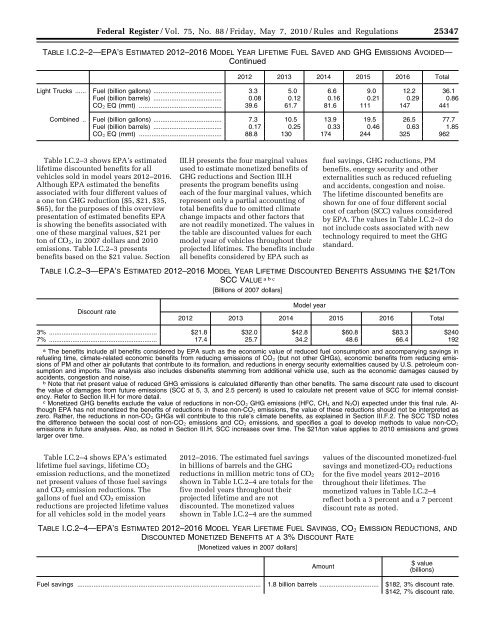
Federal Register / Vol. 75, No. 88 / Friday, May 7, 2010 / <strong>Rule</strong>s and Regulations<br />
25347<br />
TABLE I.C.2–2—EPA’S ESTIMATED 2012–2016 MODEL YEAR LIFETIME FUEL SAVED AND GHG EMISSIONS AVOIDED—<br />
Continued<br />
2012 2013 2014 2015 2016 Total<br />
Light Trucks ...... Fuel (billion gallons) ...................................... 3 .3 5 .0 6 .6 9 .0 12 .2 36 .1<br />
Fuel (billion barrels) ...................................... 0 .08 0 .12 0 .16 0 .21 0 .29 0 .86<br />
CO 2 EQ (mmt) .............................................. 39 .6 61 .7 81 .6 111 147 441<br />
Combined .. Fuel (billion gallons) ...................................... 7 .3 10 .5 13 .9 19 .5 26 .5 77 .7<br />
Fuel (billion barrels) ...................................... 0 .17 0 .25 0 .33 0 .46 0 .63 1 .85<br />
CO 2 EQ (mmt) .............................................. 88 .8 130 174 244 325 962<br />
Table I.C.2–3 shows EPA’s estimated<br />
lifetime discounted benefits for all<br />
vehicles sold in model years 2012–2016.<br />
Although EPA estimated the benefits<br />
associated with four different values of<br />
a one ton GHG reduction ($5, $21, $35,<br />
$65), for the purposes of this overview<br />
presentation of estimated benefits EPA<br />
is showing the benefits associated with<br />
one of these marginal values, $21 per<br />
ton of CO 2 , in 2007 dollars and 2010<br />
emissions. Table I.C.2–3 presents<br />
benefits based on the $21 value. Section<br />
III.H presents the four marginal values<br />
used to estimate monetized benefits of<br />
GHG reductions and Section III.H<br />
presents the program benefits using<br />
each of the four marginal values, which<br />
represent only a partial accounting of<br />
total benefits due to omitted climate<br />
change impacts and other factors that<br />
are not readily monetized. The values in<br />
the table are discounted values for each<br />
model year of vehicles throughout their<br />
projected lifetimes. The benefits include<br />
all benefits considered by EPA such as<br />
fuel savings, GHG reductions, PM<br />
benefits, energy security and other<br />
externalities such as reduced refueling<br />
and accidents, congestion and noise.<br />
The lifetime discounted benefits are<br />
shown for one of four different social<br />
cost of carbon (SCC) values considered<br />
by EPA. The values in Table I.C.2–3 do<br />
not include costs associated with new<br />
technology required to meet the GHG<br />
standard.<br />
TABLE I.C.2–3—EPA’S ESTIMATED 2012–2016 MODEL YEAR LIFETIME DISCOUNTED BENEFITS ASSUMING THE $21/TON<br />
SCC VALUE abc<br />
[Billions of 2007 dollars]<br />
Discount rate<br />
Model year<br />
2012 2013 2014 2015 2016 Total<br />
3% ............................................................ $21.8 $32.0 $42.8 $60.8 $83.3 $240<br />
7% ............................................................ 17.4 25.7 34.2 48.6 66.4 192<br />
a<br />
The benefits include all benefits considered by EPA such as the economic value of reduced fuel consumption and accompanying savings in<br />
refueling time, climate-related economic benefits from reducing emissions of CO 2 (but not other GHGs), economic benefits from reducing emissions<br />
of PM and other air pollutants that contribute to its formation, and reductions in energy security externalities caused by U.S. petroleum consumption<br />
and imports. The analysis also includes disbenefits stemming from additional vehicle use, such as the economic damages caused by<br />
accidents, congestion and noise.<br />
b<br />
Note that net present value of reduced GHG emissions is calculated differently than other benefits. The same discount rate used to discount<br />
the value of damages from future emissions (SCC at 5, 3, and 2.5 percent) is used to calculate net present value of SCC for internal consistency.<br />
Refer to Section III.H for more detail.<br />
c<br />
Monetized GHG benefits exclude the value of reductions in non-CO 2 GHG emissions (HFC, CH 4 and N 2O) expected under this final rule. Although<br />
EPA has not monetized the benefits of reductions in these non-CO 2 emissions, the value of these reductions should not be interpreted as<br />
zero. Rather, the reductions in non-CO 2 GHGs will contribute to this rule’s climate benefits, as explained in Section III.F.2. The SCC TSD notes<br />
the difference between the social cost of non-CO 2 emissions and CO 2 emissions, and specifies a goal to develop methods to value non-CO 2<br />
emissions in future analyses. Also, as noted in Section III.H, SCC increases over time. The $21/ton value applies to 2010 emissions and grows<br />
larger over time.<br />
Table I.C.2–4 shows EPA’s estimated<br />
lifetime fuel savings, lifetime CO 2<br />
emission reductions, and the monetized<br />
net present values of those fuel savings<br />
and CO 2 emission reductions. The<br />
gallons of fuel and CO 2 emission<br />
reductions are projected lifetime values<br />
for all vehicles sold in the model years<br />
2012–2016. The estimated fuel savings<br />
in billions of barrels and the GHG<br />
reductions in million metric tons of CO 2<br />
shown in Table I.C.2–4 are totals for the<br />
five model years throughout their<br />
projected lifetime and are not<br />
discounted. The monetized values<br />
shown in Table I.C.2–4 are the summed<br />
values of the discounted monetized-fuel<br />
savings and monetized-CO 2 reductions<br />
for the five model years 2012–2016<br />
throughout their lifetimes. The<br />
monetized values in Table I.C.2–4<br />
reflect both a 3 percent and a 7 percent<br />
discount rate as noted.<br />
mstockstill on DSKB9S0YB1PROD with RULES2<br />
TABLE I.C.2–4—EPA’S ESTIMATED 2012–2016 MODEL YEAR LIFETIME FUEL SAVINGS, CO 2 EMISSION REDUCTIONS, AND<br />
DISCOUNTED MONETIZED BENEFITS AT A 3% DISCOUNT RATE<br />
[Monetized values in 2007 dollars]<br />
Amount<br />
$ value<br />
(billions)<br />
Fuel savings ...................................................................................................... 1.8 billion barrels ................................. $182, 3% discount rate.<br />
$142, 7% discount rate.<br />
VerDate Mar2010 20:30 May 06, 2010 Jkt 220001 PO 00000 Frm 00025 Fmt 4701 Sfmt 4700 E:\FR\FM\07MYR2.SGM 07MYR2