Gr 10 Data Handling 3 - Maths Excellence
Gr 10 Data Handling 3 - Maths Excellence
Gr 10 Data Handling 3 - Maths Excellence

Create successful ePaper yourself
Turn your PDF publications into a flip-book with our unique Google optimized e-Paper software.
TIPS FOR TEACHERS<br />
Lesson 28<br />
●<br />
●<br />
Ensure that learners know the difference between bar graphs and histograms.<br />
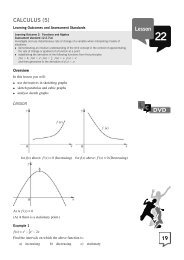
The points represented on a broken line graph should not be joined by means<br />
of a continuous solid line. This is because data values between these values<br />
are not known. The points should be joined by a dotted line.<br />
Reference<br />
“Mathematics textbook and workbook grade <strong>10</strong>”<br />
Allcopy publishers<br />
M.D.Phillips<br />
Lesson 29<br />
●<br />
Ensure that learners know that the median will be a number in the data if<br />
the number of data values is odd. If the number of data values is even, the<br />
median will be an insertion into the data set. In this case, the median will be<br />
the average between the two middle values.<br />
Reference<br />
“Mathematics textbook and workbook grade <strong>10</strong>”<br />
Allcopy publishers<br />
M.D.Phillips<br />
Lesson 30<br />
●<br />
●<br />
Ensure that learners know that the median will be a number in the data if<br />
the number of data values is odd. If the number of data values is even, the<br />
median will be an insertion into the data set. In this case, the median will be<br />
the average between the two middle values.<br />
The median is excluded from the lower and upper halves when determining<br />
the lower and upper quartiles.<br />
Reference<br />
“Mathematics textbook and workbook grade <strong>10</strong>”<br />
Allcopy publishers<br />
M.D.Phillips<br />
27<br />
<strong>10</strong> LC G<strong>10</strong> MATHS LWB.indb 27 2008/09/09 12:22:53 PM