Summary of the EPD
Summary of the EPD
Summary of the EPD

You also want an ePaper? Increase the reach of your titles
YUMPU automatically turns print PDFs into web optimized ePapers that Google loves.
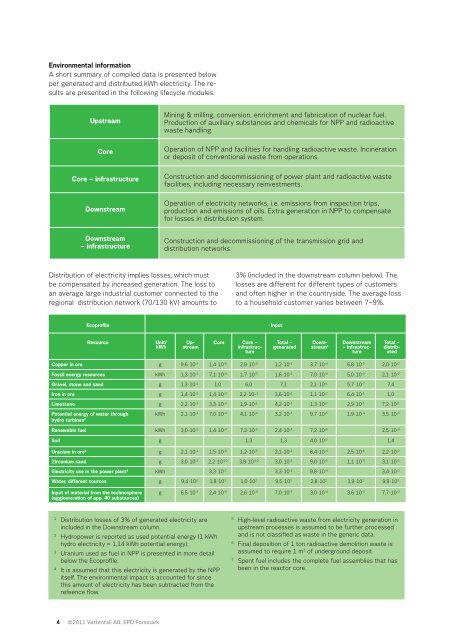
Environmental information<br />
A short summary <strong>of</strong> compiled data is presented below<br />
per generated and distributed kWh electricity. The results<br />
are presented in <strong>the</strong> following lifecycle modules.<br />
Upstream<br />
Core<br />
Core – infrastructure<br />
Mining & milling, conversion, enrichment and fabrication <strong>of</strong> nuclear fuel.<br />
Production <strong>of</strong> auxiliary substances and chemicals for NPP and radioactive<br />
waste handling.<br />
Operation <strong>of</strong> NPP and facilities for handling radioactive waste. Incineration<br />
or deposit <strong>of</strong> conventional waste from operations.<br />
Construction and decommissioning <strong>of</strong> power plant and radioactive waste<br />
facilities, including necessary reinvestments.<br />
Downstream<br />
Operation <strong>of</strong> electricity networks, i.e. emissions from inspection trips,<br />
production and emissions <strong>of</strong> oils. Extra generation in NPP to compensate<br />
for losses in distribution system.<br />
Downstream<br />
– infrastructure<br />
Construction and decommissioning <strong>of</strong> <strong>the</strong> transmission grid and<br />
distribution networks.<br />
Distribution <strong>of</strong> electricity implies losses, which must<br />
be compensated by increased generation. The loss to<br />
an average large industrial customer connected to <strong>the</strong><br />
regional distribution network (70/130 kV) amounts to<br />
3% (included in <strong>the</strong> downstream column below). The<br />
losses are different for different types <strong>of</strong> customers<br />
and <strong>of</strong>ten higher in <strong>the</strong> countryside. The average loss<br />
to a household customer varies between 7–9%.<br />
Ecopr<strong>of</strong>ile<br />
Input<br />
Resource<br />
Unit/<br />
kWh<br />
Upstream<br />
Total –<br />
generated<br />
Core Core –<br />
infrastructure<br />
Downstream<br />
1<br />
Downstream<br />
– infrastructure<br />
Total –<br />
distributed<br />
Copper in ore g 9,6∙10 -3 1,4∙10 -5 2,9∙10 -3 1,2∙10 -2 3,7∙10 -4 6,8∙10 -3 2,0∙10 -2<br />
Fossil energy resources kWh 1,3∙10 -2 7,1∙10 -4 1,7∙10 -3 1,6∙10 -2 7,0∙10 -4 5,0∙10 -3 2,1∙10 -2<br />
Gravel, stone and sand g 1,3∙10 -1 1,0 6,0 7,1 2,1∙10 -1 5,7∙10 -7 7,4<br />
Iron in ore g 1,4∙10 -1 1,4∙10 -3 2,2∙10- 1 3,6∙10 -1 1,1∙10 -2 6,4∙10 -1 1,0<br />
Limestone g 2,2∙10 -1 3,3∙10 -3 1,9∙10 -1 4,2∙10 -1 1,3∙10 -2 2,9∙10 -1 7,2∙10 -1<br />
Potential energy <strong>of</strong> water through<br />
kWh 2,1∙10 -3 7,0∙10 -4 4,1∙10 -4 3,2∙10 -3 9,7∙10 -5 1,9∙10 -4 3,5∙10 -3<br />
hydro turbines 2<br />
Renewable fuel kWh 3,0∙10 -5 1,4∙10 -4 7,3∙10 -5 2,4∙10 -4 7,2∙10 -6 2,5∙10 -4<br />
Soil g 1,3 1,3 4,0∙10 -2 1,4<br />
Uranium in ore 3 g 2,1∙10 -2 1,5∙10 -5 1,2∙10 -5 2,1∙10 -2 6,4∙10 -4 2,5∙10 -6 2,2∙10 -2<br />
Zirconium sand g 3,0∙10 -3 2,2∙10 -10 3,9∙10 -10 3,0∙10 -3 9,0∙10 -5 1,1∙10 -9 3,1∙10 -3<br />
Electricity use in <strong>the</strong> power plant 4 kWh 3,3∙10 -2 3,3∙10 -2 9,8∙10 -4 3,4∙10 -2<br />
Water, different sources g 9,4∙10 3 1,8∙10 1 1,0∙10 1 9,5∙10 3 2,8∙10 2 1,9∙10 1 9,8∙10 3<br />
Input <strong>of</strong> material from <strong>the</strong> technosphere<br />
(agglomeration <strong>of</strong> app. 40 substances)<br />
g 6,5∙10 -3 2,4∙10 -4 2,6∙10 -4 7,0∙10 -3 3,0∙10 -4 3,6∙10 -4 7,7∙10 -3<br />
1<br />
Distribution losses <strong>of</strong> 3% <strong>of</strong> generated electricity are<br />
included in <strong>the</strong> Downstream column.<br />
2<br />
Hydropower is reported as used potential energy (1 kWh<br />
hydro electricity = 1,14 kWh potential energy).<br />
3<br />
Uranium used as fuel in NPP is presented in more detail<br />
below <strong>the</strong> Ecopr<strong>of</strong>ile.<br />
4<br />
It is assumed that this electricity is generated by <strong>the</strong> NPP<br />
itself. The environmental impact is accounted for since<br />
this amount <strong>of</strong> electricity has been subtracted from <strong>the</strong><br />
refeence flow.<br />
5<br />
High-level radioactive waste from electricity generation in<br />
upstream processes is assumed to be fur<strong>the</strong>r processed<br />
and is not classified as waste in <strong>the</strong> generic data.<br />
6<br />
Final deposition <strong>of</strong> 1 ton radioactive demolition waste is<br />
assumed to require 1 m 3 <strong>of</strong> underground deposit.<br />
7<br />
Spent fuel includes <strong>the</strong> complete fuel assemblies that has<br />
been in <strong>the</strong> reactor core.<br />
4 ©2011 Vattenfall AB, <strong>EPD</strong> Forsmark