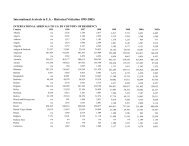
U.S. <strong>Resident</strong> <strong>Travel</strong> <strong>Abroad</strong>: 2001-2010 U.S. <strong>Resident</strong> <strong>Travel</strong> <strong>Abroad</strong> (Outbound): 2001- 2010 Sources: U.S. Department <strong>of</strong> Commerce, International Trade Administration, Manufacturing <strong>and</strong> Services, <strong>Office</strong> <strong>of</strong> <strong>Travel</strong> & <strong>Tourism</strong> <strong>Industries</strong>; Statistics Canada (Canada); <strong>and</strong> Banco de Mexico/Secretaria de Turismo (Mexico). Revised November 2011. I nternational Trade Administration • Manufac turing <strong>and</strong> Ser vices • O ffice <strong>of</strong> <strong>Travel</strong> <strong>and</strong> <strong>Tourism</strong> I ndustries
United States <strong>Resident</strong> <strong>Travel</strong> <strong>Abroad</strong>: 2010 International Visitors (Inbound) <strong>and</strong> U.S. <strong>Resident</strong>s (Outbound) International <strong>Travel</strong>ers to/from the United States 2001- 2010r International Visitors (Inbound) 2001 2002 2003 2004 2005 2006 2007 2008 2009 2010 r Total Inbound (000s) 46,927 43,581 41,218 46,086 49,206 50,977 55,979 57,937 54,958 59,938 % Change -8% -7% -5% 12% 7% 4% 10% 14% -5% 9% Overseas 1 21,833 19,117 18,026 20,322 21,679 21,668 23,892 25,341 23,756 26,363 % Change -16% -12% -6% 13% 7% 0% 10% 6% -6% 11% Canada 13,527 13,024 12,666 13,857 14,862 15,992 17,760 18,910 17,973 19,961 % Change -8% -4% -3% 9% 7% 8% 11% 6% -5% 11% Mexico 11,567 11,440 10,526 11,907 12,665 13,317 14,327 13,686 13,229 13,614 % Change 9% -1% -8% 13% 6% 5% 8% -4% -3% 3% U.S. <strong>Resident</strong>s (Outbound) 2001 2002 2003 2004 2005 2006 2007 2008 2009 2010 r Total Outbound (000s) 59,442 58,065 56,250 61,809 63,503 63,662 64,028 63,564 61,419 60,268 % Change -3% -2% -3% 6% 13% 3% 1% -1% -3% -2% Overseas 25,249 23,397 24,452 27,351 28,787 30,148 31,228 30,789 30,300 28,507 % Change -6% -7% 5% 12% 5% 5% 4% -1% -2% -6% Canada 15,570 16,167 14,232 15,088 14,391 13,855 13,375 12,504 11,667 11,749 % Change 3% 4% -12% 6% -5% -4% -3% -7% -7% 1% Mexico 18,623 18,501 17,566 19,370 20,325 19,659 19,425 20,271 19,452 20,012 % Change -3% -1% -5% 10% 5% -3% -1% 4% -4% 3% Sources: U.S. Department <strong>of</strong> Commerce, ITA, <strong>Office</strong> <strong>of</strong> <strong>Travel</strong> & <strong>Tourism</strong> <strong>Industries</strong>; Statistics Canada (Canada); <strong>and</strong> Banco de Mexico/Secretaria de Turismo (Mexico). r = revised figure for Canada <strong>and</strong> Mexico only Issued November 2011 I nternational Trade Administration • Manufac turing <strong>and</strong> Ser vices • O ffice <strong>of</strong> <strong>Travel</strong> <strong>and</strong> <strong>Tourism</strong> I ndustries