US Resident Travel Abroad - Office of Travel and Tourism Industries
US Resident Travel Abroad - Office of Travel and Tourism Industries
US Resident Travel Abroad - Office of Travel and Tourism Industries

You also want an ePaper? Increase the reach of your titles
YUMPU automatically turns print PDFs into web optimized ePapers that Google loves.
U.S. Department <strong>of</strong> Commerce<br />
International Trade Administration<br />
<strong>Office</strong> <strong>of</strong> <strong>Travel</strong> <strong>and</strong> <strong>Tourism</strong> <strong>Industries</strong><br />
2010 United States <strong>Resident</strong> <strong>Travel</strong> <strong>Abroad</strong>
U.S. <strong>Resident</strong> <strong>Travel</strong> <strong>Abroad</strong>: 2001-2010<br />
U.S. <strong>Resident</strong> <strong>Travel</strong> <strong>Abroad</strong> (Outbound): 2001- 2010<br />
Sources: U.S. Department <strong>of</strong> Commerce, International Trade Administration, Manufacturing <strong>and</strong> Services, <strong>Office</strong> <strong>of</strong> <strong>Travel</strong> & <strong>Tourism</strong> <strong>Industries</strong>;<br />
Statistics Canada (Canada); <strong>and</strong> Banco de Mexico/Secretaria de Turismo (Mexico).<br />
Revised November 2011.<br />
I nternational Trade Administration • Manufac turing <strong>and</strong> Ser vices • O ffice <strong>of</strong> <strong>Travel</strong> <strong>and</strong> <strong>Tourism</strong> I ndustries
United States <strong>Resident</strong> <strong>Travel</strong> <strong>Abroad</strong>: 2010<br />
International Visitors (Inbound) <strong>and</strong> U.S. <strong>Resident</strong>s (Outbound)<br />
International <strong>Travel</strong>ers to/from the United States<br />
2001- 2010r<br />
International Visitors<br />
(Inbound)<br />
2001 2002 2003 2004 2005 2006 2007 2008 2009 2010 r<br />
Total Inbound (000s) 46,927 43,581 41,218 46,086 49,206 50,977 55,979 57,937 54,958 59,938<br />
% Change -8% -7% -5% 12% 7% 4% 10% 14% -5% 9%<br />
Overseas 1 21,833 19,117 18,026 20,322 21,679 21,668 23,892 25,341 23,756 26,363<br />
% Change -16% -12% -6% 13% 7% 0% 10% 6% -6% 11%<br />
Canada 13,527 13,024 12,666 13,857 14,862 15,992 17,760 18,910 17,973 19,961<br />
% Change -8% -4% -3% 9% 7% 8% 11% 6% -5% 11%<br />
Mexico 11,567 11,440 10,526 11,907 12,665 13,317 14,327 13,686 13,229 13,614<br />
% Change 9% -1% -8% 13% 6% 5% 8% -4% -3% 3%<br />
U.S. <strong>Resident</strong>s<br />
(Outbound)<br />
2001 2002 2003 2004 2005 2006 2007 2008 2009 2010 r<br />
Total Outbound (000s) 59,442 58,065 56,250 61,809 63,503 63,662 64,028 63,564 61,419 60,268<br />
% Change -3% -2% -3% 6% 13% 3% 1% -1% -3% -2%<br />
Overseas 25,249 23,397 24,452 27,351 28,787 30,148 31,228 30,789 30,300 28,507<br />
% Change -6% -7% 5% 12% 5% 5% 4% -1% -2% -6%<br />
Canada 15,570 16,167 14,232 15,088 14,391 13,855 13,375 12,504 11,667 11,749<br />
% Change 3% 4% -12% 6% -5% -4% -3% -7% -7% 1%<br />
Mexico 18,623 18,501 17,566 19,370 20,325 19,659 19,425 20,271 19,452 20,012<br />
% Change -3% -1% -5% 10% 5% -3% -1% 4% -4% 3%<br />
Sources: U.S. Department <strong>of</strong> Commerce, ITA, <strong>Office</strong> <strong>of</strong> <strong>Travel</strong> & <strong>Tourism</strong> <strong>Industries</strong>; Statistics Canada (Canada);<br />
<strong>and</strong> Banco de Mexico/Secretaria de Turismo (Mexico).<br />
r = revised figure for Canada <strong>and</strong> Mexico only<br />
Issued November 2011<br />
I nternational Trade Administration • Manufac turing <strong>and</strong> Ser vices • O ffice <strong>of</strong> <strong>Travel</strong> <strong>and</strong> <strong>Tourism</strong> I ndustries
United States <strong>Resident</strong> <strong>Travel</strong> <strong>Abroad</strong>: 2010<br />
2010<br />
Rank<br />
Top Destinations <strong>of</strong> U.S. <strong>Resident</strong>s <strong>Travel</strong>ing <strong>Abroad</strong> (Outbound) 1<br />
2009 vs 2010<br />
Country 2 2009<br />
2010<br />
(000)<br />
(000)<br />
1 Mexico 19,452 20,012 3%<br />
% Change<br />
(2010/2009)<br />
Mexico (Air) 5,264 5,380 2%<br />
2 Canada 11,667 11,749 1%<br />
Canada (Air) 3,280 3,465 6%<br />
3 U.K. 2,727 2,366 -13%<br />
4 Dominican Republic 1,454 1,796 23%<br />
5 France 1,909 1,739 -9%<br />
5 Italy 1,848 1,739 -6%<br />
5 Germany 1,545 1,739 13%<br />
8 Jamaica 1,424 1,482 4%<br />
9 People's Republic <strong>of</strong> China 1,182 1,254 6%<br />
10 Japan 1,515 1,197 -21%<br />
11 Spain 1,151 969 -16%<br />
12 India 1,061 770 -27%<br />
13 Hong Kong 788 713 -10%<br />
14 Netherl<strong>and</strong>s 727 684 -6%<br />
14 Israel 667 684 3%<br />
16 Irel<strong>and</strong> 576 627 9%<br />
17 Republic <strong>of</strong> Korea 667 599 -10%<br />
18 Aruba 424 542 28%<br />
19 Brazil 667 513 -23%<br />
19 Republic <strong>of</strong> China (Taiwan) 576 513 -11%<br />
19 Colombia 545 513 -6%<br />
23 Australia 636 485 -24%<br />
24 Peru ** 428 na<br />
24 Austria 394 428 9%<br />
...Continued<br />
I nternational Trade Administration • Manufac turing <strong>and</strong> Ser vices • O ffice <strong>of</strong> <strong>Travel</strong> <strong>and</strong> <strong>Tourism</strong> I ndustries
United States <strong>Resident</strong> <strong>Travel</strong> <strong>Abroad</strong>: 2010<br />
...Continued<br />
2010<br />
Rank<br />
Top Destinations <strong>of</strong> U.S. <strong>Resident</strong>s <strong>Travel</strong>ing <strong>Abroad</strong> (Outbound) 1<br />
2009 vs 2010<br />
Country 2 2009<br />
2010<br />
(000)<br />
(000)<br />
26 Argentina ** 371 na<br />
% Change<br />
(2010/2009)<br />
26 Greece 606 371 -39%<br />
26 Philippines 394 371 -6%<br />
29 Thail<strong>and</strong> 364 342 -6%<br />
30 Turkey 394 314 -20%<br />
31 South Africa 273 285 5%<br />
32 Russia 273 257 -6%<br />
32 Egypt 273 257 -6%<br />
34 Singapore 242 200 -18%<br />
35 New Zeal<strong>and</strong> 333 171 -49%<br />
35 Pol<strong>and</strong> 242 171 -29%<br />
37 Jordan ** 143 na<br />
Czech. Republic 333 ** na<br />
Cayman Isl<strong>and</strong>s 303 ** na<br />
Vietnam 182 ** na<br />
Indonesia 121 ** na<br />
Malaysia 121 ** na<br />
Morocco 121 ** na<br />
Subtotal to Overseas 3 30,300 28,507 -6%<br />
Total U.S. <strong>Resident</strong> <strong>Travel</strong>ers 61,419 60,268 -2%<br />
(1) Ranked by 2010 visitation volume.<br />
(2) Visitation estimates are provided only for countries that have at least 400 respondents.<br />
(3) The I-92/APIS control total for overseas includes all countries except Canada <strong>and</strong> Mexico.<br />
** Estimate not shown due to sample size fewer than 400, based upon the OTTI statistical policy<br />
na = not available<br />
Note: This table shows only one <strong>of</strong> the 32 travel characteristics data reported on U.S. resident outbound travelers.<br />
Additional information may be obtained for a fee.<br />
To discover more, please visit our website: .<br />
Source: U.S. Department <strong>of</strong> Commerce, ITA, <strong>Office</strong> <strong>of</strong> <strong>Travel</strong> <strong>and</strong> <strong>Tourism</strong> <strong>Industries</strong>, November 2011<br />
I nternational Trade Administration • Manufac turing <strong>and</strong> Ser vices • O ffice <strong>of</strong> <strong>Travel</strong> <strong>and</strong> <strong>Tourism</strong> I ndustries
United States <strong>Resident</strong> <strong>Travel</strong> <strong>Abroad</strong>: 2010<br />
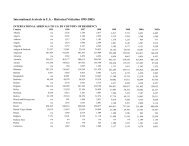
U.S. <strong>Resident</strong> <strong>Travel</strong> <strong>Abroad</strong><br />
2001 - 2010 Historical Outbound Visitation (one or more nights) 1 ...Continued<br />
Region/Country 2001 2002 2003 2004 2005 2006 2007 2008 2009 2010<br />
TOTAL OUTBOUND (2) 59,442 58,065 56,250 61,809 63,503 63,662 64,028 63,564 61,419 60,268<br />
Mexico 18,623 18,501 17,566 19,370 20,325 19,659 19,425 20,271 19,452 20,012<br />
Mexico (Air) 4,609 4,176 4,562 5,224 5,673 5,748 5,800 5,889 5,264 5,380<br />
Canada 15,570 16,167 14,232 15,088 14,391 13,855 13,375 12,504 11,667 11,749<br />
Canada (Air) 3,782 3,790 3,502 3,932 3,915 3,881 3,781 3,591 3,280 3,465<br />
OVERSEAS (3) 25,249 23,397 24,452 27,351 28,787 30,148 31,228 30,789 30,300 28,507<br />
EUROPE 11,438 10,131 10,319 11,679 11,976 12,029 12,304 11,238 10,635 9,806<br />
W. EUROPE 10,983 9,640 9,781 11,022 11,227 11,336 11,523 10,468 9,848 9,179<br />
Austria 404 304 367 410 461 ** 406 431 394 428<br />
France 2,626 2,223 1,883 2,407 2,217 2,231 2,217 2,124 1,909 1,739<br />
Germany 1,894 1,591 1,540 1,750 1,670 1,688 1,936 1,601 1,545 1,739<br />
Greece 429 328 293 438 489 482 562 493 606 371<br />
Irel<strong>and</strong> 757 562 562 738 691 844 749 677 576 627<br />
Italy 1,944 1,661 1,638 1,915 2,044 2,201 2,373 1,940 1,848 1,739<br />
Netherl<strong>and</strong>s 858 866 831 930 864 904 937 893 727 684<br />
Spain 1,010 866 929 903 979 995 1,093 1,139 1,151 969<br />
Switzerl<strong>and</strong> 707 562 611 520 518 633 656 647 485 513<br />
U.K. 3,383 3,229 3,252 3,692 3,829 3,286 3,123 2,894 2,727 2,366<br />
E. EUROPE 959 796 929 1,149 1,209 1,266 1,343 1,201 1,303 1,112<br />
Czech Republic 278 211 220 356 317 ** 375 339 333 **<br />
Pol<strong>and</strong> 278 187 220 246 259 ** ** 246 242 171<br />
Russia 227 234 269 301 345 ** 312 308 273 257<br />
CARIBBEAN 4,141 4,258 5,306 4,868 5,182 6,150 5,184 5,973 5,696 6,186<br />
Aruba 303 257 171 438 345 422 ** ** 424 542<br />
Cayman Is. na 117 147 164 na ** ** ** 303 **<br />
Dominican Rep 1,338 1,100 929 957 1,439 ** ** ** 1,454 1,796<br />
Jamaica 1,313 983 1,492 1,258 1,353 1,688 1,530 1,447 1,424 1,482<br />
S. AMERICA 2,247 1,755 1,981 2,352 2,361 2,442 2,811 3,017 2,818 2,395<br />
Argentina na na na na na ** ** ** ** 371<br />
Brazil 606 491 611 602 605 ** 687 ** 667 513<br />
Colombia 328 304 318 438 432 ** 562 677 545 513<br />
Peru na na na na na ** ** ** ** 428<br />
I nternational Trade Administration • Manufac turing <strong>and</strong> Ser vices • O ffice <strong>of</strong> <strong>Travel</strong> <strong>and</strong> <strong>Tourism</strong> I ndustries
United States <strong>Resident</strong> <strong>Travel</strong> <strong>Abroad</strong>: 2010<br />
U.S. <strong>Resident</strong> <strong>Travel</strong> <strong>Abroad</strong><br />
2001 - 2010 Historical Outbound Visitation (one or more nights) 1<br />
Region/Country 2001 2002 2003 2004 2005 2006 2007 2008 2009 2010<br />
C. AMERICA 1,414 1,521 1,663 1,778 1,756 1,538 2,248 2,001 2,060 1,910<br />
AFRICA 505 421 465 629 576 663 874 801 1,061 969<br />
Morocco 101 94 73 82 58 ** ** 62 121 **<br />
S. Africa 126 117 171 246 144 ** 219 ** 273 285<br />
MIDDLE EAST 1,010 819 685 1,039 1,094 1,115 1,312 1,724 1,909 1,824<br />
Egypt 202 na na 164 173 ** 156 277 273 257<br />
Israel 177 117 na 137 144 ** 500 616 667 684<br />
Jordan na na na na na ** ** ** ** 143<br />
Turkey 404 304 245 274 288 ** 250 369 394 314<br />
ASIA 4,318 4,492 3,937 5,087 6,074 6,271 6,714 6,404 6,333 5,616<br />
Hong Kong 732 749 489 738 921 904 968 924 788 713<br />
India 454 398 416 629 835 904 999 1,016 1,061 770<br />
Indonesia 101 94 73 82 144 ** 94 ** 121 **<br />
Japan 1,060 1,287 1,051 1,067 1,497 1,538 1,718 1,601 1,515 1,197<br />
Malaysia 126 140 98 109 115 121 125 ** 121 **<br />
China (PRC) 682 725 562 1,067 1,295 1,327 1,374 1,201 1,182 1,254<br />
Philippines 429 234 269 438 288 271 312 308 394 371<br />
Taiwan 656 632 489 629 662 693 687 647 576 513<br />
Republic <strong>of</strong> Korea 530 608 513 574 662 633 687 616 667 599<br />
Singapore 328 374 220 274 374 422 344 308 242 200<br />
Thail<strong>and</strong> 404 398 342 410 489 482 468 431 364 342<br />
Vietnam 101 117 98 109 144 181 219 216 182 **<br />
OCEANIA 1,187 819 831 821 835 874 874 801 818 599<br />
Australia 833 562 562 602 605 603 593 585 636 485<br />
New Zeal<strong>and</strong> 480 257 293 328 317 301 281 277 333 171<br />
(1) Estimates <strong>of</strong> U.S. Outbound for 2006-2010 are provided only for world regions or countries having a sample size <strong>of</strong> 400 or more.<br />
Past year estimates (2000 -2005) are reported based upon at least 100 respondents.<br />
For more information please contact the <strong>Office</strong> <strong>of</strong> <strong>Travel</strong> <strong>and</strong> <strong>Tourism</strong> <strong>Industries</strong> (OTTI).<br />
(2) Total outbound is the sum <strong>of</strong> Canada, Mexico <strong>and</strong> Overseas.<br />
(3) Overseas includes all countries except Canada <strong>and</strong> Mexico.<br />
** Estimate not shown due to sample size fewer than 400, a new OTTI statistical policy for the 2006-2009 data release.<br />
na - estimates are not available because fewer than 100 travelers were surveyed in 2000 -2005.<br />
Note: This table shows only one <strong>of</strong> the 32 travel characteristics data reported on U.S. resident outbound travelers.<br />
Additional information may be obtained for a fee. To learn more, please visit the OTTI website:<br />
http://tinet.ita.doc.gov/research/programs/ifs/index.html<br />
Source: U.S. Department <strong>of</strong> Commerce, ITA, <strong>Office</strong> <strong>of</strong> <strong>Travel</strong> <strong>and</strong> <strong>Tourism</strong> <strong>Industries</strong> (OTTI), November 2011<br />
I nternational Trade Administration • Manufac turing <strong>and</strong> Ser vices • O ffice <strong>of</strong> <strong>Travel</strong> <strong>and</strong> <strong>Tourism</strong> I ndustries
United States <strong>Resident</strong> <strong>Travel</strong> <strong>Abroad</strong>: 2010<br />
2010<br />
Rank<br />
2010 Annual U.S. Citizen Departures<br />
Table IIId - Passenger <strong>Travel</strong> Between U.S. Ports <strong>and</strong> Overseas Countries<br />
Top U.S. Airports <strong>of</strong> Departure for U.S. Citizens<br />
U.S. Airport<br />
2010<br />
2010<br />
to Overseas 1 Market Share<br />
1<br />
Overseas excludes Canada <strong>and</strong> Mexico.<br />
* Figures exclude U.S. citizens’ departures to Canada or Mexico.<br />
Only the top 30 ports based upon total departures listed in the: ‘U.S. International Air <strong>Travel</strong> Statistics Report”<br />
Source: U.S. Department <strong>of</strong> Commerce, ITA, <strong>Office</strong> <strong>of</strong> <strong>Travel</strong> <strong>and</strong> <strong>Tourism</strong> <strong>Industries</strong>, November 2011<br />
2010<br />
Cumulative Share<br />
1 New York (JFK) 5,209,354 18.3% 18.3%<br />
2 Miami (MIA) 3,316,453 11.6% 29.9%<br />
3 Los Angeles (LAX) 2,434,397 8.5% 38.4%<br />
4 Atlanta (ATL) 2,224,051 7.8% 46.2%<br />
5 Newark (EWR) 2,208,469 7.7% 54.0%<br />
6 Chicago (ORD) 1,813,038 6.4% 60.4%<br />
7 San Francisco (SFO) 1,534,990 5.4% 65.7%<br />
8 Houston (IAH) 1,336,950 4.7% 70.4%<br />
9 Washington (IAD) 1,303,605 4.6% 75.0%<br />
10 Philadelphia (PHL) 904,437 3.2% 78.2%<br />
11 Boston (BOS) 831,771 2.9% 81.1%<br />
12 Charlotte (CLT) 771,275 2.7% 83.8%<br />
13 Dallas (DFW) 746,694 2.6% 86.4%<br />
14 Ft. Lauderdale (FLL) 531,686 1.9% 88.3%<br />
15 Seattle (SEA) 426,778 1.5% 89.8%<br />
16 San Juan PR (SJU) 405,822 1.4% 91.2%<br />
17 Honolulu (HNL) 386,596 1.4% 92.6%<br />
18 Detroit (DTW) 385,697 1.4% 93.9%<br />
19 Agana (GUM) 345,061 1.2% 95.1%<br />
20 Minneapolis (MSP) 304,979 1.1% 96.2%<br />
21 Orl<strong>and</strong>o (MCO) 246,852 0.9% 97.1%<br />
22 Denver (DEN) 179,189 0.6% 97.7%<br />
23 Baltimore (BWI) 71,344 0.3% 97.9%<br />
24 Portl<strong>and</strong> (PDX) 63,290 0.2% 98.2%<br />
25 Anchorage (ANC) 62,957 0.2% 98.4%<br />
26 Phoenix (PHX) 47,067 0.2% 98.5%<br />
27 Salt Lake City (SLC) 45,180 0.2% 98.7%<br />
28 Cincinnati (CVG) 42,072 0.1% 98.9%<br />
29 Las Vegas (LAS) 41,582 0.1% 99.0%<br />
30 Sanford Orl<strong>and</strong>o (SFB) 21,873 0.1% 99.1%<br />
Sub Total 28,243,509 99.1%<br />
TOTAL U.S. Outbound 28,507,000 100.0%<br />
I nternational Trade Administration • Manufac turing <strong>and</strong> Ser vices • O ffice <strong>of</strong> <strong>Travel</strong> <strong>and</strong> <strong>Tourism</strong> I ndustries
http://www.xbodies.com<br />
http://www.bidlesstravel.com<br />
Interested in obtaining data for your organization?<br />
OTTI collects, analyzes <strong>and</strong> disseminates international travel <strong>and</strong> tourism statistics from<br />
the U.S. <strong>Travel</strong> <strong>and</strong> <strong>Tourism</strong> Statistical System <strong>and</strong> produces visitation data tables, including<br />
a business <strong>and</strong> pleasure arrivals rate <strong>of</strong> change analysis <strong>and</strong> detailed region, country<br />
<strong>and</strong> port analyses.<br />
To learn more, you are encouraged to visit:<br />
http://tinet.ita.doc.gov/research/programs/ifs/customized.html<br />
For OTTI programs <strong>of</strong> interest visit:<br />
http://www.tinet.ita.doc.gov/research/index.html<br />
• Summary <strong>of</strong> International <strong>Travel</strong> to the United States (I-94)<br />
• U.S. International Air <strong>Travel</strong>er Statistics (I-92)<br />
• Canadian Statistics<br />
• Survey <strong>of</strong> International Air <strong>Travel</strong>ers (SIAT )<br />
• Forecast <strong>of</strong> International Arrivals to the United States<br />
• U.S. <strong>Travel</strong> <strong>and</strong> <strong>Tourism</strong> Exports, Imports <strong>and</strong> the Balance <strong>of</strong> Trade<br />
• U.S. <strong>Travel</strong> <strong>and</strong> <strong>Tourism</strong> Satellite Accounts<br />
• <strong>Travel</strong> Trade Barometer<br />
U.S. Department <strong>of</strong> Commerce<br />
International Trade Administration<br />
Manufacturing <strong>and</strong> Services<br />
<strong>Office</strong> <strong>of</strong> <strong>Travel</strong> <strong>and</strong> <strong>Tourism</strong> <strong>Industries</strong><br />
1401 Constitution Ave, NW<br />
Washington, D.C. 20230<br />
Phone: (202) 482-0140<br />
Fax: (202) 482-2887<br />
otti@trade.gov<br />
http://tinet.ita.doc.gov<br />
I nternational Trade Administration • Manufac turing <strong>and</strong> Ser vices • O ffice <strong>of</strong> <strong>Travel</strong> <strong>and</strong> <strong>Tourism</strong> I ndustries