Leisure - International Trade Administration - Department of ...
Leisure - International Trade Administration - Department of ...
Leisure - International Trade Administration - Department of ...

You also want an ePaper? Increase the reach of your titles
YUMPU automatically turns print PDFs into web optimized ePapers that Google loves.
2012 IndustrySector Pr<strong>of</strong>ile:<strong>Leisure</strong>Information Sources Used to Plan Trip by <strong>Leisure</strong> VisitorsInformation Sources UsedMain Purpose <strong>of</strong> Trip2011(Percent)2012(Percent)PointChange (2)Airlines (Directly) 22 43 21.0Corporate Travel Dept. 2 7 4.6Travel Guide(s) 11 17 5.42012 Personal Recommendation (Friends/Rel) 282011 Friends/Relatives 182012 National/State/City Travel Office 112011 Nat'l Govt. Tourist Ofc. 22011 State/City Travel Ofc. 42012 Tour Operator/Travel Club 102011 Tour Company 92012 Online Travel Agency (OTA) 342012 Travel Agency Office 272011 Travel Agency 382012 Other 52011 TV/Radio 12011 Personal Computer 502011 In-flight Info. Systems 22011 Newspapers/Magazines 42011 2012 PointMain Purpose <strong>of</strong> Trip(Percent) (Percent) Change (2)Convention/Conference/<strong>Trade</strong> Show 2 2 0.2Visit Friends/Relatives 12 9 -3.6Health Treatment 0.1 0.1 0.0Religion/Pilgrimages 0.1 0.1 0.02012 Business 22011 Business/Pr<strong>of</strong>essional 42012 Vacation/Holiday 852011 <strong>Leisure</strong>/Rec./Holidays/Sightseeing 792012 Education 22011 Study/Teaching 2Other 0.3 0.4 0.1I nternational <strong>Trade</strong> <strong>Administration</strong> • Manufac turing and Ser vices • O ffice <strong>of</strong> Travel and Tourism I ndustries
2012 IndustrySector Pr<strong>of</strong>ile:<strong>Leisure</strong>All Purposes <strong>of</strong> TripPurpose <strong>of</strong> Trip2011(Percent)2012(Percent)PointChange (2)Convention/Conference/<strong>Trade</strong> Show 4 4 0.0Visit Friends/Relatives 27 24 -2.3Health Treatment 0.3 0.4 0.1Religion/Pilgrimages 0.3 0.4 0.12012 Business 42011 Business/Pr<strong>of</strong>essional 72012 Vacation/Holiday 1002011 <strong>Leisure</strong>/Rec./Holidays/Sightseeing 1002012 Education 42011 Study/Teaching 3Other 1 1 0.1NET PURPOSES OF TRIP:<strong>Leisure</strong> & VFR 100 100 0.0Business & Convention 10 7 -2.9Transportation Used in United States by <strong>Leisure</strong> VisitorsTransportation Types Used in United States2011(Percent)2012(Percent)PointChange (2)Airlines in U.S. 26 31 5.3Bus between Cities 13 20 7.8City Subway/Tram/Bus 32 36 4.3Company or Private Auto 20 28 7.7Railroad between Cities 12 7 -4.8Motor Home/Camper 1 1 0.0Rented Auto 32 37 4.3Taxi/Cab/Limousine 42 35 -7.02012 Cruise Ship/River Boat 1+ Nights 52012 Ferry/River Taxi/Short Scenic Cruise 132012 Rented Bicycle/Motorcycle/Moped 3I nternational <strong>Trade</strong> <strong>Administration</strong> • Manufac turing and Ser vices • O ffice <strong>of</strong> Travel and Tourism I ndustries
2012 IndustrySector Pr<strong>of</strong>ile:<strong>Leisure</strong>Activity Participation While in the United StatesActivity Participation While in the U.S.2011(Percent)2012(Percent)PointChange (2)Amusement/Theme Parks 36 32 -3.8Art Gallery/Museum 27 31 4.6Sporting Event 7 12 4.7Camping/Hiking 5 5 -0.1Casino/Gambling 12 11 -1.6Concert/Play/Musical 19 21 1.4Environ./Eco. Excursions 4 4 -0.2Golfing/Tennis 4 5 0.1Guided Tours 23 29 6.3Hunting/Fishing 2 2 0.1Nightclubs/Dancing 13 16 2.7Shopping 92 91 -0.7Visit American Indian Communities 4 6 1.42012 Cultural / Ethnic Heritage Sites 182011 Cultural Heritage Sites 292011 Ethnic Heritage Sites 52012 Experience Fine Dining 392011 Dining in Restaurants 852012 Sightseeing 842011 Sightseeing in Cities 522012 Snow Sports 12011 Snow Skiing 22012 Small Towns/Countryside 292011 Visit Small Towns/Villages 312011 Touring Countryside 222012 National Parks/Monuments 382011 Visit National Parks 242012 Water Sports 132011 Water Sports/Sunbathing 262012 Visit Historical Locations 302011 Visit Historical Places 482012 Other 12011 Cruises 102011 Ranch Vacations 2I nternational <strong>Trade</strong> <strong>Administration</strong> • Manufac turing and Ser vices • O ffice <strong>of</strong> Travel and Tourism I ndustries
2012 IndustrySector Pr<strong>of</strong>ile:<strong>Leisure</strong>Select Traveler Characteristics <strong>of</strong> <strong>Leisure</strong> VisitorsTraveler Characteristics 2011 2012 Change (2)Advance Trip Decision Time (mean days) 109 108 -1.2Advance Trip Decision Time (median days) 90 90 0.0Prepaid Package 22 24 2.3First <strong>International</strong> Trip to the U.S. 33 26 -6.2Length <strong>of</strong> Stay in U.S. (mean nights) 14.7 14.5 -0.2Length <strong>of</strong> Stay in U.S. (median nights) 10 9 -1.0Number <strong>of</strong> States Visited (% 1 state) 65 69 3.5Average Number <strong>of</strong> States Visited 1.6 1.5 -0.1Hotel/Motel (% 1+ nights) 84 83 -1.5Average # <strong>of</strong> Nights in Hotel/Motel 8.5 8.9 0.4Travel Party Size (mean # <strong>of</strong> persons) 1.8 1.9 0.1Gender: % Male (among adults) 52 49 -3.1Household Income (mean average) $91,500 $97,773 $6,273Household Income (median average) $79,300 $72,000 -$7,300Average Age: Female 38 38 -0.3Average Age: Male 42 41 -1.4I nternational <strong>Trade</strong> <strong>Administration</strong> • Manufac turing and Ser vices • O ffice <strong>of</strong> Travel and Tourism I ndustries
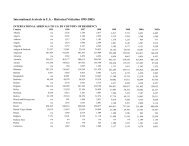
2012 IndustrySector Pr<strong>of</strong>ile:<strong>Leisure</strong>U.S. Destinations Visited by Overseas <strong>Leisure</strong> VisitorsVisitation to U.S. Destinations/Regions (3)REGIONSMarketShare2011(Percent)Volume2011(000)MarketShare2012(Percent)Volume2012(000)Middle Atlantic 39.5 7,445 36.0 7,189South Atlantic 31.7 5,975 33.7 6,730Pacific 22.9 4,316 19.9 3,974Pacific Islands 17.1 3,223 18.8 3,754Mountain 15.8 2,978 13.9 2,776East North Central 4.6 867 5.0 999New England 5.6 1,056 5.0 999West South Central 4.0 754 4.0 799STATESNew York 37.6 7,087 34.3 6,850Florida 23.8 4,486 26.7 5,332California 21.5 4,053 18.8 3,754Hawaiian Islands 10.9 2,055 12.5 2,496Nevada 13.0 2,450 11.6 2,317Guam 6.2 1,169 6.3 1,258Massachusetts 4.7 886 4.3 859Illinois 3.3 622 3.6 719Arizona 3.7 697 3.2 639Texas 2.6 490 2.9 579Pennsylvania 2.6 490 2.7 539New Jersey 2.8 528 2.4 479...cont’d.I nternational <strong>Trade</strong> <strong>Administration</strong> • Manufac turing and Ser vices • O ffice <strong>of</strong> Travel and Tourism I ndustries
2012 IndustrySector Pr<strong>of</strong>ile:<strong>Leisure</strong>U.S. Destinations Visited by Overseas <strong>Leisure</strong> VisitorsVisitation to U.S. Destinations/Regions (3)CITIESMarketShare2011(Percent)Volume2011(000)MarketShare2012(Percent)Volume2012(000)New York City 37.1 6,993 33.8 6,750Orlando 13.1 2,469 14.6 2,916Miami 12.1 2,281 13.6 2,716Los Angeles 14.2 2,677 11.9 2,376Las Vegas 12.7 2,394 11.3 2,257San Francisco 11.3 2,130 10.3 2,057Oahu/Honolulu 8.7 1,640 10.1 2,017Washington, DC 6.8 1,282 5.8 1,158Boston 4.4 829 4.0 799Chicago 3.2 603 3.5 699San Diego 2.7 509 2.7 539Flagstaff-Grand Canyon-Sedona 2.9 547 2.5 499Philadelphia 1.7 320 1.7 339(1) Overseas includes all countries except Canada and Mexico.(2) Percentage-point and percentage changes are based on non-rounded data.(3) “Only census region, state, and city destinations having a sample size <strong>of</strong> 400 or more are displayed.Due to quarterly data weighting by country and port <strong>of</strong> entry, some unreported destinations may have a higher proportion <strong>of</strong> total than thosereported.”(**) Estimate not shown due to sample size fewer than 400 for this year.Note: Estimate not shown due to sample size fewer than 400 for this year. This pr<strong>of</strong>ile shows only a portion <strong>of</strong> the 35 travel characteristicsdata in 2011 and the 37 items reported on international arrivals to the U.S. Additional information may be obtained for a fee.To learn more, please visit our website: http://tinet.ita.doc.gov/research/programs/ifs/index.htmlFor a list <strong>of</strong> the states that comprise each census region, please visit: http://tinet.ita.goc.gov/outreachpages/census_regions.htmlInterested in data for your destination? OTTI sells custom reports. To learn more, go to:http://www.tinet.ita.doc.gov/research/programs/ifs/customized.htmlSource: U.S. <strong>Department</strong> <strong>of</strong> Commerce, ITA, Office <strong>of</strong> Travel and Tourism Industries; Bureau <strong>of</strong> Economic AnalysisPublication Date: August 2013
2012 IndustrySector Pr<strong>of</strong>ile:<strong>Leisure</strong>Survey <strong>of</strong> <strong>International</strong> Air TravelersThe Survey <strong>of</strong> <strong>International</strong> Air Travelers provides a level <strong>of</strong> detail and insight into the traveler characteristicsand travel patterns <strong>of</strong> international visitors to and from the United States not found elsewhere.Responses are weighted with data from the <strong>Department</strong> <strong>of</strong> Homeland Security and the following thirtyfivetables are then populated. This report, which was constructed using just a fraction <strong>of</strong> the data available,summarizes what we know about the overseas leisure traveler who visits the United States.Survey <strong>of</strong> <strong>International</strong> Air Travelers: Table Number and DescriptionTable 1 Country <strong>of</strong> Residence Table 19 Number <strong>of</strong> States VisitedTable 2 Advance Trip Decision Table 20 Number <strong>of</strong> Destinations ListedTable 3 Advance Airline Reservation Table 21 Transportation in U.S.Table 4 Means <strong>of</strong> Booking Air Trip Table 22 Port <strong>of</strong> EntryTable 5 Information Sources Table 23 Main DestinationTable 6 Use <strong>of</strong> Package Table 24 U.S. Destinations VisitedTable 7 Use <strong>of</strong> Prepaid <strong>Leisure</strong> Table 25 <strong>Leisure</strong> ActivitiesTable 8 Advance Package Booking Table 26 Total Trip ExpendituresTable 9 Pre-Booked <strong>Leisure</strong> Table 27 Itemized Trip ExpendituresTable 10 Travel Companions Table 28 Trip Expenses Payment MethodTable 11 Travel Party Size Table 29 Factors in Airline ChoiceTable 12 Main Purpose <strong>of</strong> Trip Table 30 Main Factor in Airline ChoiceTable 13 Purpose <strong>of</strong> Trip Table 31 Type <strong>of</strong> Airline TicketTable 14 Type <strong>of</strong> Accommodation Table 32 Seating AreaTable 15 Nights in the U.S. Table 33 Gender & Age <strong>of</strong> TravelerTable 16 First Int’l U.S. Trip Table 34 OccupationTable 17 U.S. Trips Last 12 Months Table 35 Annual Household IncomeTable 18 U.S. Trips Last 5 YearsI nternational <strong>Trade</strong> <strong>Administration</strong> • Manufac turing and Ser vices • O ffice <strong>of</strong> Travel and Tourism I ndustries
Interested in obtaining data for your organization?OTTI collects, analyzes and disseminates international travel and tourism statistics fromthe U.S. Travel and Tourism Statistical System and produces visitation data tables, includinga business and pleasure arrivals rate <strong>of</strong> change analysis and detailed region, countryand port analyses.To learn more, you are encouraged to visit:http://tinet.ita.doc.gov/research/programs/ifs/customized.htmlFor OTTI programs <strong>of</strong> interest visit:http://www.tinet.ita.doc.gov/research/index.html• Summary <strong>of</strong> <strong>International</strong> Travel to the United States (I-94)• U.S. <strong>International</strong> Air Traveler Statistics (I-92)• Canadian Statistics• Survey <strong>of</strong> <strong>International</strong> Air Travelers (SIAT )• Forecast <strong>of</strong> <strong>International</strong> Arrivals to the United States• U.S. Travel and Tourism Exports, Imports and the Balance <strong>of</strong> <strong>Trade</strong>• U.S. Travel and Tourism Satellite Accounts• Travel <strong>Trade</strong> BarometerU.S. <strong>Department</strong> <strong>of</strong> Commerce<strong>International</strong> <strong>Trade</strong> <strong>Administration</strong>Manufacturing and ServicesOffice <strong>of</strong> Travel and Tourism Industries1401 Constitution Ave, NWWashington, D.C. 20230Phone: (202) 482-0140Fax: (202) 482-2887otti@trade.govhttp://tinet.ita.doc.govI nternational <strong>Trade</strong> <strong>Administration</strong> • Manufac turing and Ser vices • O ffice <strong>of</strong> Travel and Tourism I ndustries