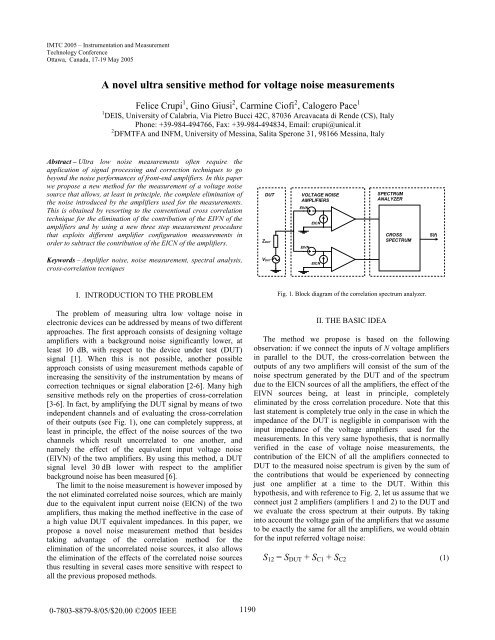
A novel ultra sensitive method for voltage noise ... - Felice Crupi
A novel ultra sensitive method for voltage noise ... - Felice Crupi
A novel ultra sensitive method for voltage noise ... - Felice Crupi

You also want an ePaper? Increase the reach of your titles
YUMPU automatically turns print PDFs into web optimized ePapers that Google loves.
IMTC 2005 – Instrumentation and Measurement<br />
Technology Conference<br />
Ottawa, Canada, 17-19 May 2005<br />
A <strong>novel</strong> <strong>ultra</strong> <strong>sensitive</strong> <strong>method</strong> <strong>for</strong> <strong>voltage</strong> <strong>noise</strong> measurements<br />
<strong>Felice</strong> <strong>Crupi</strong> 1 , Gino Giusi 2 , Carmine Ciofi 2 , Calogero Pace 1<br />
1 DEIS, University of Calabria, Via Pietro Bucci 42C, 87036 Arcavacata di Rende (CS), Italy<br />
Phone: +39-984-494766, Fax: +39-984-494834, Email: crupi@unical.it<br />
2 DFMTFA and INFM, University of Messina, Salita Sperone 31, 98166 Messina, Italy<br />
Abstract – Ultra low <strong>noise</strong> measurements often require the<br />
application of signal processing and correction techniques to go<br />
beyond the <strong>noise</strong> per<strong>for</strong>mances of front-end amplifiers. In this paper<br />
we propose a new <strong>method</strong> <strong>for</strong> the measurement of a <strong>voltage</strong> <strong>noise</strong><br />
source that allows, at least in principle, the complete elimination of<br />
the <strong>noise</strong> introduced by the amplifiers used <strong>for</strong> the measurements.<br />
This is obtained by resorting to the conventional cross correlation<br />
technique <strong>for</strong> the elimination of the contribution of the EIVN of the<br />
amplifiers and by using a new three step measurement procedure<br />
that exploits different amplifier configuration measurements in<br />
order to subtract the contribution of the EICN of the amplifiers.<br />
DUT<br />
ZDUT<br />
VOLTAGE NOISE<br />
AMPLIFIERS<br />
EIVN<br />
EIVN<br />
EICN<br />
SPECTRUM<br />
ANALYZER<br />
CROSS<br />
SPECTRUM<br />
S ( f )<br />
Keywords – Amplifier <strong>noise</strong>, <strong>noise</strong> measurement, spectral analysis,<br />
cross-correlation tecniques<br />
VDUT<br />
EICN<br />
I. INTRODUCTION TO THE PROBLEM<br />
The problem of measuring <strong>ultra</strong> low <strong>voltage</strong> <strong>noise</strong> in<br />
electronic devices can be addressed by means of two different<br />
approaches. The first approach consists of designing <strong>voltage</strong><br />
amplifiers with a background <strong>noise</strong> significantly lower, at<br />
least 10 dB, with respect to the device under test (DUT)<br />
signal [1]. When this is not possible, another possible<br />
approach consists of using measurement <strong>method</strong>s capable of<br />
increasing the sensitivity of the instrumentation by means of<br />
correction techniques or signal elaboration [2-6]. Many high<br />
<strong>sensitive</strong> <strong>method</strong>s rely on the properties of cross-correlation<br />
[3-6]. In fact, by amplifying the DUT signal by means of two<br />
independent channels and of evaluating the cross-correlation<br />
of their outputs (see Fig. 1), one can completely suppress, at<br />
least in principle, the effect of the <strong>noise</strong> sources of the two<br />
channels which result uncorrelated to one another, and<br />
namely the effect of the equivalent input <strong>voltage</strong> <strong>noise</strong><br />
(EIVN) of the two amplifiers. By using this <strong>method</strong>, a DUT<br />
signal level 30 dB lower with respect to the amplifier<br />
background <strong>noise</strong> has been measured [6].<br />
The limit to the <strong>noise</strong> measurement is however imposed by<br />
the not eliminated correlated <strong>noise</strong> sources, which are mainly<br />
due to the equivalent input current <strong>noise</strong> (EICN) of the two<br />
amplifiers, thus making the <strong>method</strong> ineffective in the case of<br />
a high value DUT equivalent impedances. In this paper, we<br />
propose a <strong>novel</strong> <strong>noise</strong> measurement <strong>method</strong> that besides<br />
taking advantage of the correlation <strong>method</strong> <strong>for</strong> the<br />
elimination of the uncorrelated <strong>noise</strong> sources, it also allows<br />
the elimination of the effects of the correlated <strong>noise</strong> sources<br />
thus resulting in several cases more <strong>sensitive</strong> with respect to<br />
all the previous proposed <strong>method</strong>s.<br />
Fig. 1. Block diagram of the correlation spectrum analyzer.<br />
II. THE BASIC IDEA<br />
The <strong>method</strong> we propose is based on the following<br />
observation: if we connect the inputs of N <strong>voltage</strong> amplifiers<br />
in parallel to the DUT, the cross-correlation between the<br />
outputs of any two amplifiers will consist of the sum of the<br />
<strong>noise</strong> spectrum generated by the DUT and of the spectrum<br />
due to the EICN sources of all the amplifiers, the effect of the<br />
EIVN sources being, at least in principle, completely<br />
eliminated by the cross correlation procedure. Note that this<br />
last statement is completely true only in the case in which the<br />
impedance of the DUT is negligible in comparison with the<br />
input impedance of the <strong>voltage</strong> amplifiers used <strong>for</strong> the<br />
measurements. In this very same hypothesis, that is normally<br />
verified in the case of <strong>voltage</strong> <strong>noise</strong> measurements, the<br />
contribution of the EICN of all the amplifiers connected to<br />
DUT to the measured <strong>noise</strong> spectrum is given by the sum of<br />
the contributions that would be experienced by connecting<br />
just one amplifier at a time to the DUT. Within this<br />
hypothesis, and with reference to Fig. 2, let us assume that we<br />
connect just 2 amplifiers (amplifiers 1 and 2) to the DUT and<br />
we evaluate the cross spectrum at their outputs. By taking<br />
into account the <strong>voltage</strong> gain of the amplifiers that we assume<br />
to be exactly the same <strong>for</strong> all the amplifiers, we would obtain<br />
<strong>for</strong> the input referred <strong>voltage</strong> <strong>noise</strong>:<br />
S 12 = S DUT + S C1 + S C2 (1)<br />
1190
where S DUT is the power spectral density (PSD) of the<br />
equivalent <strong>noise</strong> source of the DUT, and S Ci is the PSD due to<br />
the EICN of the amplifier i.<br />
DUT<br />
1<br />
2<br />
3<br />
4<br />
Spectrum<br />
Analyzer<br />
Figure 2 – Schematics of the proposed instrument <strong>for</strong> <strong>voltage</strong> <strong>noise</strong><br />
measurements. The DUT can be connected either to one of the two<br />
couples of amplifiers or to both couples. The spectrum analyzer<br />
per<strong>for</strong>ms the cross-correlation between the outputs of any two<br />
amplifiers.<br />
residual contribution of the (uncorrelated) EIVN of the<br />
amplifiers negligible with respect to the DUT <strong>noise</strong> to be<br />
measured.<br />
While the above requirements are common to almost all<br />
the high sensitivity <strong>method</strong>s mentioned above, the new<br />
<strong>method</strong> has the very important advantages of not requiring<br />
any preliminary characterization of the DUT impedance and<br />
of the EICN of the amplifiers and of not relying on the<br />
hypothesis of the EICN having a negligible effect. In fact, by<br />
using the technique we propose, it is possible to accurately<br />
estimate the <strong>voltage</strong> <strong>noise</strong> produced by the DUT even in the<br />
case in which its impedance is so high that the contribution of<br />
the EICN of the amplifiers becomes predominant.<br />
Finally we would like to note that by using the very same<br />
principle we have developed above, one can obtain similar<br />
results by using just three amplifiers instead of four, at the<br />
cost, however, of a further measurement step.<br />
III.<br />
EXPERIMENTAL VALIDATION<br />
In order to verify the validity of the proposed <strong>method</strong>, we<br />
have used the four amplifiers configuration shown in Fig. 3.<br />
Let now assume that we connect the inputs of the just two<br />
other amplifiers (amplifiers 3 and 4) in parallel to the DUT.<br />
By evaluating the cross spectrum at their outputs and by<br />
taking into account, as be<strong>for</strong>e, the <strong>voltage</strong> gain of the<br />
amplifiers, we now obtain <strong>for</strong> the input referred <strong>voltage</strong><br />
<strong>noise</strong>:<br />
R2 10k<br />
U1<br />
-<br />
R1<br />
100<br />
R7<br />
100<br />
R8 10k<br />
-<br />
U4<br />
S 34 = S DUT + S C3 + S C4 (2)<br />
Finally, let us assume that we connect all the amplifiers<br />
together to the DUT. In this last case, proceeding as be<strong>for</strong>e,<br />
we would obtain <strong>for</strong> the input referred cross spectrum<br />
evaluated among any two channels:<br />
OP27<br />
R9<br />
R6 10k 1k<br />
R4 10k<br />
U3<br />
-<br />
+<br />
+<br />
SW1<br />
R10<br />
R5<br />
R3<br />
100k<br />
100<br />
100<br />
C<br />
220nF<br />
SW4<br />
-<br />
OP27<br />
U2<br />
S 1234 = S DUT + S C1 + S C2 + S C3 + S C4 . (3)<br />
OP27<br />
+<br />
SW3<br />
D.U.T.<br />
SW2<br />
+<br />
OP27<br />
At this point it is apparent that we can evaluate the power<br />
spectrum of the <strong>voltage</strong> <strong>noise</strong> generated by the DUT alone by<br />
taking the sum:<br />
S DUT = S 12 +S 34 - S 1234 . (4)<br />
SW5 6<br />
1 3 2 4<br />
5<br />
R11<br />
1K<br />
R12<br />
-<br />
10k<br />
U5<br />
It is important to note that this measurement procedure<br />
allows to eliminate the contribution of the EICN sources of<br />
the amplifiers without requiring the measurement of the DUT<br />
impedance and the estimation of the EICN of the amplifiers.<br />
The only requirements <strong>for</strong> this procedure to provide<br />
accurate results are that:<br />
a) the impedance of the DUT has to be much smaller than<br />
the input impedance of the amplifiers used <strong>for</strong> the<br />
measurements;<br />
b) the evaluation of the cross spectrum has to be per<strong>for</strong>med<br />
using a time record long enough in order to make the<br />
R14<br />
R13<br />
1K<br />
+<br />
+<br />
-<br />
AD743<br />
10k<br />
U6<br />
AD743<br />
SPECTRUM<br />
ANALYZER<br />
Figure 3 - A simple circuit implementation of the schematics of Fig. 2.<br />
1191
If we take into consideration the case of a single amplifier<br />
being connected to the DUT, it can be easily proven that the<br />
input referred <strong>voltage</strong> <strong>noise</strong> PSD is given by:<br />
S<br />
tot<br />
R1<br />
⋅ R2<br />
2<br />
= SDUT<br />
+ 4 KT + Sen<br />
+ ZDUT<br />
Sin<br />
(5)<br />
R + R<br />
1<br />
where S en and S in are the PSD of the EIVN and of the<br />
EICN of the operational amplifier, respectively. Note that the<br />
second and third <strong>noise</strong> contributions, due to the thermal <strong>noise</strong><br />
of the resistors and to the op-amp EIVN, represent the actual<br />
EIVN contribution of the <strong>voltage</strong> amplifier while the fourth<br />
contribution is due to the overall EICN of the <strong>voltage</strong><br />
amplifier. As discussed in the previous section, the <strong>noise</strong><br />
sources due to the EIVN of the <strong>voltage</strong> amplifier are<br />
suppressed by the cross-correlation <strong>method</strong> and the ones due<br />
to the EICN can be eliminated by applying the new <strong>method</strong>.<br />
In order to have meaningful measurements, as far as the<br />
validation of the new <strong>method</strong> is concerned, it is appropriate to<br />
take into consideration a case in which we have comparable<br />
levels <strong>for</strong> the <strong>noise</strong> produced by the DUT, <strong>for</strong> the <strong>noise</strong> due to<br />
the amplifier EIVN and <strong>for</strong> the <strong>noise</strong> due to the amplifier<br />
EICN. To fall into such a situation, we have chosen an OP27<br />
low-<strong>noise</strong> amplifier, which is characterized by an EIVN of<br />
3 nV/√Hz at 100 Hz and an EICN of 0.6 pA/√Hz at 100 Hz.<br />
Moreover, we used as a DUT the parallel between the series<br />
of a resistor R in = 1 kΩ and a capacitor C in = 0.22 µF with a<br />
resistor R p = 100 kΩ (fig. 3).<br />
Note that we put the capacitor in series with R in in order to<br />
increase the DUT impedance at lower frequencies, thus<br />
increasing the effect of the EICN, without varying the <strong>voltage</strong><br />
power spectrum generated by the DUT (see Fig. 4), which in<br />
the explored frequency range (f > 100 Hz) is essentially due<br />
to the thermal <strong>noise</strong> of R in . In fact, the resistor R p is needed in<br />
order to provide <strong>for</strong> a bias path to the input of the amplifiers<br />
and its value is chosen high enough in order not to interfere<br />
significantly with the measurements in the explored<br />
bandwidth.<br />
S DUT<br />
(V 2 /Hz)<br />
10 -15<br />
10 -16<br />
10 -17<br />
2<br />
10 8<br />
10 7<br />
10 6<br />
10 2 10 3 10 4<br />
Frequency (Hz)<br />
Figure 4 - Power spectrum of the <strong>voltage</strong> <strong>noise</strong> generated by the<br />
DUT and squared modulus of the DUT impedance.<br />
|ZDUT |2 (Ω 2 )<br />
We followed the three steps procedure described in the<br />
previous section. By connecting the channels 1 and 2 to the<br />
DUT we obtain:<br />
2<br />
2<br />
12<br />
S<br />
DUT<br />
+ Z<br />
DUT<br />
Sin<br />
1<br />
Z<br />
DUT<br />
Sin2<br />
S = +<br />
(6)<br />
where S ini is the PSD of the EICN of the i-th channel. In<br />
the case of channels 3 and 4 connected to the DUT, we<br />
obtain:<br />
2<br />
2<br />
34<br />
S<br />
DUT<br />
+ Z<br />
DUT<br />
Sin3<br />
Z<br />
DUT<br />
Sin4<br />
S = +<br />
. (7)<br />
In the case of all the four channels connected to the DUT,<br />
we obtain:<br />
S<br />
+<br />
= S<br />
1234 DUT<br />
2<br />
Z<br />
DUT<br />
Sin3<br />
+ Z<br />
+ Z<br />
DUT<br />
DUT<br />
2<br />
2<br />
S<br />
in1<br />
S<br />
in4<br />
+ Z<br />
DUT<br />
2<br />
S<br />
in2<br />
The desired PSD of the DUT signal is there<strong>for</strong>e evaluated<br />
by using Eq. 4.<br />
The three measured spectra are reported in fig. 5 along<br />
with the extracted PSD of the DUT signal. It is important to<br />
underline that although at low frequency the effect of the<br />
EICN strongly increases due to the increase of the DUT<br />
impedance, the extracted S DUT results quite constant, as it was<br />
expected. The average error with respect to the expected<br />
DUT thermal <strong>noise</strong> in the bandwidth between f = 100 Hz and<br />
f = 1 kHz, where the EICN is up to 10 dB higher with respect<br />
to S DUT , results lower than 10 %.<br />
Power Spectral Density (V 2 /Hz)<br />
10 -15 S 1234<br />
S<br />
10 -16<br />
34<br />
S 12<br />
S DUT<br />
+<br />
(8)<br />
10 -17<br />
10 2 10 3 10 4<br />
Frequency (Hz)<br />
Figure 5 – Input referred cross-spectra obtained by connecting the<br />
DUT to: a) the first couple of amplifiers, b) the second couple of<br />
amplifiers, c) all four amplifiers. The extracted power spectrum of the<br />
<strong>voltage</strong> <strong>noise</strong> generated by the DUT is also reported.<br />
1192
IV.CONCLUSIONS<br />
In this work we have presented and experimentally<br />
validated a new <strong>method</strong> <strong>for</strong> <strong>voltage</strong> <strong>noise</strong> measurements.<br />
With respect to previous <strong>method</strong>s, the one we have presented<br />
allow, at least in principle, the complete elimination of the<br />
<strong>noise</strong> introduced by the amplifiers used <strong>for</strong> the<br />
measurements. This is obtained by resorting to the<br />
conventional cross correlation technique <strong>for</strong> the elimination<br />
of the contribution of the EIVN of the amplifiers and to a<br />
three step measurement procedure using different amplifier<br />
configurations in order to subtract the contribution of the<br />
EICN of the amplifiers. For the application of the <strong>method</strong> one<br />
does not need neither the estimation of the EIVN and of the<br />
EICN of the amplifiers, nor the estimation of the DUT<br />
impedance. This fact makes the application of our <strong>method</strong><br />
quite straight<strong>for</strong>ward. Moreover, as it is possible to eliminate<br />
both the contribution of the EIVN and of the EICN of the<br />
amplifiers, it is expected that the new <strong>method</strong> may provide by<br />
far better results with respect to all other <strong>method</strong>s which<br />
allow the elimination of the contribution of the EIVN or the<br />
EICN alone.<br />
REFERENCES<br />
[1] C. Ciofi, M. De Marinis, B. Neri, “Ultralow-Noise PC-Based<br />
Measurement System <strong>for</strong> the Characterization of the Metallizations of<br />
Integrated Circuits”, IEEE Trans. Instr. Meas. vol. 46, p. 789, 1997<br />
[2] M. Macucci and B. Pellegrini: “Very <strong>sensitive</strong> measurement <strong>method</strong> of<br />
electron device current <strong>noise</strong>”, IEEE Trans. Instrum. Meas., vol. 40,<br />
n.1, pp.7-12, 1991<br />
[3] A. Van der Ziel, “Noise: Sources, Characterization, Measurement”,<br />
Englewood Cliffs, NJ: Prentice-Hall, p. 54, 1970<br />
[4] M. Sampietro, L. Fasoli, and G. Ferrari: “Spectrum analyzer with <strong>noise</strong><br />
reduction by cross correlation technique on two channels”, Rev. Sci.<br />
Instrum., vol. 70 , n. 5, pp. 2520-2525, 1999<br />
[5] M. Sampietro, G. Accomando, L.G. Fasoli, G. Ferrari, E. C. Gatti,<br />
“High sensitivity <strong>noise</strong> measurement with a correlation spectrum<br />
analyzer”, IEEE Trans. Instrum. Meas., vol. 49, n.4, pp.820-822, 2000<br />
[6] C. Ciofi, F. <strong>Crupi</strong>, C. Pace, “A New Method <strong>for</strong> High Sensitivity Noise<br />
Measurements”, IEEE Trans. on Instrum. Meas., vol. 51, n. 4, pp. 656-<br />
659, 2002<br />
1193