US GAAP results press-release (Q2 2013) - NLMK Group
US GAAP results press-release (Q2 2013) - NLMK Group
US GAAP results press-release (Q2 2013) - NLMK Group
Create successful ePaper yourself
Turn your PDF publications into a flip-book with our unique Google optimized e-Paper software.
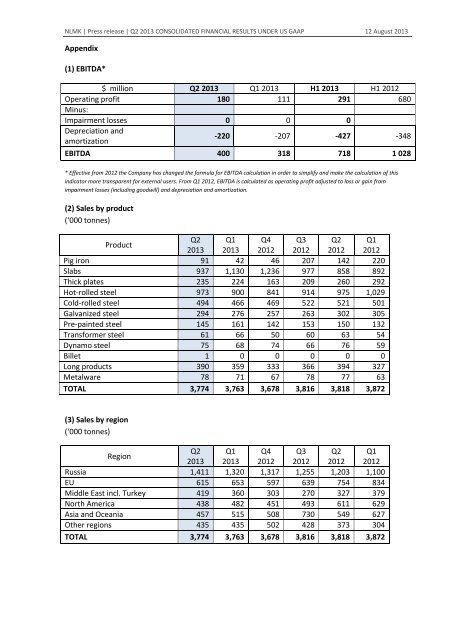
<strong>NLMK</strong> | Press <strong>release</strong> | <strong>Q2</strong> <strong>2013</strong> CONSOLIDATED FINANCIAL RESULTS UNDER <strong>US</strong> <strong>GAAP</strong> 12 August <strong>2013</strong><br />
Appendix<br />
(1) EBITDA*<br />
$ million <strong>Q2</strong> <strong>2013</strong> Q1 <strong>2013</strong> H1 <strong>2013</strong> H1 2012<br />
Operating profit 180 111 291 680<br />
Minus:<br />
Impairment losses 0 0 0<br />
Depreciation and<br />
amortization<br />
-220 -207 -427 -348<br />
EBITDA 400 318 718 1 028<br />
* Effective from 2012 the Company has changed the formula for EBITDA calculation in order to simplify and make the calculation of this<br />
indicator more transparent for external users. From Q1 2012, EBITDA is calculated as operating profit adjusted to loss or gain from<br />
impairment losses (including goodwill) and depreciation and amortization.<br />
(2) Sales by product<br />
(‘000 tonnes)<br />
Product<br />
<strong>Q2</strong> Q1 Q4 Q3 <strong>Q2</strong> Q1<br />
<strong>2013</strong> <strong>2013</strong> 2012 2012 2012 2012<br />
Pig iron 91 42 46 207 142 220<br />
Slabs 937 1,130 1,236 977 858 892<br />
Thick plates 235 224 163 209 260 292<br />
Hot-rolled steel 973 900 841 914 975 1,029<br />
Cold-rolled steel 494 466 469 522 521 501<br />
Galvanized steel 294 276 257 263 302 305<br />
Pre‐painted steel 145 161 142 153 150 132<br />
Transformer steel 61 66 50 60 63 54<br />
Dynamo steel 75 68 74 66 76 59<br />
Billet 1 0 0 0 0 0<br />
Long products 390 359 333 366 394 327<br />
Metalware 78 71 67 78 77 63<br />
TOTAL 3,774 3,763 3,678 3,816 3,818 3,872<br />
(3) Sales by region<br />
(‘000 tonnes)<br />
Region<br />
<strong>Q2</strong> Q1 Q4 Q3 <strong>Q2</strong> Q1<br />
<strong>2013</strong> <strong>2013</strong> 2012 2012 2012 2012<br />
Russia 1,411 1,320 1,317 1,255 1,203 1,100<br />
EU 615 653 597 639 754 834<br />
Middle East incl. Turkey 419 360 303 270 327 379<br />
North America 438 482 451 493 611 629<br />
Asia and Oceania 457 515 508 730 549 627<br />
Other regions 435 435 502 428 373 304<br />
TOTAL 3,774 3,763 3,678 3,816 3,818 3,872


