US GAAP results press-release (Q2 2013) - NLMK Group
US GAAP results press-release (Q2 2013) - NLMK Group
US GAAP results press-release (Q2 2013) - NLMK Group

Create successful ePaper yourself
Turn your PDF publications into a flip-book with our unique Google optimized e-Paper software.
<strong>NLMK</strong><br />
12 August <strong>2013</strong><br />
Press <strong>release</strong><br />
<strong>Q2</strong> AND H1 <strong>2013</strong> CONSOLIDATED FINANCIAL RESULTS UNDER <strong>US</strong> <strong>GAAP</strong> 1<br />
KEY HIGHLIGHTS<br />
‘000 t/<br />
$ million<br />
<strong>Q2</strong><br />
<strong>2013</strong><br />
Q1<br />
<strong>2013</strong><br />
Changes,<br />
qoq in %<br />
H1<br />
<strong>2013</strong><br />
H1<br />
2012<br />
Changes,<br />
qoq in %<br />
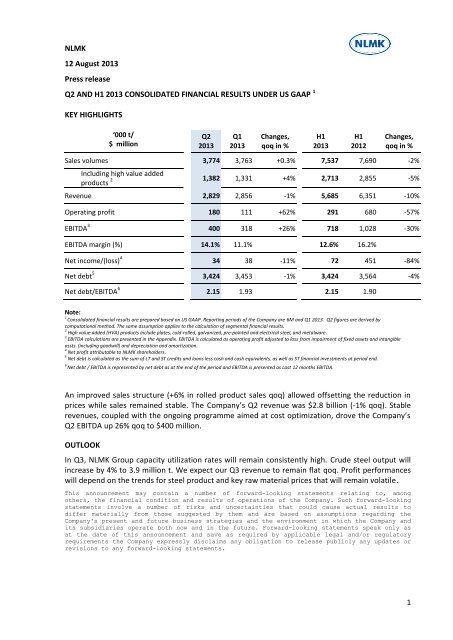
Sales volumes 3,774 3,763 +0.3% 7,537 7,690 -2%<br />
Including high value added<br />
products 2 1,382 1,331 +4% 2,713 2,855 -5%<br />
Revenue 2,829 2,856 -1% 5,685 6,351 -10%<br />
Operating profit 180 111 +62% 291 680 -57%<br />
EBITDA 3 400 318 +26% 718 1,028 -30%<br />
EBITDA margin (%) 14.1% 11.1% 12.6% 16.2%<br />
Net income/(loss) 4 34 38 -11% 72 451 -84%<br />
Net debt 5 3,424 3,453 -1% 3,424 3,564 -4%<br />
Net debt/EBITDA 6 2.15 1.93 2.15 1.90<br />
Note:<br />
1<br />
Consolidated financial <strong>results</strong> are prepared based on <strong>US</strong> <strong>GAAP</strong>. Reporting periods of the Company are 6M and Q1 <strong>2013</strong>. <strong>Q2</strong> figures are derived by<br />
computational method. The same assumption applies to the calculation of segmental financial <strong>results</strong>.<br />
2 High value added (HVA) products include plates, cold‐rolled, galvanized, pre‐painted and electrical steel, and metalware.<br />
3 EBITDA calculations are presented in the Appendix. EBITDA is calculated as operating profit adjusted to loss from impairment of fixed assets and intangible<br />
assts (including goodwill) and depreciation and amortization.<br />
4 Net profit attributable to <strong>NLMK</strong> shareholders.<br />
5 Net debt is calculated as the sum of LT and ST credits and loans less cash and cash equivalents, as well as ST financial investments at period end.<br />
6<br />
Net debt / EBITDA is represented by net debt as at the end of the period and EBITDA is presented as Last 12 months EBITDA.<br />
An improved sales structure (+6% in rolled product sales qoq) allowed offsetting the reduction in<br />
prices while sales remained stable. The Company’s <strong>Q2</strong> revenue was $2.8 billion (-1% qoq). Stable<br />
revenues, coupled with the ongoing programme aimed at cost optimization, drove the Company’s<br />
<strong>Q2</strong> EBITDA up 26% qoq to $400 million.<br />
OUTLOOK<br />
In Q3, <strong>NLMK</strong> <strong>Group</strong> capacity utilization rates will remain consistently high. Crude steel output will<br />
increase by 4% to 3.9 million t. We expect our Q3 revenue to remain flat qoq. Profit performances<br />
will depend on the trends for steel product and key raw material prices that will remain volatile.<br />
This announcement may contain a number of forward-looking statements relating to, among<br />
others, the financial condition and <strong>results</strong> of operations of the Company. Such forward-looking<br />
statements involve a number of risks and uncertainties that could cause actual <strong>results</strong> to<br />
differ materially from those suggested by them and are based on assumptions regarding the<br />
Company's present and future business strategies and the environment in which the Company and<br />
its subsidiaries operate both now and in the future. Forward-looking statements speak only as<br />
at the date of this announcement and save as required by applicable legal and/or regulatory<br />
requirements the Company ex<strong>press</strong>ly disclaims any obligation to <strong>release</strong> publicly any updates or<br />
revisions to any forward-looking statements.<br />
1
<strong>NLMK</strong> | Press <strong>release</strong> | <strong>Q2</strong> <strong>2013</strong> and 6M <strong>2013</strong> <strong>US</strong> <strong>GAAP</strong> Consolidated Financial Results 12 August <strong>2013</strong><br />
Grigory Fedorishin, <strong>NLMK</strong> CFO, commented on the <strong>Q2</strong> <strong>2013</strong> <strong>results</strong>:<br />
“Improved sales structure, programmes aimed at boosting the efficiency of the Novolipetsk hot<br />
end, coupled with other programmes to cut production costs and SG&A expenses drove EBITDA up<br />
by 26% to $400 million. EBITDA margin increased by 3 p.p. to 14%.<br />
“Capex outflow reduced as large scale steelmaking capacity expansion projects, including the <strong>NLMK</strong><br />
Kaluga one, a 1.5 m tpa mini-mill, were finalized. In <strong>Q2</strong>, capex totalled $221 million (down 54%<br />
yoy), and cash flow from operation was $330 million.<br />
“The Company is consistently working on optimizing its turnover capital: following the launch of<br />
<strong>NLMK</strong> Kaluga, the Company’s turnover capital remained practically flat quarter-on-quarter.<br />
“<strong>NLMK</strong> continued to optimize its credit portfolio, downsizing short term debt by $490 million (-33%<br />
qoq) to $994 million, and net debt to $3.42 billion. At the end of <strong>Q2</strong>, cash and cash equivalents<br />
stood at $1.24 billion.<br />
“In Q3, conditions in the steel product market remain challenging. Prices for steel products in a<br />
number of regions continued to fall, and the pricing environment remains volatile. In Q3, we expect<br />
our operating performance to remain stable and our share in domestic long product sales to grow<br />
marginally following the launch of <strong>NLMK</strong> Kaluga. <strong>NLMK</strong> will continue to optimize its cost structure<br />
along the entire process chain to offset the negative impact of market factors and cost inflation,<br />
associated with, among other things, growing prices for the services of Russian natural<br />
monopolies.”
<strong>NLMK</strong> | Press <strong>release</strong> | <strong>Q2</strong> <strong>2013</strong> and 6M <strong>2013</strong> <strong>US</strong> <strong>GAAP</strong> Consolidated Financial Results 12 August <strong>2013</strong><br />
CONFERENCE CALL DETAILS<br />
<strong>NLMK</strong> (LSE: <strong>NLMK</strong>) will be announcing its consolidated <strong>US</strong> <strong>GAAP</strong> <strong>results</strong> for <strong>Q2</strong> and H1 <strong>2013</strong> on Monday, 12 August <strong>2013</strong>.<br />
<strong>NLMK</strong> is pleased to invite the investment community to a conference call with the management of <strong>NLMK</strong>:<br />
Monday, 12 August <strong>2013</strong><br />
09:00 (New York)<br />
14:00 (London)<br />
17:00 (Moscow)<br />
To join the conference call, please, register online:<br />
https://eventreg1.conferencing.com/webportal3/reg.html?Acc=975352&Conf=188229<br />
or dial:<br />
International Call-in Number: +44 (0)20 7162 0025<br />
<strong>US</strong> Call-in Number: +1 334 323 6201Conference ID: 935699<br />
*We recommend that participants register on-line to avoid waiting in a queue or to start dialing in 5-10 minutes prior to<br />
ensure a timely start to the conference call.<br />
It is recommended that participants download presentation in advance on <strong>NLMK</strong>’s web-site www.nlmk.com<br />
The conference call replay will be available through 19 August <strong>2013</strong>.<br />
International Replay Number: +44 (0) 20 7031 4064<br />
<strong>US</strong> Replay Number: +1 954 334 0342<br />
Replay Access Code: 935699<br />
Contacts:<br />
<strong>NLMK</strong><br />
Sergey Takhiev<br />
+7 495 915 1575<br />
st@nlmk.com
<strong>NLMK</strong> | Press <strong>release</strong> | <strong>Q2</strong> <strong>2013</strong> and 6M <strong>2013</strong> <strong>US</strong> <strong>GAAP</strong> Consolidated Financial Results 12 August <strong>2013</strong><br />
MANAGEMENT COMMENTS<br />
<br />
<br />
<br />
<br />
Market review<br />
The growth in steel supply that continued through <strong>Q2</strong> on the back of increased global steel<br />
production (2% qoq; hereinafter comparison is made against Q1’13) had a negative impact on<br />
the price environment, with prices for standard rolled steel products being down by 6-8% 1<br />
despite the seasonal pick-up in demand.<br />
In the Russian market, apparent steel use increased, driven mainly by the seasonal pick-up in<br />
activity in the construction and infrastructure sectors.<br />
Production and sales structure<br />
<strong>Q2</strong> production of crude steel and steel products was 3.79 million t and 3.78 million t,<br />
respectively. <strong>Q2</strong> utilization rates at the Novolipetsk steelmaking facilities were 96%.<br />
Pig iron production at the Novolipetsk Blast Furnace #3 was idled due to weak demand in the<br />
commercial pig iron market. This had no impact on steel production.<br />
The share of semis in total sales decreased to 27% (-4 p.p.). Third party sales of slabs<br />
decreased by 17% to 0.94 million t, while sales of slabs in the Russian market increased by 20%<br />
to 0.18 million t. Sales of flat and long steel went up by 5% and 8%, respectively, driven by<br />
better sales volumes in Russia and Europe. Sales of high value added products went up by 4%<br />
to 1.38 million t.<br />
Sales markets<br />
<strong>NLMK</strong> grew its sales in Russia by 7% to 1.4 million t on the back of higher demand from its key<br />
domestic consumers which coincided with reduced activity in some external markets. The<br />
share of export sales contracted by 2 p.p. to 63%. Foreign Rolled Products segment accounted<br />
for 25% in total sales (-0.5 p.p.): <strong>NLMK</strong> Europe sales were 0.51 million t (+5%), and <strong>NLMK</strong> <strong>US</strong>A<br />
sales totalled 0.43 million t (-9%).<br />
Key international markets were Europe, the <strong>US</strong>A, South East Asia as well as the Middle East.<br />
Prices<br />
In the Russian market, steel product prices in RUB equivalent remained stable, supported by<br />
the seasonal growth in demand.<br />
In the <strong>US</strong>A and Europe, prices went down due to weakening activity on the part of the<br />
consumers that have restocked by the end of Q1, and to the high level of steel supply.<br />
Prices for steel products from <strong>NLMK</strong>’s Russian sites to the international markets remained<br />
stable: given the Company’s production and sales cycle, and the delay in the recognition of<br />
export sales, <strong>Q2</strong> prices were determined in part by the high prices in the second half of Q1 and<br />
the first half of <strong>Q2</strong>.<br />
<br />
Investment programme<br />
<strong>Q2</strong>’13 capex totalled $221 million. H1’13 capex was $375 million, half as high as H1’12. This<br />
significant decrease (-54% yoy against H1’12) was due to the completion of a number of large<br />
scale capacity expansion projects.<br />
1 HRC price trends in China, the <strong>US</strong>A, and Europe
<strong>NLMK</strong> | Press <strong>release</strong> | <strong>Q2</strong> <strong>2013</strong> and 6M <strong>2013</strong> <strong>US</strong> <strong>GAAP</strong> Consolidated Financial Results 12 August <strong>2013</strong><br />
On 23 July, <strong>NLMK</strong> Kaluga EAF mini mill was launched. The plant has a capacity of 1.5 million t<br />
of steel and 0.9 million t of long products per annum. It is currently running in hot-testing<br />
mode.<br />
Key investment projects for H2’13:<br />
o<br />
o<br />
Stoilensky<br />
Expansion of extraction and beneficiation capacities, and construction of a pelletizing<br />
plant.<br />
Pulverized coal injection (PCI)<br />
Trial runs for the 2.6 million t PCI system at the Novolipetsk BF-5 are scheduled for<br />
Q3’13. Further steps to implement this technology are planned for <strong>2013</strong>-2014.<br />
<br />
<br />
<br />
Debt management<br />
As at the end of <strong>Q2</strong>’13, net debt was down by 1% to $3.42 billion. Gross financial debt was<br />
down by 3% to $4.79 billion. Throughout the quarter, a total of $512 million was repaid<br />
(including two RUB bond issues for RUB 10 billion); $362 million was attracted.<br />
Weighted-average maturity of outstanding debt increased to 3.4 years from 3.3 years at the<br />
beginning of the quarter. Net debt to 12M EBITDA ratio was 2.15.<br />
Annual General Shareholders Meeting<br />
On 7 June <strong>2013</strong>, <strong>NLMK</strong>’s General Shareholders' Meeting declared dividends for 2012 in the<br />
amount of RUB 0.62 per one ordinary share. Dividend payments therefore totalled<br />
approximately $116 million, which is equivalent to 20% of <strong>NLMK</strong>’s net profit for 2012.<br />
Subsequent events<br />
On 1 and 6 August <strong>2013</strong>, <strong>NLMK</strong> placed BO-11 (see <strong>press</strong> <strong>release</strong>) and BO-12 (see <strong>press</strong> <strong>release</strong>)<br />
exchange bond issues with a total value of RUB 10 billion, a maturity period of 10 year, and a<br />
put option in 3 years. The rate of coupons 1-6 for these issues will be 8%.<br />
Proceeds from the placement of the bonds will be used for general corporate purposes.
<strong>NLMK</strong> | Press <strong>release</strong> | <strong>Q2</strong> <strong>2013</strong> and 6M <strong>2013</strong> <strong>US</strong> <strong>GAAP</strong> Consolidated Financial Results 12 August <strong>2013</strong><br />
KEY FINANCIALS<br />
<br />
<br />
<br />
<br />
Revenue<br />
<strong>Q2</strong> revenue was down by 1% qoq to $2,829 million. Top line was impacted mainly by lower<br />
average selling prices on the back of stable sales. Revenue was positively impacted by an<br />
improved sales mix, with the share of high value added products growing to 37% (+2 p.p. qoq).<br />
H1’13 revenue was down by 10% yoy to $5,685 million, <strong>press</strong>ured by lower average selling prices<br />
and a 2% decline in sales volumes.<br />
Operating profit<br />
<strong>Q2</strong> operating profit increased by 62% qoq to $180 million. Key growth factors included <strong>NLMK</strong>’s<br />
cost optimization programmes and an improved sales mix.<br />
Production costs sequentially decreased by 3% to $2,058 million while rolled product sales<br />
gained 6%. Costs were cut as a result of savings at the Novolipetsk hot-end. The weakening of<br />
the RUB against the $ had an additional positive impact on costs.<br />
<strong>Q2</strong> general and administrative expenses were down by 7% to $112 million. Among other factors,<br />
this was due to the change in provision for employee compensation, made in Q1’13.<br />
Commercial expenses were down by 12% to $227 million, as export sales from <strong>NLMK</strong>’s Russian<br />
sites decreased.<br />
H1’13 operating profit was $291 million, 57% down yoy, <strong>press</strong>ured mostly by the narrowing of<br />
the steel products/raw materials spread.<br />
H1’13 production costs were $4,183 million (-5% yoy), due to the 2% reduction in sales, the<br />
<strong>results</strong> achieved through cost cutting programmes, and the weakening of the RUB against the<br />
<strong>US</strong>D.<br />
Income tax<br />
<strong>NLMK</strong>’s <strong>Q2</strong>’13 tax deductions were $110 million (+523% qoq). This increase was associated<br />
mostly with the $63 million valuation allowance recognized in the income tax for partial<br />
impairment of the previously accrued deferred tax assets in the <strong>Group</strong>’s European assets. This<br />
was related to the economic conditions in Europe.<br />
Without this factor, income tax was approximately $47 million, +167% qoq, which corresponds<br />
to a 169% qoq increase in income from continuing operations before tax. The effective income<br />
tax rate in <strong>Q2</strong> was calculated without the valuation allowance for deferred tax assets and totaled<br />
33%.<br />
In H1’13, income tax stood at $127 million, -21% yoy.<br />
Net profit<br />
<strong>NLMK</strong>’s <strong>Q2</strong>’13 net profit decreased to $34 million (-11% qoq). This decrease was associated with<br />
the $63 million valuation allowance for non-recoverability of the previously accrued deferred tax<br />
assets of <strong>NLMK</strong>’s European sites (see Income tax section of the <strong>press</strong> <strong>release</strong>).<br />
Total interest expense, including capitalized interest expense, declined by 3% qoq to $62 million,<br />
together with a reduction in debt. In the P&L, the Company recognized $27 million (-11% qoq) or<br />
44% of total interest expense (including capitalized interest expense).<br />
<strong>NLMK</strong>’s H1’13 net profit decreased to $72 million (-84% yoy). This decrease was mostly<br />
associated with lower profit from main activities, FX rate losses, and the valuation allowance for<br />
deferred tax assets of <strong>NLMK</strong>’s European division.
<strong>NLMK</strong> | Press <strong>release</strong> | <strong>Q2</strong> <strong>2013</strong> and 6M <strong>2013</strong> <strong>US</strong> <strong>GAAP</strong> Consolidated Financial Results 12 August <strong>2013</strong><br />
<br />
Cash flow<br />
In <strong>Q2</strong>, operating cash flow grew by 32%* to $330 million. Operating cash flow was slightly below<br />
the EBITDA level adjusted for tax and interest expense due to efficient working capital<br />
management.<br />
In H1’13 operating cash flow was $580 million, a decrease of 28% yoy, due largely to lower<br />
operating profit as compared to H1’12.<br />
<strong>Q2</strong> investments were $221 million, up by 44% qoq. H1’13 investments declined by 54% yoy to<br />
$375 million (see Investment program section of the <strong>press</strong>-<strong>release</strong>).<br />
During <strong>Q2</strong>’13 <strong>NLMK</strong> paid out part of the FY2012 dividends in the amount of $111 million. During<br />
the quarter, <strong>NLMK</strong> repaid Russian RUB bonds totaling RUB 10 billion (equivalent of $320 million)<br />
and a syndicated loan obtained in 2008. These factors were behind a $266 million in net cash<br />
outflow from financing activity.<br />
In H1’13, net cash inflow from financing activity including external financing and an $800 million<br />
Eurobonds placement reached $26 million.<br />
Long term debt in total gross debt increased from 61% as at 31 December 2012 to 79% as at 30<br />
June <strong>2013</strong> following a series of refinancing transactions.<br />
As at the end of <strong>Q2</strong>’13 cash and cash equivalents and short term investments were $1.36<br />
billion.<br />
* to ensure comparability, Q1'13 operating cash flow is adjusted to the classification used in H1'13. Interest income from placing cash<br />
in deposits in H1'13 is included into cash flow from investing activities. In the statements published in Q1'13, this interest income was<br />
included into operating cash flow.
<strong>NLMK</strong> | Press <strong>release</strong> | <strong>Q2</strong> <strong>2013</strong> and 6M <strong>2013</strong> <strong>US</strong> <strong>GAAP</strong> Consolidated Financial Results 12 August <strong>2013</strong><br />
Steel Segment*<br />
$ million <strong>Q2</strong><br />
<strong>2013</strong><br />
Q1<br />
<strong>2013</strong><br />
Change,<br />
%<br />
H1<br />
<strong>2013</strong><br />
H1<br />
2012<br />
Change,<br />
%<br />
Steel product sales,<br />
‘000 tonnes<br />
2,999 2,966 +1% 5,965 6,027 -1%<br />
including third party<br />
sales, ‘000 tonnes<br />
2,364 2,374 +0% 4,738 4,578 +3%<br />
Revenue from external<br />
customers<br />
1,685 1,659 +2% 3,344 3,610 -7%<br />
Revenue from<br />
intersegmental<br />
operations<br />
371 346 +7% 717 885 -19%<br />
EBITDA 214 83 +156% 297 485 -39%<br />
EBITDA margin 10% 4% 7% 11%<br />
Steel Segment sales remained flat qoq totaling 2.4 million t. Sales to the Russian market increased<br />
driven by the seasonal growth in demand from the construction sector.<br />
Revenue from external customers went up by 2% to $1.685 million due to an increase in the share of<br />
high value added product sales and a weaker steel pricing environment.<br />
<strong>Q2</strong> EBITDA totaled $214 million (+156% qoq), which is related to cost cutting programmes at the<br />
Segment’s operations, <strong>US</strong>D appreciation against the RUB, and a delayed recognition of Q1 sales with<br />
higher prices. EBITDA margin went up by 10% (+6 p.p. qoq).<br />
H1’13 sales from external customers declined by 7% yoy due to lower average steel prices.<br />
H1’13 EBITDA declined by 39% yoy to $297 million as a result of the significantly narrowed steel<br />
product/raw material spreads.<br />
Outlook:<br />
High volatility in steel prices and misbalances of supply and demand in the global markets could<br />
negatively impact the Steel Segment’s Q3’13 financial <strong>results</strong>. Optimization programmes at the<br />
production operations will be focused on sustaining the Segment’s profitability.<br />
*The Steel Segment comprises: Novolipetsk (Lipetsk site), VIZ-Steel (a producer of electrical steel), trading companies Novexco Limited,<br />
Cyprus and Novex Trading S.A., Switzerland, Altai-Koks (Russia’s largest non-integrated coke manufacturer), as well as a number of service<br />
companies.
<strong>NLMK</strong> | Press <strong>release</strong> | <strong>Q2</strong> <strong>2013</strong> and 6M <strong>2013</strong> <strong>US</strong> <strong>GAAP</strong> Consolidated Financial Results 12 August <strong>2013</strong><br />
Long Products Segment*<br />
$ million <strong>Q2</strong><br />
<strong>2013</strong><br />
Q1<br />
<strong>2013</strong><br />
Change,<br />
%<br />
H1<br />
<strong>2013</strong><br />
H1<br />
2012<br />
Change,<br />
%<br />
Long products and<br />
metalware sales,<br />
469 430 +9% 899 854 +5%<br />
‘000 tonnes<br />
Revenue from external<br />
customers<br />
314 288 +9% 602 604 0%<br />
Revenue from<br />
intersegmental<br />
operations<br />
113 59 +92% 172 235 -27%<br />
EBITDA 23 20 +19% 43 79 -45%<br />
EBITDA margin 5% 6% 6% 9%<br />
In <strong>Q2</strong>, Segment’s sales went up by 9% qoq to 0.5 million t driven by strong demand from the<br />
construction sector and infrastructure. The sales growth together with relatively stable prices for long<br />
steel on the domestic market lead to a 9% increase in revenue from external customers that totaled<br />
$314 million. Revenue from intersegmental operations went up by 92% qoq to $113 million. This is<br />
attributed to higher scrap sales to the main production plant, Novolipetsk (part of the Steel<br />
Segment).<br />
The increase in steel sales contributed to a 19% EBITDA growth (to $23 million). EBITDA margin was<br />
5% (-1 p.p.)<br />
H1’13 increase in sales (+5% yoy to 0.9 million t) is associated with higher demand from the<br />
construction sector and increased utilization rates at the Segment’s operations. The yoy decline in<br />
H1’13 prices was offset by higher sales to external customers.<br />
H1’13 EBITDA declined by 45% yoy to $43 million due to narrowed spreads between long steel and<br />
scrap prices, and higher costs for energy and transportation. H1’13 EBITDA margin was 6% (-3 p.p.).<br />
Outlook:<br />
In Q3’13, following the launch of <strong>NLMK</strong> Kaluga, steel sales are expected to grow, contributing to the<br />
Segment’s profitability.<br />
* The Long Products Segment includes the financial performance of the Long Products Division companies: NSMMZ, UZPS,<br />
<strong>NLMK</strong> Kaluga, and scrap collecting and processing facilities. The core activities of these companies are steelmaking (EAFbased)<br />
and long product and metalware manufacturing, ferrous and non-ferrous scrap collection and processing.
<strong>NLMK</strong> | Press <strong>release</strong> | <strong>Q2</strong> <strong>2013</strong> and 6M <strong>2013</strong> <strong>US</strong> <strong>GAAP</strong> Consolidated Financial Results 12 August <strong>2013</strong><br />
Mining Segment*<br />
$ million <strong>Q2</strong><br />
<strong>2013</strong><br />
Q1<br />
<strong>2013</strong><br />
Change,<br />
%<br />
H1<br />
<strong>2013</strong><br />
H1<br />
2012<br />
Change,<br />
%<br />
Production of<br />
concentrate and<br />
sinter ore, ‘000<br />
3,849 3,772 +2% 7,621 7,762 -2%<br />
tonnes<br />
Sales of concentrate<br />
and sinter ore, ‘000 3,863 3,747 +3% 7,610 7,392 +3%<br />
tonnes<br />
including third<br />
party<br />
sales, ‘000<br />
970 976 -1% 1,945 1,381 +41%<br />
tonnes**<br />
Revenue from<br />
external<br />
100 92 +9% 192 121 +59%<br />
customers<br />
Revenue from<br />
intersegmental<br />
operations<br />
249 245 +2% 494 555 -11%<br />
EBITDA 227 215 +6% 442 464 -5%<br />
EBITDA margin 65% 64% 64% 69%<br />
Following the completion of planned repairs in <strong>Q2</strong>’13, production of iron ore concentrate increased<br />
by 2% to 3.85 million t. Iron ore concentrate and sinter ore sales increased by 3% to 3.86 million t<br />
which is attributable to higher sales to Novolipetsk.<br />
Despite decline in the iron ore market spot prices at the end of <strong>Q2</strong> the Mining Segment’s average<br />
price trend was positive. This, together with improved operating <strong>results</strong>, drove the revenue from<br />
third parties up 9% to $100 million.<br />
Higher sales and positive average price trends supported a 6% increase in EBITDA to $227 million.<br />
H1’13 revenue from third parties increased to $192 million largely as a result of higher yoy sales and<br />
lower yoy prices. With stable intersegmental sales to Novolipetsk, revenue from intersegmental<br />
operations declined 11% to $494 million.<br />
Lower yoy sales prices for iron ore drove the H1’13 EBITDA down 5% to $442 million. H1’13 EBITDA<br />
margin was 64% (-5 p.p. y-o-y)<br />
Outlook:<br />
In Q3’13, the operating <strong>results</strong> of the Segment will remain in line with <strong>Q2</strong> levels.<br />
* <strong>NLMK</strong>’s Mining Segment comprises Stoilensky (the <strong>Group</strong>’s key mining asset), Dolomit and Stagdok. These companies mainly supply raw<br />
materials to <strong>NLMK</strong>’s production facilities in Lipetsk and also sell limited volumes outside the <strong>Group</strong>.<br />
** Sales to third parties.
Foreign Rolled Products Segment*<br />
$ million <strong>Q2</strong><br />
<strong>2013</strong><br />
Q1<br />
<strong>2013</strong><br />
Change,<br />
%<br />
H1<br />
<strong>2013</strong><br />
H1<br />
2012<br />
Change,<br />
%<br />
Steel product sales,<br />
‘000 tonnes<br />
941 959 -2% 1,900 2,257 -16%<br />
Revenue from<br />
external<br />
730 816 -11% 1,546 2,015 -23%<br />
customers<br />
Revenue from<br />
intersegmental<br />
operations<br />
1 1 +10% 1 0<br />
EBITDA -62 -26 139% -89 -15 500%<br />
In <strong>Q2</strong>’13, Segment’s sales and revenue declined to 0.94 million t (-2% qoq) and $730 million (-11%),<br />
respectively, due to the weaker market environment and lower prices in Europe and the <strong>US</strong>A.<br />
Market conditions and one-off factors, including the $15 million inventory write-down (using the<br />
market prices approach) were behind the EBITDA decline to minus $62 million (minus $26 million in<br />
Q1).<br />
H1’13 EBITDA of the Segment was minus $89 million compared to minus $15 million in H1’12, due<br />
largely to stoppages at the Belgium rolling assets related to restructuring initiatives, and to the<br />
mastering (progressive increase in utilization rates) of the new thick plate line at <strong>NLMK</strong> DanSteel in<br />
H1’13.<br />
Outlook:<br />
In Q3, steel prices in Europe are expected to stabilize following the decline in June-July. In the <strong>US</strong>A,<br />
prices are expected to grow in Q3 after the decline that lasted through Q1 and <strong>Q2</strong>’13.<br />
Higher sales of value added products by the European assets, the effect from the restructuring<br />
initiatives (personnel optimization) at <strong>NLMK</strong> La Louvière, and measures aimed at cutting operating<br />
costs at all the operations across the segment are expected to offset the potential negative impact of<br />
the seasonal decrease in sales on the financial performance.<br />
* The Foreign Rolled Products Segment comprises steelmaking companies located outside Russia. These are rolling assets in Europe (<strong>NLMK</strong><br />
Europe) and the <strong>US</strong>A (<strong>NLMK</strong> <strong>US</strong>A), including those that became part of the <strong>Group</strong> starting from July 2011. <strong>NLMK</strong> Europe is represented by<br />
thick plate producers <strong>NLMK</strong> DanSteel (Denmark, the company was part of the Steel Segment until July 1, 2011), <strong>NLMK</strong> Clabecq (Belgium),<br />
<strong>NLMK</strong> Verona (Italy) and strip product producers <strong>NLMK</strong> La Louvière (Belgium), <strong>NLMK</strong> Coating (France), <strong>NLMK</strong> Strasbourg (France). <strong>NLMK</strong><br />
<strong>US</strong>A includes <strong>NLMK</strong> Pennsylvania, Sharon Coating, <strong>NLMK</strong> Indiana (part of the Steel Segment until July 1, 2011).<br />
11
<strong>NLMK</strong> | Press <strong>release</strong> | <strong>Q2</strong> <strong>2013</strong> CONSOLIDATED FINANCIAL RESULTS UNDER <strong>US</strong> <strong>GAAP</strong> 12 August <strong>2013</strong><br />
Appendix<br />
(1) EBITDA*<br />
$ million <strong>Q2</strong> <strong>2013</strong> Q1 <strong>2013</strong> H1 <strong>2013</strong> H1 2012<br />
Operating profit 180 111 291 680<br />
Minus:<br />
Impairment losses 0 0 0<br />
Depreciation and<br />
amortization<br />
-220 -207 -427 -348<br />
EBITDA 400 318 718 1 028<br />
* Effective from 2012 the Company has changed the formula for EBITDA calculation in order to simplify and make the calculation of this<br />
indicator more transparent for external users. From Q1 2012, EBITDA is calculated as operating profit adjusted to loss or gain from<br />
impairment losses (including goodwill) and depreciation and amortization.<br />
(2) Sales by product<br />
(‘000 tonnes)<br />
Product<br />
<strong>Q2</strong> Q1 Q4 Q3 <strong>Q2</strong> Q1<br />
<strong>2013</strong> <strong>2013</strong> 2012 2012 2012 2012<br />
Pig iron 91 42 46 207 142 220<br />
Slabs 937 1,130 1,236 977 858 892<br />
Thick plates 235 224 163 209 260 292<br />
Hot-rolled steel 973 900 841 914 975 1,029<br />
Cold-rolled steel 494 466 469 522 521 501<br />
Galvanized steel 294 276 257 263 302 305<br />
Pre‐painted steel 145 161 142 153 150 132<br />
Transformer steel 61 66 50 60 63 54<br />
Dynamo steel 75 68 74 66 76 59<br />
Billet 1 0 0 0 0 0<br />
Long products 390 359 333 366 394 327<br />
Metalware 78 71 67 78 77 63<br />
TOTAL 3,774 3,763 3,678 3,816 3,818 3,872<br />
(3) Sales by region<br />
(‘000 tonnes)<br />
Region<br />
<strong>Q2</strong> Q1 Q4 Q3 <strong>Q2</strong> Q1<br />
<strong>2013</strong> <strong>2013</strong> 2012 2012 2012 2012<br />
Russia 1,411 1,320 1,317 1,255 1,203 1,100<br />
EU 615 653 597 639 754 834<br />
Middle East incl. Turkey 419 360 303 270 327 379<br />
North America 438 482 451 493 611 629<br />
Asia and Oceania 457 515 508 730 549 627<br />
Other regions 435 435 502 428 373 304<br />
TOTAL 3,774 3,763 3,678 3,816 3,818 3,872
<strong>NLMK</strong> | Press <strong>release</strong> | <strong>Q2</strong> <strong>2013</strong> CONSOLIDATED FINANCIAL RESULTS UNDER <strong>US</strong> <strong>GAAP</strong> 12 August <strong>2013</strong><br />
(4) Revenue by region<br />
<strong>Q2</strong> <strong>2013</strong> Q1 <strong>2013</strong> <strong>Q2</strong> 2012 Q1 2012<br />
Region<br />
$<br />
million<br />
share,<br />
%<br />
$<br />
million<br />
share,<br />
%<br />
$<br />
million<br />
share,<br />
%<br />
$<br />
million<br />
share,<br />
%<br />
Russia 1,135 40% 1,057 37% 1,199 37% 1,021 33%<br />
EU 557 20% 573 20% 740 23% 698 23%<br />
Middle East incl.<br />
Turkey<br />
253 9% 223 8% 191 6% 269 9%<br />
North America 323 11% 373 13% 494 15% 458 15%<br />
Asia and Oceania 242 9% 282 10% 332 10% 359 12%<br />
Other regions 319 11% 348 12% 300 9% 289 9%<br />
TOTAL 2,829 100% 2,856 100% 3,257 100% 3,094 100%<br />
(5) Working capital<br />
$ million<br />
30.06. 31.03. 31.12. 30.09. 30.06. 31.03.<br />
<strong>2013</strong> <strong>2013</strong> 2012 2012 2012 2012<br />
Current assets 5,537 5,834 5,469 6,287 5,230 5,714<br />
Cash and cash equivalents 1,241 1,220 951 1,803 769 926<br />
Short term investments 121 271 107 11 10 11<br />
Accounts receivable 1,497 1,557 1,491 1,559 1,642 1,786<br />
Inventories 2,530 2,689 2,827 2,819 2,733 2,904<br />
Other current assets, net 148 97 93 96 76 87<br />
Current liabilities 2,647 2,940 3,302 4,155 3,579 3,577<br />
Accounts payable 1,609 1,412 1,462 1,713 1,582 1,783<br />
Short‐term debt 994 1,484 1,816 2,434 1,971 1,781<br />
Other current liabilities 44 45 24 9 26 12<br />
Working capital 2,890 2,894 2,167 2,133 1,651 2,137<br />
(6) Production of main steel products 2012-<strong>2013</strong><br />
(‘000 tonnes)<br />
Products<br />
<strong>Q2</strong> Q1 Q4 Q3 <strong>Q2</strong> Q1<br />
<strong>2013</strong> <strong>2013</strong> 2012 2012 2012 2012<br />
Coke 6% moisture, incl. 1,628 1,727 1,692 1,805 1,823 1,796<br />
Novolipetsk 625 635 650 649 649 644<br />
Altai-Koks 1,004 1,093 1,041 1,157 1,175 1,152<br />
Crude steel, incl 3,785 3,693 3,674 3,772 3,843 3,635<br />
Steel Segment 3,086 3,032 3,027 3,076 3,130 2,950<br />
Long Products Segment 488 450 436 479 465 423<br />
Foreign Rolled Products<br />
262<br />
211 211 211 216 247<br />
Segment<br />
Rolled products / finished<br />
2,842<br />
2,762 2,682 2,493 2,603 2,800<br />
products, incl.<br />
Flat steel 2,309 2,237 2,072 2,146 2,357 2,422<br />
Long steel 453 444 421 457 443 420
<strong>NLMK</strong> | Press <strong>release</strong> | <strong>Q2</strong> <strong>2013</strong> CONSOLIDATED FINANCIAL RESULTS UNDER <strong>US</strong> <strong>GAAP</strong> 12 August <strong>2013</strong><br />
(7) Slab sales, including to <strong>NLMK</strong> <strong>Group</strong> companies<br />
(‘000 tonnes)<br />
<strong>Q2</strong><br />
<strong>2013</strong><br />
Q1<br />
<strong>2013</strong><br />
Q4<br />
2012<br />
Q3<br />
2012<br />
<strong>Q2</strong><br />
2012<br />
Q1<br />
2012<br />
Sales to third parties, incl.. 937 1,130 1,236 977 858 892<br />
Export 756 979 1,173 973 847 892<br />
Domestic market 181 151 63 4 10<br />
Sales to subsidiaries 616 513 628 500 750 714<br />
Total 1,553 1,643 1,864 1,477 1,608 1,606