Appendix - William C. Overfelt High School
Appendix - William C. Overfelt High School
Appendix - William C. Overfelt High School

You also want an ePaper? Increase the reach of your titles
YUMPU automatically turns print PDFs into web optimized ePapers that Google loves.
<strong>Appendix</strong> Table Of Contents<br />
Item A 7-Period Bell Schedule ............................................................................................... 175<br />
Item B Budget Cut Results .....................................................................................................177<br />
Item C<br />
Budget Profiles............................................................................................................179<br />
Item D Campus Map ............................................................................................................. 181<br />
Item E Collaboration dates .................................................................................................... 183<br />
Item F Decision-Making Model ............................................................................................ 185<br />
Item G Demographic Data..................................................................................................... 187<br />
Item H GPA of 10th–12th Grade Students ............................................................................ 211<br />
Item I Graduation Requirements .......................................................................................... 213<br />
Item J <strong>School</strong> Accountability Report Card Summary............................................................ 215<br />
Item K Single Plan for Student Achievement ......................................................................... 217<br />
Item L Administrative Organizational Chart.......................................................................... 237<br />
Item M SLC Proposal ............................................................................................................. 239<br />
Item N Summary of Categorical Funds, Grants, and Partnerships.......................................... 245<br />
Item O Pyramid of Effort-Based <strong>School</strong> Success ..................................................................... 247<br />
Item P Rosters ....................................................................................................................... 249<br />
• 18.4<br />
• Equity Committee<br />
• Professional Learning Community<br />
• Safety Committee<br />
• <strong>School</strong> Site Council<br />
• Staff House Assignments<br />
<strong>Appendix</strong> 173
<strong>Appendix</strong> 174
ITEM A<br />
Bell Schedule<br />
<strong>Appendix</strong> 175
Bell Schedule<br />
ITEM A<br />
<strong>Appendix</strong> 176
ITEM B<br />
Budget Cut Results<br />
TITLE 2005-2006 2011-2012<br />
Student Advisors 2 2<br />
Academic Counselors 5.8 3<br />
<strong>School</strong> Psychologist 1 full time 1 Part time<br />
Librarian 1 1/5<br />
Library Technician 1 0<br />
Literacy Coach 1 0<br />
Athletic Director 2 2<br />
Student Activities Director 0.6 0.4<br />
Healthy Start Coordinator 1.0 0.4<br />
Healthy Start Secretary 0 0<br />
Attendance Secretary 1 1<br />
Attendance Clerks 2 1<br />
Bank Clerk 1 1<br />
Book Room Clerk 1 0.2<br />
Repro Technician 1 0<br />
Day Custodians 2 1<br />
Testing Clerk 1 0<br />
Registrar 1 1<br />
Receptionist 1 0<br />
Electronic Academy Technician 1 0<br />
Computer Technician 1 0.5<br />
Resource for Special Education<br />
Staff Development Coordinator 0.6 0<br />
Career Center Technician 1 0<br />
Campus Security San Jose Police Officers<br />
Para Educators -5<br />
Community Liaison 1 0<br />
Health Clerk 1 0.5<br />
Account Analyst 1 0<br />
Increase in class sizes has resulted in the loss of 8-10 teachers.<br />
<strong>Appendix</strong> 177
<strong>Appendix</strong> 178
ITEM C<br />
Budget Profile<br />
<strong>Appendix</strong> 179
Budget Profile<br />
ITEM C<br />
<strong>Appendix</strong> 180
ITEM D<br />
Campus Map<br />
<strong>Appendix</strong> 181
<strong>Appendix</strong> 182
ITEM E<br />
Collaboration Dates<br />
1 24-Aug House<br />
2 31-Aug House<br />
3 7-Sep WASC Home<br />
4 14-Sep House<br />
5 21-Sep Department<br />
6 28-Sep House<br />
7 5-Oct Staff - Grade Lesson (10/6) - Code red?<br />
8 12-Oct House<br />
9 19-Oct WASC Focus<br />
10 26-Oct WASC Focus<br />
11 2-Nov House<br />
12 9-Nov WASC Focus<br />
13 16-Nov WASC Focus<br />
14 30-Nov House<br />
15 7-Dec Department<br />
16 4-Jan Staff - Kick Off 2nd Semester<br />
17 11-Jan House<br />
18 18-Jan Department<br />
19 25-Jan House<br />
20 1-Feb House<br />
21 15-Feb Department<br />
22 29-Feb House<br />
23 7-Mar House<br />
24 14-Mar Department<br />
25 21-Mar House<br />
26 28-Mar House<br />
27 4-Apr STAR Lesson 4/5<br />
28 24-Apr WASC Visit (Reverse Collaboration)<br />
29 2-May House<br />
30 9-May Department<br />
<strong>Appendix</strong> 183
<strong>Appendix</strong> 184
<strong>Appendix</strong> 185<br />
Student Senate<br />
Meet: monthly<br />
Members: elected<br />
representatives from<br />
each 3 rd period class<br />
<strong>School</strong> Site Council:<br />
Meet: monthly<br />
Members: elected parents,<br />
students, staff,<br />
administration<br />
Responsible for oversight of<br />
the school plan and budget.<br />
Forum for parent and<br />
student concerns.<br />
Safety Team:<br />
Meet: biannually<br />
Members: APA, nominated<br />
staff, students, parents,<br />
community agencies.<br />
Responsible for the school<br />
safety plan.<br />
Administration:<br />
Meet: weekly<br />
Members: Principal, APED, APA,<br />
Final decision making authority<br />
including confidential issues.<br />
Management Team:<br />
Meet: weekly<br />
Members: administration, director of<br />
activities, professional development,<br />
head counselor<br />
Responsible for day to day operation<br />
of the entire campus.<br />
Department Chairs:<br />
Meet: monthly<br />
Members: elected chairs from each<br />
department and program. House Leaders!<br />
Responsible for department budgets,<br />
supplies, staffing, text books, curriculum…<br />
Equity Committee<br />
Meet: monthly and as needed<br />
Members: nominated by Principal, approved by constituents<br />
Audit for Equity within SLC and House Model (process and performance)<br />
18.4 Committee:<br />
Meet: monthly<br />
Members: 5 elected certificated<br />
staff, union representative,<br />
principal<br />
Responsible for advising changes<br />
in teachers’ working conditions.<br />
A forum for teachers’ concerns.<br />
SLC Coordinators:<br />
Meet: monthly (+ with DC)<br />
Members: Coordinators of all SLCs<br />
Responsible for guiding the work of<br />
our small learning communities<br />
including equity of placement and<br />
supporting schoolwide efforts.<br />
Teacher Leadership Team:<br />
Meet: every other week<br />
Members: APED, House Leaders, and<br />
volunteer teachers, open to all staff<br />
Responsible for planning collaboration<br />
and professional development, organizing<br />
school reform efforts.
<strong>Appendix</strong> 186
ITEM G<br />
Demographic Data<br />
SCHOOL ENROLLMENT<br />
BY ETHNICITY (number/percent)<br />
OVERFELT 2005-06 2006-07 2007-08 2008-09 2009-10 2010-11<br />
American 4 0.3% 4 0.3% 4 0.2% 2 0.1% 2 0.1% 1 0.1%<br />
Indian<br />
Asian 156 10.2% 125 8.0% 136 8.1% 142 8.2% 123 7.0% 119 7.8%<br />
Pacific<br />
41 2.7% 32 2.0% 36 2.2% 37 2.1% 35 2.0% 21 1.4%<br />
Islander<br />
Filipino 138 9.0% 134 8.6% 128 7.7% 131 7.6% 133 7.7% 121 8.0%<br />
African- 38 2.5% 38 2.4% 42 2.5% 30 1.7% 36 2.2% 29 1.9%<br />
American<br />
Hispanic 1126 73.6% 1201 76.9% 1300 77.9% 1361 78.5 1400 79.6% 1210 79.5%<br />
or Latino<br />
%<br />
White<br />
25 4.6% 24 1.5% 23 1.4% 30 1.7% 27 1.4% 18 1.2%<br />
(not Hispanic)<br />
Two or More 1 0.1% 4 0.3% 0 0.0% 0 0.0% 0 0.0% 1 0.1%<br />
Races<br />
Total 1529 1562 1669 1733 1756 1520<br />
BY GRADE (number/percent)<br />
OVERFELT 9th 10th 11th 12th Total<br />
2005-06 383 25.6% 419 27.4% 364 23.3% 363 23.7% 1529<br />
2006-07 407 26.1% 419 26.8% 394 25.2% 342 21.9% 1562<br />
2007-08 457 27.4% 449 26.9% 421 25.2% 342 20.5% 1669<br />
2008-09 440 25.4% 475 27.4% 433 25.0% 385 22.2% 1733<br />
2009-10 420 23.9% 440 25.1% 490 27.9% 406 23.1% 1756<br />
2010-11 369 24.3% 412 27.1% 379 24.9% 361 23.7% 1520<br />
BY GENDER (number/percent)<br />
OVERFELT Male Female Total Students<br />
2005-06 804 52.6% 725 47.4% 1529<br />
2006-07 805 51.5% 757 48.5% 1562<br />
2007-08 853 51.1% 816 48.9% 1669<br />
2008-09 904 52.2% 829 47.8% 1733<br />
2009-10 929 52.9% 827 47.1% 1756<br />
2010-11 820 53.9% 700 46.1% 1520<br />
TRENDS IN STUDENT ENROLLMENT<br />
OVERFELT 2005-06 2006-07 2007-08 2008-09 2009-10 2010-11<br />
Total Enrollment 1529 1562 1669 1733 1756 1520<br />
Gain/Loss +20 +33 +107 +64 +23 -236<br />
Grade 9 383 407 457 440 420 368<br />
Grade 10 419 419 449 475 440 412<br />
Grade 11 364 394 421 433 490 379<br />
Grade 12 363 342 342 385 406 361<br />
Ungraded 0 0 0 0 0 0<br />
<strong>Appendix</strong> 187
Demographic Data<br />
ITEM G<br />
PARENT EDUCATION LEVEL<br />
OVERFELT<br />
Response Rate<br />
Not <strong>High</strong> <strong>School</strong><br />
Graduate<br />
<strong>High</strong> <strong>School</strong><br />
Graduate<br />
Some College<br />
College<br />
Graduate<br />
Graduate<br />
<strong>School</strong><br />
2005-06 99% 62% 20% 9% 7% 1%<br />
2006-07 99% 59% 23% 11% 6% 1%<br />
2007-08 98% 56% 26% 11% 6% 1%<br />
2008-09 92% 52% 28% 12% 8% 1%<br />
2009-10 99% 56% 27% 9% 7% 1%<br />
2010-11 97% 67% 21% 7% 5% 1%<br />
<strong>Appendix</strong> 188
ITEM G<br />
Demographic Data<br />
STAFFING<br />
TEACHERS BY ETHNICITY (number/percent)<br />
OVERFELT 2005-06 2006-07 2007-08 2008-09 2009-10 2010-11<br />
American Indian 0 0.0% 0 0.0% 0 0.0% 1 1.2% 1 1.2% 0 0.0%<br />
Asian 4 5.6% 5 6.8% 6 7.3% 6 7.1% 6 7.3% 7 9.0%<br />
Pacific Islander 1 1.4% 1 1.4% 3 3.7% 2 2.4% 2 2.4% 2 2.6%<br />
Filipino 6 8.5% 6 8.1% 7 8.5% 9 10.5% 8 9.8% 5 8.4%<br />
African-American 6 8.5% 6 8.1% 8 9.8% 6 7.1% 6 7.3% 3 3.8%<br />
Hispanic or Latino 20 28.2% 19 25.7% 20 24.4% 28 32.9% 24 29.3% 22 26.2%<br />
White (not Hispanic) 34 47.9% 37 50.0% 37 45.1% 33 38.8% 33 40.3% 39 50.0%<br />
Multiple/ No Response 0 0.0% 0 0.0% 1 1.2% 0 0.0% 2 2.4% 0 0.0%<br />
Total Staff 71 74 82 85 82 78<br />
STAFF EDUCATION REPORT (number/percent)<br />
OVERFELT 2005-06 2006-07 2007-08 2008-09 2009-10 2010-11<br />
Doctorate 2 2.8% 2 2.7% 3 3.7% 2 2.4% 5 6.1% 5 6.4%<br />
Master’s Degree +30 8 11.3% 16 21.6% 17 20.6% 16 18.8% 18 22.0% 29 37.2%<br />
Master’s Degree 20 28.2% 14 18.9% 13 15.8% 14 16.5% 12 14.6% 0 0.0%<br />
Bachelor’s Degree +30 31 43.7% 35 47.3% 40 47.7% 40 47.1 43 52.5% 43 55.1%<br />
Bachelor’s Degree 9 12.7% 6 8.1% 7 13.5% 10 11.8% 2 2.4% 0 0.0%<br />
Less than Bachelor’s 1 1.4% 1 1.4% 2 2.7% 3 3.5% 2 2.4% 1 1.3%<br />
Total Staff 71 74 82 85 82 78<br />
TEACHER CREDENTIALS (number/percent)<br />
OVERFELT 2005-06 2006-07 2007-08 2008-09 2009-10 2010-11<br />
Full Credential 63 88.7% 66 89.2% 67 81.7% 67 78.8%<br />
University Intern 2 2.8% 5 6.8% 8 9.8% 8 9.4%<br />
District Intern 1 1.4% 1 1.4% 1 1.2% 1 1.2%<br />
Pre-Intern 0 0.0% 0 0.0% 3 3.7% 0 00%<br />
Emergency 12 16.9% 8 10.8% 8 9.8% 9 10.6%<br />
Waiver 0 0.0% 0 0.0% 0 0.0% 2 2.4%<br />
Total # of Teachers 71* 74* 82* 85*<br />
*The total number of teachers credentialed is higher than the stated number because some teachers have more than one<br />
credential.<br />
TEACHER EXPERIENCE<br />
OVERFELT<br />
Avg. Years<br />
Avg. Years in No. of First Year No. of Second Year<br />
Teaching<br />
District<br />
Teachers<br />
Teachers<br />
2005-06 17.5 15.3 3 2<br />
2006-07 15.8 13.5 6 3<br />
2007-08 14.4 12.2 7 7<br />
2008-09 12.2 9.9 5 10<br />
2009-10 12.5 10.1 3 3<br />
2010-11 12.2 9.9 5 1<br />
<strong>Appendix</strong> 189
Demographic Data<br />
ITEM G<br />
CLASSIFIED STAFF INFORMATION<br />
OVERFELT 2005-06 2006-07 2007-08 2008-09 2009-10 2010-11<br />
Para Professionals 12 13 11 12 18 15<br />
Office Staff 17 13 16 15 9 8<br />
Other Classified 15 16 14 16 11 14<br />
Full Time 43 41 28 27 38 18<br />
Part Time 1 1 13 16 0 19<br />
Total Classified 44 42 41 43 38 37<br />
CLASSIFIED STAFF BY ETHNICITY (number/percent)<br />
OVERFELT 2005-06 2006-07 2007-08 2008-09 2009-10 2010-11<br />
African-American/Black 4 9.1% 3 7.1% 3 7.3% 2 4.7% 4 10.6% 0 0.0%<br />
American Indian/Alaskan 2 4.5% 2 4.7% 2 4.9% 2 4.7% 0 0.0% 2 5.4%<br />
Native<br />
Asian 1 2.3% 1 2.4% 1 2.4% 0 0.0% 1 2.6% 1 2.7%<br />
Filipino 3 6.8% 0 0.0% 1 2.4% 2 4.7% 2 5.3% 2 5.4%<br />
Hispanic Latino 27 61.4% 22 52.4% 25 61.0% 28 60.2% 20 52.6% 24 64.9%<br />
Pacific Islander 1 2.3% 1 2.4% 1 2.4% 0 0.0% 0 0.0% 0 0.0%<br />
White, Not Hispanic 6 13.6% 6 14.3% 7 17.2% 7 16.3% 11 28.9% 8 21.6%<br />
Multiple/No Responses 0 0.0% 7 16.7% 1 2.4% 2 4.7% 0 0.0% 0 0.0%<br />
Total Classified 44 42 41 43 38 37<br />
OVERALL STAFF BY ETHNICITY (number/percent)<br />
OVERFELT 2010-11 2010-11 2010-2011 2010-2011 Total 2010-11<br />
Certificated Classified Total #<br />
%<br />
American Indian 0 2 2 2.0% 0.1%<br />
Asian 7 1 8 7.0% 7.8%<br />
Pacific Islander 2 0 2 2.0% 1.4%<br />
Filipino 5 2 7 6.0% 8.0%<br />
African-American 3 0 3 3.0% 1.9%<br />
Hispanic or Latino 22 24 46 40.0% 79.5%<br />
White (not Hispanic) 39 8 47 40.0% 1.2%<br />
Multiple/ No Response 0 0 0 0% 0.1%<br />
Total Staff 78 37 115<br />
<strong>Appendix</strong> 190
ITEM G<br />
Demographic Data<br />
LANGUAGE TESTING<br />
CALIFORNIA ENGLISH LANGUAGE DEVELOPMENT TEST (CELDT)<br />
OVERFELT 2005-06 2006-07 2007-08 2008-09 2009-10 2010-11<br />
Advanced 138 20 24 25 20 18<br />
Early Advanced 204 120 131 117 130 96<br />
Intermediate 94 155 156 164 160 121<br />
Early Intermediate 35 90 89 58 60 53<br />
Beginning 14 41 4118 37 20 18<br />
Number Tested 485 426 44196 401 390 306<br />
CALIFORNIA ENGLISH LANGUAGE DEVELOPMENT TEST (CELDT)<br />
ENGLISH PROFICIENCY<br />
(Students Meeting State Board of Education Criterion for English Proficiency)<br />
OVERFELT 2005-06 2006-07 2007-08 2008-09 2009-10 2010-11<br />
Number of Students 326 131 135 117 131 94<br />
Percent of Students 67% 31% 31% 29% 33.6% 31%<br />
Number Tested 485 426 441 401 390 306<br />
CALIFORNIA ENGLISH LANGUAGE DEVELOPMENT TEST (CELDT)<br />
ENGLISH PROFICIENCY BY GRADE<br />
(Students Meeting State Board of Education Criterion for English Proficiency)<br />
OVERFELT 2005-06 2006-07 2007-08 2008-09 2009-10 2010-11<br />
9th Grade 153 133 181 144 145 81<br />
10th Grade 122 113 96 103 108 110<br />
11th Grade 128 96 96 97 85 76<br />
12th Grade 82 84 68 67 52 39<br />
Total Number 485 426 441 401 390 306<br />
NCLB TEACHERS AND CLASSES<br />
NCLB<br />
NCLB<br />
63NCLB %<br />
NCLB<br />
% Teachers<br />
OVERFELT<br />
Core Classes Compliant Classes Compliant Classes Core Teachers In Prof. Development<br />
2003-04 212 199 94% 50 100%<br />
2004-05 229 201 88% 45 100%<br />
2005-06 265 214 81% N/R N/R<br />
2006-07 276 254 92% N/R N/R<br />
2007-08 276 254 92% N/R N/R<br />
2008-09 303 274 90.4% N/R N/R<br />
ENGLISH LEARNERS BY LANGUAGE (number/percent)<br />
OVERFELT 2005-06 2006-07 2007-08 2008-09 2009-10 2010-11<br />
Spanish 526 83.9% 493 87.6% 412 89.4% 417 89.1% 535 90.7% 437 89.5%<br />
Vietnamese 37 5.9.% 31 5.5% 23 5.0% 22 4.7% 25 4.2% 23 4.8%<br />
Punjabi 1 0.2% 0 0.0% 1 0.2% 0 0.0% 2 0.3% 2 0.4%<br />
Khmer 8 1.3% 7 1.2% 5 1.1% 0 0.0% 3 0.5% 3 0.6%<br />
Cantonese 4 0.6% 1 0.2% 0 0.0% 1 0.2% 0 0.0% 2 0.4%<br />
Filipino 25 4.0% 18 3.2% 12 2.6% 19 4.1% 14 2.4% 12 2.6%<br />
All Others 26 4.1% 13 4.3% 8 17% 9 1.9% 11 1.9% 9 1.9%<br />
Total 627 563 461 468 590 488<br />
<strong>Appendix</strong> 191
Demographic Data<br />
ITEM G<br />
ENGLISH LEARNERS BY GRADE (number/percent)<br />
OVERFELT 2005-06 2006-07 2007-08 2008-09 2009-10 2010-11<br />
9th Grade 222 35.4% 194 34.5% 167 36.2% 159 34.0% 158 26.8% 167 34.3%<br />
10th Grade 162 25.8% 159 28.2% 108 23.4% 124 26.5% 164 27.8% 148 30.3%<br />
11th Grade 146 23.3% 112 19.9% 107 23.2% 101 21.6% 154 26.1% 110 22.5%<br />
12th Grade 97 15.5% 98 17.4% 79 17.2% 84 17.9% 114 19.3% 63 12.9%<br />
Total 627 563 461 468 590 488<br />
ENGLISH LEARNER CLASSIFICATION BY YEAR<br />
OVERFELT 2005-06 2006-07 2007-08 2008-09 2009-10 2010-11<br />
English Learners 627 563 461 468 590 488<br />
FEP Students 546 615 781 812 756 679<br />
Students Redesignated 175 144 239 139 19 78<br />
Total Enrollment 1529 1562 1669 1730 1756 1520<br />
FLUENT-ENGLISH PROFICIENT (FEP) BY LANGUAGE<br />
(number/percent)<br />
OVERFELT 2005-06 2006-07 2007-08 2008-09 2009-10 2010-11<br />
Spanish 380 69.6% 445 72.4% 603 77.2% 641 78.9% 612 81.0% 549 80.9%<br />
Vietnamese 54 9.9% 49 8.0% 63 8.1% 67 8.3% 47 6.2% 49 7.2%<br />
Filipino 51 9.3% 59 9.6% 53 6.8% 45 5.5% 45 6.0% 41 6.0%<br />
Cantonese 8 1.5% 10 1.6% 8 1.0% 7 0.9% 8 1.1% 4 0.6%<br />
Punjabi 2 0.4% 1 0.2% 1 0.1% 2 0.2% 2 0.3% 3 0.4%<br />
Khmer 10 1.8% 11 1.8% 12 1.5% 0 0.0% 10 1.3% 6 0.9%<br />
Ilocono 14 2.6% 15 2.4% 15 1.9% 12 1.5% 7 0.9% 6 0.9%<br />
Hindi 2 0.4% 3 0.5% 2 0.3% 2 0.2% 1 0.1% 0 0.0%<br />
All Others 25 4.5% 22 3.5% 24 3.1% 36 4.5% 24 3.1% 51 3.1%<br />
FEP TOTALS 546 615 781 812 756 679<br />
FLUENT-ENGLISH PROFICIENT (FEP) BY GRADE<br />
(number/percent)<br />
OVERFELT 2005-06 2006-07 2007-08 2008-09 2009-10 2010-11<br />
9th Grade 94 17.2% 126 20.5% 188 24.1% 172 21.2% 171 22.6% 128 18.9%<br />
10th Grade 156 28.6% 159 25.9% 216 27.7% 237 29.2% 181 23.9% 178 25.7%<br />
11th Grade 132 24.2% 176 28.6% 208 26.6% 217 26.7% 215 28.5% 188 27.7%<br />
12th Grade 164 30.0% 154 25.0% 169 21.6% 186 22.9% 189 25.0% 185 27.7%<br />
Total 546 615 781 812 756 679<br />
ENGLISH LEARNER INFORMATION (number/percent)<br />
OVERFELT Enrollment English Learners<br />
Fluent<br />
Student (FEP)<br />
English-Proficient<br />
Redesignated<br />
2005-06 1529 627 41.0% 546 35.7% 175 11.4%<br />
2006-07 1562 563 36.0% 615 39.4% 144 9.2%<br />
2007-08 1669 461 27.6% 781 46.8% 239 14.3%<br />
2008-09 1730 468 27.1% 812 46.9% 139 8.0%<br />
2009-10 1756 590 33.6% 756 43.1% 19 1.1%<br />
2010-11 1520 488 32.1% 679 44.7% 78 5.1%<br />
<strong>Appendix</strong> 192
ITEM G<br />
Demographic Data<br />
LANGUAGE GROUP DATA TO DETERMINE “15 PERCENT AND ABOVE” TRANSLATION NEEDS<br />
OVERFELT<br />
Enrollment<br />
Number of<br />
English Learners<br />
Number of Fluent<br />
Eng. Learners<br />
Total English<br />
Learners and<br />
Fluent English<br />
Learners<br />
Overall Percent<br />
2005-06 1529 627 546 1173 76.72%<br />
2006-07 1562 563 615 1178 75.42%<br />
2007-08 1669 461 781 1242 74.42%<br />
2008-09 1730 468 812 1280 73.99%<br />
2009-10 1756 590 756 1346 76.65%<br />
2010-11 1520 488 679 1167 76.78%<br />
<strong>Appendix</strong> 193
Demographic Data<br />
ITEM G<br />
GRADUATION AND COLLEGE-BOUND<br />
12th GRADE ENROLLMENT AND GRADUATION<br />
OVERFELT 2004-05 2005-06 2006-07 2007-08 2008-09 2009-10<br />
12th Grade Enrollment 345 363 342 342 384 406<br />
Graduates 261 226 213 228 232 264<br />
UC/CSU Eligible Grads 57 50 43 57 69 68<br />
% UC/CSU Eligible Grads 20.7% 22.1% 20.2% 25.0% 29.7% 25.8%<br />
GRADUATES COMPLETING UC/CSU REQUIREMENTS BY ETHNICITY<br />
OVERFELT 2004-05 2005-06 2006-07 2007-08 2008-09 2009-10<br />
American 0<br />
0<br />
0<br />
0<br />
0<br />
0<br />
0.0%<br />
0.0%<br />
0.0%<br />
0.0%<br />
0.0%<br />
0.0%<br />
Indian of 0<br />
of 1<br />
of 0<br />
of 0<br />
of 0<br />
of 2<br />
8<br />
12<br />
20<br />
18 51.4 10<br />
18<br />
Asian<br />
51.3%<br />
35.7% of 36.4% 47.4% of 52.2%<br />
of 39<br />
of 35 % of 28<br />
of 38<br />
22<br />
23<br />
Pacific<br />
Islander<br />
Filipino<br />
Hispanic/<br />
Latino<br />
African<br />
American<br />
White not<br />
Hispanic<br />
Multiple/<br />
No Response<br />
Total<br />
1<br />
of 4<br />
20<br />
of 41<br />
15<br />
of<br />
166<br />
1<br />
of 6<br />
0<br />
of 5<br />
0<br />
of 0<br />
57<br />
of<br />
261<br />
25.0%<br />
48.8%<br />
9.0%<br />
16.7%<br />
0.0%<br />
0.0%<br />
21.8%<br />
0<br />
of 7<br />
12<br />
of 26<br />
16<br />
of<br />
148<br />
4<br />
of 6<br />
0<br />
of 2<br />
0<br />
of 1<br />
50<br />
of<br />
226<br />
0.0%<br />
46.2<br />
%<br />
10.8<br />
%<br />
66.7<br />
%<br />
0.0%<br />
0.0%<br />
22.1<br />
%<br />
0<br />
of 3<br />
11<br />
of 35<br />
20<br />
of 133<br />
1<br />
of 9<br />
1<br />
of 5<br />
0<br />
of 0<br />
43<br />
of 213<br />
0.0%<br />
31.4%<br />
15.0%<br />
11.1%<br />
20.0%<br />
0.0%<br />
20.2%<br />
0<br />
of 5<br />
15<br />
of<br />
30<br />
33<br />
of<br />
161<br />
0<br />
of 6<br />
1<br />
of 4<br />
0<br />
of 0<br />
57<br />
of<br />
228<br />
0.0%<br />
50.0%<br />
20.5%<br />
0.0%<br />
25.0%<br />
0.0%<br />
25.0%<br />
0<br />
of 7<br />
13<br />
of 23<br />
37<br />
of<br />
161<br />
1<br />
of 2<br />
0<br />
of 1<br />
0<br />
of 0<br />
69<br />
of<br />
232<br />
GRADUATION RATES BASED ON NCES DEFINITION<br />
0.0%<br />
56.5%<br />
23.0%<br />
50.0%<br />
0.0%<br />
0.0%<br />
29.7%<br />
0<br />
of 1<br />
13<br />
of<br />
27<br />
39<br />
of<br />
201<br />
1<br />
of 5<br />
2<br />
of 4<br />
1<br />
of 1<br />
69<br />
of<br />
264<br />
0.0%<br />
48.1%<br />
19.4%<br />
20.0%<br />
50.0%<br />
100.0%<br />
25.8%<br />
OVERFELT 2004-05 2005-06 2006-07 2007-08 2008-09 2009-10<br />
Dropouts 33 66 52 62 72 67<br />
Graduates 261 226 213 228 232 264<br />
Graduation Rate 83.4% 77.4% 61.9% 78.6% 60.4% 72.7%<br />
DROPOUTS AND ONE-YEAR AND FOUR-YEAR DERIVED RATES<br />
OVERFELT 2004-05 2005-06 2006-07 2007-08 2008-09 2009-10<br />
Dropouts 33 66 52 53 107 67<br />
1-year drop rate 2.2% 4.3% 3.3% 4.3% 5.6% 3.8%<br />
4-year dropout rate 9.6% 18.0% 15.1% 19.2% 23.1% 16.1%<br />
<strong>Appendix</strong> 194
ITEM G<br />
Demographic Data<br />
DROPOUTS BY ETHNICITY (number/percent)<br />
OVERFELT 2004-05 2005-06 2006-07 2007-08 2008-09 2009-10<br />
American Indian 0 0.0% 0 0.0% 0 0.0% 0 0.0% 0 0.0% 0 0.0%<br />
Asian 1 3.0% 13 19.7% 3 5.8% 3 5.7% 4 3.7% 7 10.4%<br />
Pacific Islander 0 0.0% 1 1.5% 1 1.9% 1 1.9% 2 1.9% 1 1.5%<br />
Filipino 0 0.0% 3 4.5% 1 1.9% 2 3.8% 6 5.6% 1 1.5%<br />
Hispanic 32 97.0% 48 62.8% 44 84.6% 45 84.8% 92 86.0% 56 83.6%<br />
African American 0 0.0% 1 1.5% 3 5.8% 2 3.8% 2 1.9% 2 3.0%<br />
White 0 0.0% 0 0.0% 0 0.0% 0 0.0% 1 0.9% 0 0.0%<br />
Multiple/No Response 0 0.0% 0 0.0% 0 0.0% 0 0.0% 0 0.0% 0 0.0%<br />
Total 33 66 52 53 107 67<br />
DROPOUTS BY GENDER (number/percent)<br />
OVERFELT 2004-05 2005-06 2006-07 2007-08 2008-09 2009-10<br />
Male 23 69.7% 39 59.1% 31 59.6% N/A N/A 54 50.5% 33 49.3%<br />
Female 10 30.3% 27 40.1% 21 40.4% N/A N/A 53 49.5% 34 50.7%<br />
Total Dropouts 33 66 52 53 107 67<br />
DROPOUTS BY GRADE (number/percent)<br />
OVERFELT 2004-05 2005-06 2006-07 2007-08 2008-09 2009-10<br />
9th Grade 0 0.0% 0 0.0% 0 0.0% 0 0.0% 8 7.5% 0 0.0%<br />
10th Grade 0 0.0% 2 3.0% 0 0.0% 1 1.9% 7 6.5% 0 0.0%<br />
11th Grade 0 0.0% 0 0.0% 1 1.9% 0 0.0% 8 7.5% 5 7.5%<br />
12th Grade 33 100.0% 64 97.0% 51 98.1% 52 98.1% 84 78.5% 62 92.5%<br />
Total Dropouts 33 66 52 53 107 67<br />
ACT SCORES<br />
OVERFELT<br />
Grade 12 Number Percent Average Score Score Score<br />
Enrollment Tested Tested<br />
≥ 21 Number ≥ 21 Rate<br />
2004-05 345 25 7.2% 19.2 11 3.2%<br />
2005-06 363 16 4.4% 19.6 5 1.4%<br />
2006-07 342 16 4.7% 19.6 5 31.3%<br />
2007-08 342 15 4.4% 17.5 2 13.3%<br />
2008-09 384 33 8.59% 18.09 90 27.27%<br />
2009-10 406 65 16.01% 17.31 12 18.46%<br />
SAT 1 SCORES<br />
OVERFELT<br />
Grade 12 Number Verbal Average Math Average Writing VMW<br />
Enrollment Tested<br />
Average Average<br />
2004-05 345 86 434 467 N/A 901<br />
2005-06 363 121 417 461 430 1308<br />
2006-07 342 91 423 460 432 1315<br />
2007-08 342 91 429 439 429 1297<br />
2008-09 384 95 434 453 423 1310<br />
2009-10 406 78 444 457 433 1334<br />
<strong>Appendix</strong> 195
Demographic Data<br />
ITEM G<br />
ADVANCED PLACEMENT SCORES<br />
OVERFELT<br />
Grade 12 Grade 11/12 No. of No of Exams AP ≥ 3 AP ≥ 3<br />
Enrollment Enrollment Test Takers ≥ 3 (12th Grade) (11-12th Grade)<br />
2005-06 363 727 199 48 26 15<br />
2006-07 342 736 223 39 44 11<br />
2007-08 342 763 231 64 49 23<br />
2008-09 384 817 276 57 53 34<br />
2009-10 406 896 267 65 40 35<br />
<strong>Appendix</strong> 196
ITEM G<br />
Demographic Data<br />
API INFORMATION<br />
API SCORES<br />
OVERFELT 2005-06 2006-07 2007-08 2008-09 2009-10 2010-11<br />
API Base 621 643 655 654 659 661<br />
Change -1 +22 +12 -1 +5 +2<br />
Number students tested 998 998 1099 1108 1085 968<br />
Statewide Rank 2 3 3 3 2<br />
Similar <strong>School</strong>s Rank 7 9 9 8 7<br />
SUBGROUPS 2006<br />
SUBGROUPS 2007<br />
African<br />
American<br />
American<br />
Indian<br />
Test<br />
Takers<br />
Num.<br />
Signif.?<br />
API<br />
Base<br />
Growth<br />
Target<br />
API<br />
Target<br />
25 No -- -- --<br />
1 No -- -- --<br />
African<br />
American<br />
American<br />
Indian<br />
Test<br />
Takers<br />
Num.<br />
Signif.?<br />
API<br />
Base<br />
Growth<br />
Target<br />
API<br />
Target<br />
20 No -- -- --<br />
2 No -- -- --<br />
Asian 95 No -- -- --<br />
Filipino 101 Yes 728 5 733<br />
Asian 88 No -- -- --<br />
Filipino 88 No -- -- --<br />
Hispanic/<br />
Latino<br />
Pacific<br />
Islander<br />
739 Yes 599 10 609<br />
23 No -- -- --<br />
Hispanic/<br />
Latino<br />
Pacific<br />
Islander<br />
762 Yes 619 9 628<br />
26 No -- -- --<br />
White 14 No -- -- --<br />
White 12 No -- -- --<br />
Socioecon.<br />
Disadvant.<br />
English<br />
Learners<br />
Students w/<br />
Disabilities<br />
774 Yes 612 9 621<br />
624 Yes 591 10 601<br />
92 No -- -- --<br />
Socioecon.<br />
Disadvant.<br />
English<br />
Learners<br />
Students w/<br />
Disabilities<br />
762 Yes 632 8 640<br />
596 Yes 596 10 606<br />
98 No -- -- --<br />
<strong>Appendix</strong> 197
Demographic Data<br />
ITEM G<br />
African<br />
American<br />
American<br />
Indian<br />
SUBGROUPS 2008<br />
Test<br />
Takers<br />
Num.<br />
Signif.?<br />
API<br />
Base<br />
Growth<br />
Target<br />
API<br />
Target<br />
28 No -- -- --<br />
1 No -- -- --<br />
Asian 92 No -- -- --<br />
Filipino 90 No -- -- --<br />
Hispanic/<br />
Latino<br />
Pacific<br />
Islander<br />
855 Yes 633 9 642<br />
20 No -- -- --<br />
White 15 No -- -- --<br />
African<br />
American<br />
American<br />
Indian<br />
SUBGROUPS 2009<br />
Test<br />
Takers<br />
Num.<br />
Signif.?<br />
API<br />
Base<br />
Growth<br />
Target<br />
API<br />
Target<br />
21 No -- -- --<br />
1 No -- -- --<br />
Asian 84 No -- -- --<br />
Filipino 93 No -- -- --<br />
Hispanic/<br />
Latino<br />
Pacific<br />
Islander<br />
866 Yes 630 10 640<br />
21 No -- -- --<br />
White 22 No -- -- --<br />
Socioecon.<br />
Disadvant.<br />
English<br />
Learners<br />
Students w/<br />
Disabilities<br />
901 Yes 638 8 646<br />
639 Yes 593 10 603<br />
124 No 451 -- --<br />
Socioecon.<br />
Disadvant.<br />
English<br />
Learners<br />
Students w/<br />
Disabilities<br />
898 Yes 639 10 649<br />
609 Yes 591 12 603<br />
130 Yes 501 17 518<br />
SUBGROUPS 2010<br />
SUBGROUPS 2011<br />
African<br />
American<br />
American<br />
Indian<br />
Test<br />
Takers<br />
Num.<br />
Signif.?<br />
API<br />
Base<br />
Growth<br />
Target<br />
API<br />
Target<br />
15 No -- -- --<br />
0 No -- -- --<br />
Asian 78 No -- -- --<br />
Filipino 76 No -- -- --<br />
Hispanic/<br />
Latino<br />
Pacific<br />
Islander<br />
881 Yes 640 9 649<br />
17 No -- -- --<br />
White 12 No -- -- --<br />
African<br />
American<br />
American<br />
Indian<br />
Test<br />
Takers<br />
Num.<br />
Signif.?<br />
API<br />
Base<br />
Growth<br />
Target<br />
API<br />
Target<br />
16 No 589 -- --<br />
0 No -- -- --<br />
Asian 82 No 806 A A<br />
Filipino 80 No 743 -- --<br />
Hispanic/<br />
Latino<br />
Pacific<br />
Islander<br />
769 Yes 639 +9 648<br />
12 No 645 -- --<br />
White 8 No -- -- --<br />
Socioecon.<br />
Disadvant.<br />
English<br />
Learners<br />
Students w/<br />
Disabilities<br />
4 No -- -- --<br />
990 Yes 655 8 663<br />
647 Yes 600 11 611<br />
Socioecon.<br />
Disadvant.<br />
English<br />
Learners<br />
Students w/<br />
Disabilities<br />
1 No -- -- --<br />
634 Yes -- -- --<br />
571 Yes 597 +10 607<br />
<strong>Appendix</strong> 198
ITEM G<br />
Demographic Data<br />
Asian<br />
Test<br />
Takers<br />
Num.<br />
Signif.?<br />
API<br />
Base<br />
Growth<br />
Target<br />
API<br />
Target<br />
2006 95 No -- -- --<br />
2007 88 No -- -- --<br />
2008 92 No -- -- --<br />
2009 84 No -- -- --<br />
2010 78 No -- -- --<br />
2011 82 No 806 A A<br />
Hispanic/Latino<br />
Test<br />
Takers<br />
Num.<br />
Signif.?<br />
API<br />
Base<br />
Growth<br />
Target<br />
API<br />
Target<br />
2006 774 Yes 612 9 621<br />
2007 762 Yes 632 8 640<br />
2008 904 Yes 638 8 646<br />
2009 898 Yes 639 8 647<br />
2010 990 Yes 655 8 663<br />
2011 634 Yes -- -- --<br />
English Learners<br />
Test<br />
Takers<br />
Num.<br />
Signif.?<br />
API<br />
Base<br />
Growth<br />
Target<br />
API<br />
Target<br />
2006 624 Yes 591 10 601<br />
2007 596 Yes 596 10 606<br />
2008 639 Yes 593 10 603<br />
2009 609 Yes 591 10 601<br />
2010 647 Yes 600 11 611<br />
2011 571 Yes 597 10 607<br />
Filipino<br />
Test<br />
Takers<br />
Num.<br />
Signif.?<br />
API<br />
Base<br />
Growth<br />
Target<br />
API<br />
Target<br />
2006 101 Yes 728 5 733<br />
2007 88 No -- -- --<br />
2008 90 No -- -- --<br />
2009 93 No -- -- --<br />
2010 76 No -- -- --<br />
2011 80 No 743 -- --<br />
Socio-Economically Disadvantaged<br />
Test<br />
Takers<br />
Num.<br />
Signif.?<br />
API<br />
Base<br />
Growth<br />
Target<br />
API<br />
Target<br />
2006 774 Yes 612 9 621<br />
2007 762 Yes 632 8 640<br />
2008 904 Yes 638 8 646<br />
2009 898 Yes 639 8 647<br />
2010 990 Yes 655 8 663<br />
2011 634 Yes -- -- --<br />
Students with Disabilities<br />
Test<br />
Takers<br />
Num.<br />
Signif.?<br />
API<br />
Base<br />
Growth<br />
Target<br />
API<br />
Target<br />
2006 92 No -- -- --<br />
2007 98 No -- -- --<br />
2008 124 No 451 -- --<br />
2009 130 Yes 501 17 518<br />
2010 95 No -- -- --<br />
2011 104 No 420 -- --<br />
<strong>Appendix</strong> 199
Demographic Data<br />
ITEM G<br />
OVERFELT<br />
STAR AND CAHSEE TESTING<br />
STAR RESULTS SCIENCE AND SOCIAL SCIENCE<br />
Science % Proficient<br />
and<br />
Above<br />
Science %<br />
Basic and<br />
Above<br />
Social Science %<br />
Proficient<br />
And Above<br />
Social Science<br />
% Basic and<br />
Above<br />
2005-06 11% 51% 13% 44%<br />
2006-07 14% 60% 17% 47%<br />
2007-08 16% 58% 20% 47%<br />
2008-09 15% 54% 25% 52%<br />
2009-10 18% 57% 26% 54%<br />
2010-11 17% 56% 24% 52%<br />
STAR RESULTS LANGUAGE ARTS AND MATHEMATICS PROFICIENCY<br />
OVERFELT Language Arts %<br />
Proficient and Above<br />
Language Arts %<br />
Basic and Above<br />
Mathematics<br />
% Proficient and<br />
Above<br />
Mathematics<br />
% Basic and<br />
Above<br />
2005-06 20% 50% 15% 44%<br />
2006-07 26% 59% 12% 40%<br />
2007-08 26% 60% 14% 39%<br />
2008-09 31% 63% 15% 36%<br />
2009-10 31% 64% 16% 39%<br />
2010-11 32% 63% 17% 40%<br />
CAHSEE Mathematics Pass Rate By Year<br />
OVERFELT 2005-06 2006-07 2007-08 2008-09 2009-10 2010-11<br />
Number Tested 753 389 423 474 391 394<br />
Number Passing 313 256 316 327 271 272<br />
Percent Passing 42% 66% 75% 69% 69% 69%<br />
CAHSEE English/Language Arts Pass Rate By Year<br />
OVERFELT 2005-06 2006-07 2007-08 2008-09 2009-10 2010-11<br />
Number Tested 770 389 423 475 393 396<br />
Number Passing 327 245 308 306 282 267<br />
Percent Passing 42% 63% 73% 64% 72% 67%<br />
Male<br />
Math #<br />
ELA<br />
Tested Passing Tested Passing<br />
2005-06 180 89 48% 175 101 58%<br />
2006-07 70 51 73% 69 52 75%<br />
2007-08 81 65 80% 81 67 83%<br />
2008-09 92 69 75% 93 71 76%<br />
2009-10 35 24 69% 34 26 76%<br />
2010-11 112 84 75 111 81 73%<br />
Female<br />
Math<br />
ELA<br />
Tested Passing Tested Passing<br />
2005-06 369 159 43% 346 166 48%<br />
2006-07 196 129 66% 196 136 69%<br />
2007-08 205 149 73% 204 154 75%<br />
2008-09 331 186 56% 354 177 50%<br />
2009-10 173 121 70% 176 131 74%<br />
2010-11 187 128 68% 186 130 70%<br />
<strong>Appendix</strong> 200
ITEM G<br />
Demographic Data<br />
African-American<br />
Math #<br />
ELA<br />
Tested Passing Tested Passing<br />
2005-06 27 12 44% 19 9 47%<br />
2006-07 5 * * 5 * *<br />
2007-08 9 * * 9 * *<br />
2008-09 21 13 62% 21 16 76%<br />
2009-10 6 * * 6 * *<br />
2010-11<br />
*Scores are not reported because it would be too easy to identify<br />
individual students<br />
American Indian<br />
Math #<br />
ELA<br />
Tested Passing Tested Passing<br />
2005-06 3 * * 2 * *<br />
2006-07 0 * * 0 * *<br />
2007-08 1 * * 1 * *<br />
2008-09 0 * * 0 * *<br />
2009-10 0 * * 0 * *<br />
2010-11 0 * * 0 * *<br />
*Scores are not reported because it would be too easy to identify<br />
individual students<br />
Hispanic/Latino<br />
Math #<br />
ELA<br />
Tested Passing Tested Passing<br />
2005-06 599 236 39% 604 236 39%<br />
2006-07 299 186 62% 299 175 59%<br />
2007-08 336 240 71% 337 233 69%<br />
2008-09 572 296 52% 523 283 45%<br />
2009-10 310 208 67% 315 223 71%<br />
2010-11 307 201 65% 308 202 66%<br />
Filipino<br />
Math #<br />
ELA<br />
Tested Passing Tested Passing<br />
2005-06 46 30 65% 44 37 84%<br />
2006-07 31 26 84% 31 25 81%<br />
2007-08 29 25 86% 29 26 90%<br />
2008-09 53 40 75% 52 33 63%<br />
2009-10 19 18 95% 19 17 89%<br />
2010-11 36 31 86% 36 30 83%<br />
Socio-Economically Disadvantaged<br />
Math #<br />
ELA<br />
Tested Passing Tested Passing<br />
2005-06 536 215 40% 558 220 39%<br />
2006-07 315 203 64% 316 192 61%<br />
2007-08 308 248 73% 338 239 71%<br />
2008-09 380 258 68% 380 235 62%<br />
2009-10 356 247 69% 359 256 71%<br />
2010-11 278 185 67% 279 182 65%<br />
White Not Hispanic<br />
Math #<br />
ELA<br />
Tested Passing Tested Passing<br />
2005-06 15 4 27% 13 8 62%<br />
2006-07 3 * * 3 * *<br />
2007-08 5 * * 5 * *<br />
2008-09 8 * * 7 * *<br />
2009-10 5 * * 5 * *<br />
2010-11 1 * * 1 * *<br />
*Scores are not reported because it would be too easy to identify<br />
individual students<br />
Pacific Islander<br />
Math #<br />
ELA<br />
Tested Passing Tested Passing<br />
2005-06 17 4 24% 21 5 24%<br />
2006-07 11 8 73% 11 8 73%<br />
2007-08 6 * * 6 * *<br />
2008-09 14 7 50% 13 9 68%<br />
2009-10 0 * * 0 * *<br />
2010-11 6 * * 6 * *<br />
*Scores are not reported because it would be too easy to identify<br />
individual students<br />
Asian<br />
Math #<br />
ELA<br />
Tested Passing Tested Passing<br />
2005-06 46 27 59% 67 32 48%<br />
2006-07 40 32 80% 40 32 80%<br />
2007-08 37 33 89% 36 33 92%<br />
2008-09 38 33 87% 51 29 57%<br />
2009-10 25 23 92% 26 21 81%<br />
2010-11 33 28 85% 33 23 70%<br />
English Language Students<br />
Math #<br />
ELA<br />
Tested Passing Tested Passing<br />
2005-06 367 105 29% 426 104 24%<br />
2006-07 154 68 44% 155 46 30%<br />
2007-08 118 54 46% 119 37 31%<br />
2008-09 124 39 31% 124 16 13%<br />
2009-10 135 70 52% 139 52 37%<br />
2010-11 147 60 41% 152 48 32%<br />
Not Socio-Economically Disadvantaged<br />
Math #<br />
ELA<br />
Tested Passing Tested Passing<br />
2005-06 180 89 48% 175 101 58%<br />
2006-07 70 51 73% 69 52 75%<br />
2007-08 81 65 80% 81 67 83%<br />
2008-09 92 69 75% 93 71 76%<br />
2009-10 35 24 69% 34 26 76%<br />
2010-11 112 84 75 111 81 73%<br />
<strong>Appendix</strong> 201
Demographic Data<br />
ITEM G<br />
Redesignated Fluent-English Proficient<br />
Math #<br />
ELA<br />
Tested Passing Tested Passing<br />
2005-06 120 84 70% 106 90 85%<br />
2006-07 111 95 86% 111 96 86%<br />
2007-08 147 136 93% 147 137 93%<br />
2008-09 192 170 89% 191 164 86%<br />
2009-10 137 116 85% 137 130 95%<br />
2010-11 143 133 93% 141 135 96%<br />
Special Education<br />
Math #<br />
ELA<br />
Tested Passing Tested Passing<br />
2005-06 146 12 8% 137 14 10%<br />
2006-07 37 6 16% 37 8 22%<br />
2007-08 51 22 43% 52 19 37%<br />
2008-09 54 14 26% 54 17 31%<br />
2009-10 32 11 34% 34 14 41%<br />
2010-11 32 7 22% 33 10 30%<br />
<strong>Appendix</strong> 202
ITEM G<br />
Demographic Data<br />
ENROLLMENT IN UPPER LEVEL MATH AND SCIENCE CLASSES<br />
Year<br />
Interme<br />
d<br />
Algebra<br />
OVERALL<br />
Adv.<br />
Math<br />
1st Yr<br />
Chem<br />
1st Year<br />
Physics<br />
9-12<br />
Enroll<br />
2004-05 0 205 149 21 1509<br />
2005-06 129 72 198 32 1529<br />
2006-07 196 79 233 53 1562<br />
2007-08 209 111 245 61 1669<br />
2008-09 271 143 268 73 1730<br />
2009-10<br />
Upper-Level Science by Gender<br />
Year 1st-Year Chem 1st-Year Physics<br />
Male Female Male Female<br />
2004-05 91 58 11 10<br />
2005-06 113 85 18 14<br />
2006-07 129 104 3 20<br />
2007-08 118 127 35 26<br />
2008-09 146 122 34 39<br />
2009-10<br />
Upper-Level Science by Gender (%)<br />
Year 1st-Year Chem 1st-Year Physics<br />
Male Female Male Female<br />
2004-05 61.1% 38.9% 52.4% 47.6%<br />
2005-06 57.1% 42.9% 56.1% 43.9%<br />
2006-07 55.4% 44.4% 13.0% 87.0%<br />
2007-08 48.2% 51.8% 57.4% 42.3%<br />
2008-09 54.5% 46.5% 46.6% 53.4%<br />
2009-10<br />
Upper-Level Math by Gender<br />
Year Intermediate Advanced Math<br />
Algebra<br />
Male Female Male Female<br />
2004-05 61.1% 38.9% 52.4% 47.6%<br />
2005-06 57.1% 42.9% 56.1% 43.9%<br />
2006-07 55.4% 44.4% 13.0% 87.0%<br />
2007-08 48.2% 51.8% 57.4% 42.3%<br />
2008-09 54.5% 46.5% 46.6% 53.4%<br />
2009-10<br />
Upper-Level Math by Gender (%)<br />
Year Intermediate Advanced Math<br />
Algebra<br />
Male Female Male Female<br />
2004-05 0.0% 0.0% 53.7% 46.3%<br />
2005-06 58.1% 41.9% 59.7% 40.3%<br />
2006-07 52.6% 47.4% 62.0% 38.0%<br />
2007-08 54.1% 45.9% 52.3% 47.7%<br />
2008-09 54.6% 45.4% 54.5% 45.5%<br />
2009-10<br />
<strong>Appendix</strong> 203
Demographic Data<br />
ITEM G<br />
Upper-Level Math and Science 2004-05<br />
OVERFELT<br />
American<br />
Indian<br />
Intermed<br />
Algebra<br />
Adv.<br />
Math<br />
1st Yr<br />
Chem<br />
1st Year<br />
Physics<br />
0* 0 0 0<br />
Asian 0* 57 25 10<br />
Pacific<br />
Islander<br />
0* 3 3 0<br />
Filipino 0* 44 35 2<br />
Hispanic 0* 92 78 9<br />
African<br />
American<br />
0* 6 5 0<br />
White 0* 3 3 0<br />
Multiple/<br />
No Response<br />
0* 0 0 0<br />
Total 0 205 149 21<br />
* No students reported in Intermediate Algebra. They were<br />
probably included in the Advanced Math column.<br />
Upper-Level Math and Science 2004-05 (%)<br />
OVERFELT<br />
American<br />
Indian<br />
Intermed Adv. 1st Yr 1st Year<br />
Algebra Math Chem Physics<br />
0.0%* 0.0% 0.0% 0.0%<br />
Asian 0.0%* 27.8% 16.8% 47.6%<br />
Pacific<br />
Islander<br />
0.0%* 1.4% 2.0% 0.0%<br />
Filipino 0.0%* 21.5% 23.5% 9.5%<br />
Hispanic 0.0%* 44.9% 52.3% 42.9%<br />
African<br />
American<br />
White<br />
0.0%* 2.9% 3.4% 0.0%<br />
0.0%* 1.5% 2.0% 0.0%<br />
Multiple/ 0.0%* 0.0% 0.0% 0.0%<br />
No Response<br />
Total 0 205 149 21<br />
* No students reported in Intermediate Algebra. They were<br />
probably included in the Advanced Math column.<br />
Upper-Level Math and Science 2005-06<br />
OVERFELT<br />
American<br />
Indian<br />
Intermed<br />
Algebra<br />
Adv.<br />
Math<br />
1st Yr<br />
Chem<br />
1st Year<br />
Physics<br />
0 0 0 0<br />
Asian 24 25 28 11<br />
Pacific<br />
Islander<br />
3 0 3 1<br />
Filipino 28 14 37 6<br />
Hispanic 67 32 123 11<br />
African<br />
American<br />
3 0 4 1<br />
White 4 1 3 2<br />
Multiple/<br />
No Response<br />
0 0 0 0<br />
Total 129 72 198 32<br />
* No students reported in Intermediate Algebra. They were<br />
probably included in the Advanced Math column.<br />
Upper-Level Math and Science 2005-06 (%)<br />
OVERFELT<br />
American<br />
Indian<br />
Intermed<br />
Algebra<br />
Adv.<br />
Math<br />
1st Yr<br />
Chem<br />
1st Year<br />
Physics<br />
0.0% 0.0% 0.0% 0.0%<br />
Asian 18.7% 34.7% 14.1% 34.4%<br />
Pacific<br />
Islander<br />
2.3% 0.0% 1.5% 3.1%<br />
Filipino 21.7% 19.5% 18.8% 18.8%<br />
Hispanic 51.9% 44.4% 62.1% 34.4%<br />
African<br />
American<br />
2.3% 0.0% 2.0% 3.1%<br />
White 3.1% 1.4% 1.5% 6.2%<br />
Multiple/<br />
No Response<br />
0.0% 0.0% 0.0% 0.0%<br />
Total 129 72 198 32<br />
* No students reported in Intermediate Algebra. They were<br />
probably included in the Advanced Math column.<br />
<strong>Appendix</strong> 204
ITEM G<br />
Demographic Data<br />
Upper-Level Math and Science 2006-07<br />
Upper-Level Math and Science 2006-07(%)<br />
OVERFELT<br />
Intermed<br />
Algebra<br />
Adv.<br />
Math<br />
1st Yr<br />
Chem<br />
1st Year<br />
Physics<br />
OVERFELT<br />
Intermed<br />
Algebra<br />
Adv.<br />
Math<br />
1st Yr<br />
Chem<br />
1st Year<br />
Physics<br />
American<br />
Indian<br />
0 0 0 0<br />
American<br />
Indian<br />
0.0% 0.0% 0.0% 0.0%<br />
Asian 27 24 31 11<br />
Asian 13.8% 30.4% 13.3% 20.8%<br />
Pacific<br />
Islander<br />
2 0 4 0<br />
Pacific<br />
Islander<br />
1.0% 0.0% 1.7% 0.0%<br />
Filipino 43 19 35 14<br />
Hispanic 121 34 159 28<br />
Filipino 21.9% 24.1% 15.0% 26.4%<br />
Hispanic 61.8% 43.0% 68.2% 52.8%<br />
African<br />
American<br />
2 0 2 0<br />
African<br />
American<br />
1.0% 0.0% 0.9% 0.0%<br />
White 1 2 2 0<br />
Multiple/<br />
No Response<br />
0 0 0 0<br />
Total 196 79 233 53<br />
* No students reported in Intermediate Algebra. They were<br />
probably included in the Advanced Math column.<br />
White 0.5% 2.5% 0.9% 0.0%<br />
Multiple/<br />
No Response<br />
0.0% 0.0% 0.0% 0.0%<br />
Total 196 79 233 53<br />
* No students reported in Intermediate Algebra. They were<br />
probably included in the Advanced Math column.<br />
Upper-Level Math and Science 2007-08<br />
Upper-Level Math and Science 2007-08 (%)<br />
OVERFELT<br />
Intermed<br />
Algebra<br />
Adv.<br />
Math<br />
1st Yr<br />
Chem<br />
1st Year<br />
Physics<br />
OVERFELT<br />
Intermed<br />
Algebra<br />
Adv.<br />
Math<br />
1st Yr<br />
Chem<br />
1st Year<br />
Physics<br />
American<br />
Indian<br />
1 0 1 0<br />
American<br />
Indian<br />
0.5% 0.0% 0.4% 0.0%<br />
Asian 36 24 37 16<br />
Asian 17.1% 21.6% 15.1% 26.2%<br />
Pacific<br />
Islander<br />
1 1 5 0<br />
Pacific<br />
Islander<br />
0.5% 0.9% 2.0% 0.0%<br />
Filipino 25 29 33 12<br />
Hispanic 141 56 162 32<br />
Filipino 12.0% 26.1% 13.6% 19.7%<br />
Hispanic 67.5% 50.5% 66.1% 52.5%<br />
African<br />
American<br />
4 0 5 0<br />
African<br />
American<br />
1.9% 0.0% 2.0% 0.0%<br />
White 1 1 2 1<br />
Multiple/<br />
No Response<br />
0 0 0 0<br />
Total 209 111 245 61<br />
White 0.5% 0.9% 0.8% 1.6%<br />
Multiple/<br />
No Response<br />
0 0.0% 0.0% 0.0%<br />
Total 209 111 245 61<br />
<strong>Appendix</strong> 205
Demographic Data<br />
ITEM G<br />
Upper-Level Math and Science 2008-09<br />
Upper-Level Math and Science 2008-09 (%)<br />
OVERFELT<br />
Intermed<br />
Algebra<br />
Adv.<br />
Math<br />
1st Yr<br />
Chem<br />
1st Year<br />
Physics<br />
OVERFELT<br />
Intermed<br />
Algebra<br />
Adv.<br />
Math<br />
1st Yr<br />
Chem<br />
1st Year<br />
Physics<br />
American<br />
Indian<br />
1 0 0 0<br />
American<br />
Indian<br />
0.3% 0.0% 0.0% 0.0%<br />
Asian 31 38 31 17<br />
Asian 11.4% 26.6% 11.6% 23.3%<br />
Pacific<br />
Islander<br />
7 1 4 2<br />
Pacific<br />
Islander<br />
2.6% 0.7% 1.5% 2.7%<br />
Filipino 28 20 25 15<br />
Hispanic 196 82 201 37<br />
Filipino 10.3% 14.0% 9.3% 20.5%<br />
Hispanic 72.5% 57.3% 75.0% 50.7%<br />
African<br />
American<br />
7 1 6 1<br />
African<br />
American<br />
2.6% 0.7% 2.2% 1.4%<br />
White 1 1 1 1<br />
Multiple/<br />
No Response<br />
0 0 0 0<br />
Total 271 143 268 73<br />
* No students reported in Intermediate Algebra. They were<br />
probably included in the Advanced Math column.<br />
White 0.3% 0.7% 0.4% 1.4%<br />
Multiple/<br />
No Response<br />
0.0% 0.0% 0.0% 0.0%<br />
Total 271 143 268 73<br />
* No students reported in Intermediate Algebra. They were<br />
probably included in the Advanced Math column.<br />
<strong>Appendix</strong> 206
ITEM G<br />
Demographic Data<br />
American Indian<br />
Year<br />
Intermed Adv. 1st Yr 1st Year<br />
Algebra Math Chem Physics<br />
2004-05 0 0 0 0<br />
2005-06 10 0 0 0<br />
2006-07 0 0 0 0<br />
2007-08 1 0 1 0<br />
2008-09 1 0 0 0<br />
2009-10<br />
Pacific Islander<br />
Year<br />
Intermed Adv. 1st Yr 1st Year<br />
Algebra Math Chem Physics<br />
2004-05 0 3 3 0<br />
2005-06 3 0 3 1<br />
2006-07 2 0 4 0<br />
2007-08 1 1 5 0<br />
2008-09 7 1 4 2<br />
2009-10<br />
Asian<br />
Year<br />
Intermed Adv. 1st Yr 1st Year<br />
Algebra Math Chem Physics<br />
2004-05 0 57 25 10<br />
2005-06 24 25 28 11<br />
2006-07 27 24 31 11<br />
2007-08 36 24 37 16<br />
2008-09 31 38 31 15<br />
2009-10<br />
Filipino<br />
Year<br />
Intermed Adv. 1st Yr 1st Year<br />
Algebra Math Chem Physics<br />
2004-05 0 44 35 2<br />
2005-06 28 14 37 6<br />
2006-07 43 19 35 14<br />
2007-08 25 29 33 12<br />
2008-09 28 20 25 15<br />
2009-10<br />
Hispanic/Latino<br />
Year<br />
Intermed Adv. 1st Yr 1st Year<br />
Algebra Math Chem Physics<br />
2004-05 0 92 78 9<br />
2005-06 67 32 123 11<br />
2006-07 121 34 159 28<br />
2007-08 141 56 162 32<br />
2008-09 196 81 201 37<br />
2009-10 0 92 78 9<br />
African-American<br />
Year<br />
Intermed Adv. 1st Yr 1st Year<br />
Algebra Math Chem Physics<br />
2004-05 0 6 5 0<br />
2005-06 3 0 4 1<br />
2006-07 2 0 2 0<br />
2007-08 4 0 5 0<br />
2008-09 7 1 6 1<br />
2009-10<br />
White<br />
Year<br />
Intermed Adv. 1st Yr 1st Year<br />
Algebra Math Chem Physics<br />
2004-05 0 3 3 0<br />
2005-06 4 1 3 2<br />
2006-07 1 2 2 0<br />
2007-08 1 1 2 1<br />
2008-09 1 1 1 1<br />
2009-10<br />
Multiple or No Response<br />
Year<br />
Intermed Adv. 1st Yr 1st Year<br />
Algebra Math Chem Physics<br />
2004-05 0 0 0 0<br />
2005-06 0 0 0 0<br />
2006-07 0 0 0 0<br />
2007-08 0 0 0 0<br />
2008-09 0 0 0 0<br />
2009-10<br />
<strong>Appendix</strong> 207
Demographic Data<br />
ITEM G<br />
OTHER<br />
FREE & REDUCED LUNCH TOTALS<br />
OVERFELT 2005-06 2006-07 2007-08 2008-09 2009-10 2010-11<br />
Free/Reduced Lunches 854 873 1058 846 1103 1104<br />
CalWORKS 1509 1591 1627 1730 1619 1520<br />
Percent 56.6% 54.9% 65.0% 49.0% 68.1% 79.4%<br />
COMPUTER AVAILABILITY<br />
OVERFELT 2005-06 2006-07 2007-08 2008-09 2009-10 2010-11<br />
No. of Computers 450 450 300 301 301 506<br />
No. of Students per computer 3.4 3.5 5.6 5.7 5.8 3.0<br />
No. Classrooms with Internet 100 100 125 125 125 79<br />
NUMBER OF CLASSES BY SUBJECT AREA<br />
Year English Math Science Social<br />
Science<br />
Foreign<br />
Language<br />
AP Fine Arts Health<br />
P.E.<br />
05-06 70 57 33 33 14 7 21 21<br />
06-07 66 58 35 35 16 9 23 21<br />
07-08 83 74 43 34 16 10 20 26<br />
08-09 93 82 47 39 18 13 18 23<br />
09-10<br />
10-11 81 72 44 41 14 13 20 23<br />
SUSPENSIONS AND EXPULSION INFORMATION<br />
Year<br />
Suspensions<br />
Violence/Drugs<br />
Expulsion<br />
Violence/Drugs<br />
Total Suspensions Total<br />
Expulsions<br />
2004-05 50 6 594 7<br />
2005-06 3 2 5 2<br />
2006-07 17 3 21 3<br />
2007-08 86 2 697 2<br />
2008-09 85 5 481 5<br />
2009-10 74 3 676 3<br />
PUPIL TEACHER RATIO AND AVERAGE CLASS SIZE<br />
OVERFELT 2005-06 2006-07 2007-08 2008-09 2009-10 2010-11<br />
Pupil Teacher Ratio 21.9 22.0 21.8 21.1 21.6 21.1<br />
Average Class Size 27.8 28.2 26.4 25.5 25.6 25.7<br />
<strong>Appendix</strong> 208
ITEM G<br />
Demographic Data<br />
CLASS SIZE (ESUHSD)<br />
DEPARTMENT<br />
AVG. CLASS SIZE<br />
Art 29<br />
Band/Choir<br />
No Limit<br />
Business Education 29<br />
Drama<br />
No Limit<br />
English 30<br />
Foreign Language 29<br />
Freshman Orientation 35<br />
Health/Driver's Education 35<br />
Home Economics 29<br />
Language Arts 1 & 2 (ELL) 20<br />
Language Arts 3 (ELL) 25<br />
Mathematic 32<br />
Performing Arts 29<br />
Physical Education 42<br />
Reading 25<br />
Reading Improvement 20<br />
Safety Education 35<br />
Science 32<br />
Sheltered Core Classes 25<br />
Social Science 32<br />
<strong>Appendix</strong> 209
<strong>Appendix</strong> 210
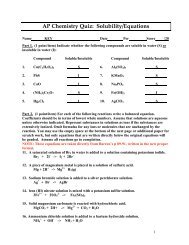
ITEM H<br />
GPA of 10th-12th Grade Students with 1 or More Referrals<br />
GPA of 10th -‐ 12th Grade Students with 1 or <br />
More Disciplinary Referrals <br />
2011-‐2012 <br />
6% <br />
22% <br />
34% <br />
0.0-‐.99 <br />
1.0-‐1.99 <br />
2.0-‐2.99 <br />
3.0 -‐ 4.0 <br />
38% <br />
1 <br />
<strong>Appendix</strong> 211
<strong>Appendix</strong> 212
ESUHSD Counseling Publication, September 2008<br />
<strong>Appendix</strong> 213<br />
COMMUNITY COLLEGE ADMISSION REQUIREMENTS<br />
1. Student must meet one of the following requirements:<br />
Earn a high school diploma.<br />
Pass the California <strong>High</strong> <strong>School</strong> Proficiency Exam.<br />
Pass the GED.<br />
Be 18 years of age or older.<br />
2. Students must take placement exams in Math and English.<br />
3. Students who plan to transfer from a community college to a 4-year<br />
college/university should take the UC a-g sequence of classes during high<br />
school.<br />
COLLEGE TESTING RECOMMENDATIONS<br />
Shown below is a recommendation of when students should take/re-take required<br />
college entrance exams.<br />
For UC/CSU - PSAT in October of the 11 th grade. Many students take the PSAT<br />
in the 10 th grade, also. The PSAT is excellent practice for the SAT Reasoning Test.<br />
For UC - SAT Reasoning Test or ACT Assessment plus Writing in the spring of<br />
11 th grade.<br />
For UC - SAT Reasoning Test or ACT Assessment plus Writing in the fall of 12 th<br />
grade.<br />
For UC - 2 SAT Subject Tests usually taken at the end of the year the subject area<br />
course is completed.<br />
For CSU - SAT Reasoning Test or ACT Assessment in the spring of 11th grade.<br />
For CSU - SAT Reasoning Test or ACT Assessment in the fall of 12 th grade.<br />
Useful Web Sites:<br />
CSU = www.csumentor.edu<br />
UC = www.universityofcalifornia.edu<br />
Community College = www.cccco.edu<br />
College Board = www.collegeboard.com<br />
ACT = www.actstudent.org<br />
AP = www.apcentral.collegeboard.com<br />
SAT = www.collegeboard.com/student/testing/sat/reg.html<br />
EAP/CSU = www.calstate.edu/eap<br />
East Side Union <strong>High</strong> <strong>School</strong> District = www.esuhsd.org<br />
Fast Web (Scholarship Site) = www.fastweb.com<br />
Federal Student Aid (FAFSA) = www.fafsa.ed.gov<br />
Fin Aid = www.finaid.org<br />
Scholarships.com = www.scholarships.com<br />
U.S. Dept. of Education = www.ed.gov/students<br />
East Side Union <strong>High</strong> <strong>School</strong> District<br />
Graduation and College Entrance Requirements<br />
ESUHSD HIGH SCHOOL GRADUATION REQUIREMENTS<br />
In order to earn a diploma from the East Side Union <strong>High</strong> <strong>School</strong> District, students<br />
must: (1) pass the California <strong>High</strong> <strong>School</strong> Exit Exam, and (2) pass 220 credits in<br />
the areas shown below.<br />
Subject 1 year of World History<br />
1 semester of Economics<br />
1 semester of American Government<br />
Geometry or Integrated Math 2<br />
(or higher level courses)<br />
that satisfies the University of<br />
California a-g course sequence<br />
( 1 year must be taken in grade 9)<br />
Students must pass elective courses<br />
chosen in the following areas: Art,<br />
Business, Home Economics Careers and<br />
Math, Music, Industrial Technology<br />
Education, P.E., Reading, Science, Social<br />
Science, Safety Education, and Work<br />
Experience/ CCOC/ROP.<br />
Requirement Credits<br />
English<br />
Students must pass:<br />
4 years of English 40<br />
Students must pass:<br />
Social Science 1 year of United States History<br />
30<br />
Mathematics Students must pass:<br />
Algebra 1 or Integrated Math 1<br />
20<br />
Science<br />
Students must pass:<br />
2 years of college prep lab science 20<br />
Fine Arts or<br />
Students must pass:<br />
1-year course in Fine Arts or<br />
10<br />
Foreign Language Foreign Language<br />
Physical Education Students must pass:<br />
2 years of Physical Education<br />
20<br />
Electives<br />
Technology, English, Foreign Language, 80<br />
Total Credits Required for Graduation 220
UNIVERSITY OF CALIFORNIA ADMISSION REQUIREMENTS<br />
UC Subject Requirement<br />
Students must complete 15 units of high school courses to fulfill the UC Subject<br />
Requirement. This sequence of courses is known as the UC a-g requirement. At least<br />
7 of the 15 units must be taken in the last 2 years of high school (a unit is equal to an<br />
academic year, or 2 semesters, of study).<br />
<strong>Appendix</strong> 214<br />
a. History/Social Science—2 years required<br />
Two years of history/social science, including one year of world history, cultures<br />
and geography: and one year of U.S. history or one-half year of U.S. history and<br />
one-half year of civics or American government.<br />
b. English—4 years required<br />
Four years of college preparatory English that include frequent and regular writing,<br />
and reading of classic and modern literature. No more than one year of ESL-type<br />
courses can be used to meet this requirement.<br />
c. Mathematics—3 years required; 4 years recommended<br />
Three years of college preparatory mathematics that include the topics covered in<br />
elementary and advanced algebra and two- and three-dimensional geometry.<br />
Approved integrated math courses may be used to fulfill part or all of this<br />
requirement, as may math courses taken in the seventh and eighth grades that your<br />
high school accepts as equivalent to its own math courses.<br />
d. Laboratory Science—2 years required; 3 years recommended<br />
Two years of laboratory science providing fundamental knowledge in at least two<br />
of these three core disciplines: biology, chemistry, and physics. Advance<br />
laboratory science courses that have biology, chemistry or physics as prerequisites<br />
and offer substantial additional material may be used to fulfill this requirement. The<br />
final two years of an approved three-year integrated science program may be used to<br />
fulfill this requirement.<br />
e. Language other than English—2 years required; 3 years recommended<br />
Two years of the same language other than English. Courses should emphasize<br />
speaking and understanding, and include instruction in grammar, vocabulary,<br />
reading, and composition. Courses in language other than English taken in the<br />
seventh and eighth grade may be used to fulfill part of this requirement if your high<br />
school accepts them as equivalent to its own courses.<br />
f. Visual and Performing Arts (VPA)—1 year required<br />
One year of visual and performing arts chosen from the following: dance,<br />
drama/theater, music and/or visual art.<br />
g. College Preparatory Electives—1 year required.<br />
One year (two semesters), in addition to those required in “a-f” courses above,<br />
chosen from the following areas: visual and performing arts (non-introductory<br />
level courses), history, social science, English, advanced mathematics, laboratory<br />
science, and language other than English (a third year in the language used for the<br />
“e” requirement or two years of another language).<br />
UC Examination Requirement<br />
Freshmen must submit the following test scores:<br />
The ACT Assessment plus Writing or the SAT Reasoning Test. The verbal,<br />
mathematics and writing scores on the SAT must be from the same sitting.<br />
Students who take the ACT must report each test score and the composite<br />
score.<br />
Two SAT Subject Tests in two different areas, chosen from the following:<br />
history, literature, mathematics (Level 2 only), science or language other than<br />
English.<br />
Students applying for admission to the fall term must take these tests no later than<br />
December of their senior year, preferably earlier, to ensure that their application<br />
receives prompt and full consideration.<br />
CALIFORNIA STATE UNIVERSITY ADMISSION REQUIREMENTS<br />
CSU Course Requirement<br />
The California State University System (CSU) requires students to complete 15 units<br />
of college preparatory courses with a grade of 'C' or better (1 unit is equal to 1 year).<br />
a. History/Social Science—2 years required<br />
Two years of history/social science, including one year of world history or 1<br />
semester of U.S. History or 1 semester of American Government: and 1 year of<br />
history/social science from either the "a" or "g" subject areas.<br />
b. English—4 years required<br />
no more than 1 year of advanced ESL/ELD courses can be used<br />
c. Mathematics—3 years required<br />
Algebra 1, Algebra 2, Geometry<br />
d. Science—2 years required<br />
1 year of physical science and 1 year of biological science must be completed, one<br />
of which must be from the "d" subject area and the other from either "d" or "g"<br />
subject area<br />
e. Foreign Language— 2 years required<br />
2 years of language other than English (must be the same language)<br />
f. Visual and Performing Arts— 1 year required<br />
1 yearlong course in visual and performing arts (selected from dance, music,<br />
theater/drama, or visual arts)<br />
g. College Prep Electives— 1 year required<br />
1 year elective chosen from any areas on approved "a-g" course list<br />
Agriculture courses traditionally accepted by CSU that are not on the "a-g" list will<br />
be considered on a course-by-course basis.<br />
CSU Examination Requirement (students may take either test):<br />
ACT Assessment<br />
SAT Reasoning Test
<strong>School</strong> Fact Sheet, 2008–2009<br />
EAST SIDE UNION HIGH SCHOOL DISTRICT<br />
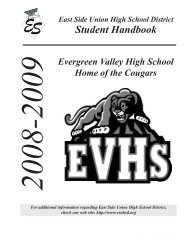
<strong>William</strong> C. <strong>Overfelt</strong> <strong>High</strong> <strong>School</strong><br />
ADDRESS: 1835 Cunningham Ave., San Jose, CA 95122 PHONE: (408) 347-5900<br />
PRINCIPAL: Vito Chiala GRADE RANGE: 9–12 SCHEDULE: Traditional<br />
TEACHERS AND STUDENTS<br />
Teachers<br />
KEY FACTOR<br />
OUR<br />
SCHOOL<br />
COUNTY<br />
AVG<br />
STATE<br />
AVG<br />
Number of teachers (FTE) 84 57 47<br />
Students per teacher 21 22 23<br />
Average years of teaching 12 13 13<br />
experience<br />
Teachers with one or two 18% 13% 12%<br />
years of teaching experience<br />
Full credential holders 79% 92% 94%<br />
Trainee credential holders 12% 6% 5%<br />
Emergency permit holders 11% 4% 3%<br />
SOURCE: 2008 CBEDS data, California Dept. of Education. County and state averages represent high<br />
schools only. Because teachers can hold more than one type of credential, percentages rarely add up<br />
to 100 percent.<br />
Our teachers bring an average of 12 years of teaching<br />
experience to their classes. About 79 percent have a full<br />
credential. Statewide about 94 percent of high school teachers<br />
hold this credential.<br />
Average Class Sizes<br />
CORE COURSE<br />
OUR<br />
SCHOOL<br />
COUNTY<br />
AVG<br />
STATE<br />
AVG<br />
English 24 25 25<br />
History/social science 29 28 29<br />
Math 25 26 27<br />
Science 29 28 28<br />
SOURCE: 2008 CBEDS data, California Dept. of Education. County and state averages represent high<br />
schools only.<br />
The average class size of core courses varies at our school from a<br />
low of 24 students to a high of 29 students. Our average class<br />
size for all classes schoolwide is 27 students. The average class<br />
size schoolwide for other high schools in the state is 28<br />
students.<br />
Students<br />
KEY FACTOR<br />
OUR<br />
SCHOOL<br />
COUNTY<br />
AVG<br />
STATE<br />
AVG<br />
Number of students 1,730 1,260 1,082<br />
English Learners 27% 14% 15%<br />
Low-income students 61% 32% 46%<br />
Students whose parents<br />
attended/graduated college<br />
21% 67% 56%<br />
SOURCE: 2008 CBEDS data, California Dept. of Education. County and state averages represent high<br />
schools only.<br />
The factors above may affect students’ performance in school.<br />
COLLEGE PREPARATION<br />
Three factors indicate how effectively we prepare students for<br />
college: whether students are taking the courses required for<br />
college admission, whether the school offers Advanced<br />
Placement (AP) courses, and where students ultimately enroll in<br />
the state’s public college system.<br />
KEY FACTOR<br />
2008 graduates meeting UC<br />
or CSU course requirements<br />
AP exams passed per 100<br />
juniors and seniors (2008)<br />
2007 graduates<br />
attending UC<br />
2007 graduates<br />
attending CSU<br />
2007 graduates attending<br />
community colleges<br />
OUR<br />
SCHOOL<br />
COUNTY<br />
AVG<br />
STATE<br />
AVG<br />
25% 50% 36%<br />
18 47 27<br />
3% 15% 8%<br />
12% 14% 13%<br />
4% 7% 30%<br />
SOURCE: 2008 CBEDS data, California Dept. of Education. California Postsecondary Education<br />
Commission. County and state averages represent high schools only.<br />
Information in this report changes throughout the year. A<br />
complete annual accountability report is available from our<br />
school or district office, and on our district Web site:<br />
http://www.esuhsd.org/<br />
Published By <strong>School</strong> Wise Press<br />
www.schoolwisepress.com © 2009 by Publishing 20/20<br />
rev20090918_43-69427-4335428/23799<br />
ACADEMIC PERFORMANCE<br />
California Standards Tests<br />
This series of tests is based on what California students are<br />
expected to know and learn at each grade level.<br />
Student Proficiency<br />
SUBJECT<br />
PERCENT<br />
PROFICIENT<br />
OR HIGHER LOW SCORES HIGH SCORES<br />
English/Language Arts (Reading and Writing)<br />
Our school 30%<br />
Calif. high schools 46%<br />
Geometry<br />
Our school 13%<br />
Calif. high schools 24%<br />
US History<br />
Our school 27%<br />
Calif. high schools 47%<br />
Biology<br />
Our school 20%<br />
Calif. high schools 42%<br />
Life Science (Tenth Grade)<br />
Our school 28%<br />
Calif. high schools 45%<br />
SOURCE: The scores for the California Standards Tests are from the spring 2009 test cycle. State<br />
averages represent high schools only.<br />
MEASURES OF ACADEMIC PROGRESS<br />
ACADEMIC PERFORMANCE INDEX (API): This is California’s<br />
way of rating schools. Using student test scores, the API places<br />
schools on a scale from 200 to 1000. Our school’s API was 655,<br />
compared with 712 for the average high school. The state<br />
expects schools to attain an API of 800 eventually.<br />
ADEQUATE YEARLY PROGRESS (AYP): This is a federal<br />
measure that requires schools to meet test score goals<br />
schoolwide and for all subgroups ∗ of students. We met 11 out<br />
of 18 criteria for yearly progress. Because we fell short in seven<br />
areas, we did not make AYP. Note that the number of criteria<br />
may vary from school to school.<br />
CALIFORNIA<br />
API<br />
ACADEMIC PERFORMANCE INDEX<br />
FEDERAL<br />
AYP<br />
ADEQUATE YEARLY PROGRESS<br />
Met schoolwide<br />
growth target No Met AYP No<br />
Met growth target for<br />
prior school year<br />
Yes<br />
API 655<br />
Growth attained from<br />
prior year +0<br />
Met subgroup *<br />
growth targets<br />
No<br />
Met schoolwide test<br />
participation rate<br />
Met schoolwide test<br />
score goals<br />
Met subgroup * test<br />
participation rate<br />
Met subgroup * test<br />
score goals<br />
Met API for AYP<br />
Met graduation rate<br />
Program Improvement<br />
school<br />
Yes<br />
No<br />
Yes<br />
No<br />
Yes<br />
Yes<br />
Yes<br />
SOURCE: API growth score, 2009 test cycle. API and AYP current as of September 2009.<br />
∗ Numerically significant groups, such as English Learners and ethnic groups, with separate API and<br />
AYP goals.<br />
N/A Data unavailable or unreported; statistically insignificant number of valid test scores; testing<br />
data under review; or school uses alternative accountability measures.<br />
<strong>Appendix</strong> 215
<strong>Appendix</strong> 216
The Single Plan for Student Achievement<br />
__<strong>William</strong> C. <strong>Overfelt</strong> <strong>High</strong> <strong>School</strong>___ SCHOOL<br />
_43 69427 4335428__<br />
CDS Code<br />
Date of this revision: _April 6, 2011<br />
The Single Plan for Student Achievement (SPSA) is a plan of actions to raise the academic<br />
performance of all students to the level of performance goals established under the California<br />
Academic Performance Index. California Education Code sections 41507, 41572, and 64001<br />
and the federal No Child Left Behind Act (NCLB) require each school to consolidate all school<br />
plans for programs funded through the <strong>School</strong> and Library Improvement Block Grant, the Pupil<br />
Retention Block Grant, the Consolidated Application, and NCLB Program Improvement into the<br />
Single Plan for Student Achievement.<br />
For additional information on school programs and how you may become involved locally,<br />
please contact the following person:<br />
Contact Person: Vito Chiala<br />
Position: Principal<br />
Telephone Number: 408-347-5910<br />
Address: 1835 Cunningham Ave, San Jose, CA. 95122<br />
E-mail Address: chialav@esuhsd.org<br />
___East Side Union <strong>High</strong> <strong>School</strong> District_________<strong>School</strong> District<br />
The District Governing Board approved this revision of the <strong>School</strong> Plan on __4/6/11____.<br />
Template for the Single Plan for Student Achievement<br />
<strong>Appendix</strong> 217
Form A: Planned Improvements in Student Performance<br />
The school site council has analyzed student academic performance and has considered the effectiveness of key elements of the instructional program for<br />
students failing to meet API and AYP growth targets. As a result, it has adopted the following school goals, related actions, and expenditures to raise the<br />
academic performance of student groups not meeting state standards:<br />
SCHOOL GOAL # 1. Increase the percentage of students reading and writing at or above grade level each year as<br />
indicated by multiple data measures including CST and CAHSEE.<br />
Student groups and grade levels to participate in this goal:<br />
All 9th and 10 th graders, with special emphasis on students in<br />
the following categories:<br />
• Latino<br />
• English Language Learners<br />
• Socioeconomically Disadvantaged<br />
• Students with Disabilities<br />
Anticipated annual performance growth for each group:<br />
• Meet API and AYP targets for ELA schoolwide and in<br />
each subgroup<br />
• Increase CAHSEE pass rate at the 10 th grade level to<br />
75% in 2012.<br />
o Total 2006: 64%; 2010: 72% Goal 2012: 75%<br />
o SPED 2006: 12%; 2010: 41% Goal 2012: 46%<br />
• Increase CAHSEE proficiency rate in ELA schoolwide<br />
to 75% in 2012 (42% in 2010)<br />
o Latino 2010: 39%; Goal 2012: 75% Proficient<br />
o ELL 2010: 22%; Goal 2012: 75%<br />
o Socio-economically Disadvantaged: 40%; Goal<br />
2012: 75%<br />
• Increase CST percent proficient and advanced for ELA<br />
by 10% at each grade level.<br />
<strong>Appendix</strong> 218
Means of evaluating progress toward this goal:<br />
• Progress on state assessments which include proficiency rate on<br />
CSTs schoolwide and for each subgroup, participation and<br />
proficiency rate on CAHSEE census<br />
• Evidence of placing students in benchmark (core), strategic, and<br />
intensive classes based on multiple assessment criteria to target<br />
needed support<br />
• Read 180 for all intensive 9 th and 10 th special needs and regular ed<br />
students.<br />
• Comparison of 2011 -2012 census data for the CAHSEE (ELA)<br />
• Support classes at the 9 th and 10 th grade level<br />
• Evidence of teachers use of pacing guides in 9 th and 10 th grade ELA<br />
• Enrollment of teachers participating in SB 472 training<br />
• Monitoring of the use of collaboration periods to analyze data and<br />
inform instruction<br />
• Classroom Observations<br />
Actions to be Taken to Reach This Goal 1<br />
Consider all appropriate dimensions<br />
Start Date 2<br />
Completion Date<br />
Group data to be collected to measure academic gains:<br />
• CAHSEE Census data<br />
• Percent proficient rate on CST and CAHSEE census by schoolwide<br />
and subgroups<br />
• Master schedule indicating placement in benchmark (core),<br />
strategic, and intensive.<br />
• Analysis of curriculum embedded assessments<br />
• Examine lesson plans for coordination with pacing guides<br />
• Examine collaboration period agendas and minutes<br />
• Number of teachers completing SB 472, 1 st segment<br />
• Examine walk-through observation data<br />
Proposed Expenditures 3 Estimated<br />
Cost<br />
Funding<br />
Source<br />
1. 9 th grade intensive literacy intervention.<br />
a. LA3/9 + Read 180 for English<br />
Intensive students.<br />
b. English 1/9 + Support for English<br />
Strategic students with reading<br />
support component.<br />
c. FOG/AVID integrated literacy<br />
program<br />
August, 2011 Counseling<br />
.2 Technology Mentor<br />
Professional Development,<br />
Read 180, and ELA Support<br />
Literacy Materials, SSR,<br />
Accelerated Reader, <strong>School</strong><br />
$25,508<br />
$20,000<br />
$32,720<br />
PI, EIA,<br />
Title 1<br />
CAPP<br />
PI, EIA,<br />
Title 1<br />
<strong>Appendix</strong> 219
2. SPED:<br />
a. SDC English Blocks<br />
b. Read 180 for intensive students<br />
c. Collaboration between SDC and<br />
mainstream Read 180.<br />
d. Accommodations for 10 th<br />
Modifications for 11 th and 12 th<br />
3. 10 th Grade<br />
a. Implement district PI plan for 10 th<br />
grade intervention.<br />
4. <strong>School</strong>wide Literacy<br />
a. Teacher Leader Plan and Organize<br />
b. Collaboration – meet regularly to<br />
analyze data to inform instruction.<br />
c. Professional Development: SB 472<br />
for all English Teachers<br />
d. Benchmark assessments and data.<br />
Continue to implement benchmark<br />
assessments.<br />
e. Professional development with<br />
Academic Language for all<br />
teachers<br />
f. Library support for AR, GALE,<br />
Perfect Copy, and other literacy<br />
strategies.<br />
g. Routine classroom observations<br />
and walk-throughs.<br />
August, 2011<br />
August, 2011<br />
August, 2011<br />
June, 2011<br />
August, 2011<br />
June-August, 2011<br />
August 2011<br />
Loop, Reproduction<br />
Data Support and Professional<br />
Development<br />
$10,000<br />
$5,693<br />
PI, EIA,<br />
Title 1<br />
PI, EIA,<br />
Title 1<br />
<strong>Appendix</strong> 220
Form A: Planned Improvements in Student Performance<br />
The school site council has analyzed student academic performance and has considered the effectiveness of key elements of the instructional program for<br />
students failing to meet API and AYP growth targets. As a result, it has adopted the following school goals, related actions, and expenditures to raise the<br />
academic performance of student groups not meeting state standards:<br />
SCHOOL GOAL # 2. Improve the achievement of ninth and tenth grade students in Algebra 1 and increase the pass and<br />
proficiency rate on the math section of the California <strong>High</strong> <strong>School</strong> Exit Exam for all 10th grade students each year.<br />
Student groups and grade levels to participate in this goal:<br />
All 9th and 10 th graders, with special emphasis on students in<br />
the following categories:<br />
• Latino<br />
• English Language Learners<br />
• Socioeconomically Disadvantaged<br />
• Students with Disabilities<br />
Anticipated annual performance growth for each group:<br />
• Meet API and AYP targets for math schoolwide and in<br />
each subgroup<br />
• Increase CAHSEE pass rate at the 10 th grade level to<br />
75% in 2012.<br />
o <strong>School</strong>wide 10 th : 2010: 69%; Goal 2012: 75%<br />
o SPED 10 th 2010: 34%; Goal 2012: 40%<br />
o ELL 10 th : 2010: 52%; Goal 2012: 60%<br />
• Increase CAHSEE proficiency rate in math schoolwide<br />
to 75% in 2012.<br />
o <strong>School</strong>wide 10 th : 2010: 39%; Goal 2012: 75%<br />
o Latino 2010: 34%; Goal 2012: 75% Proficient<br />
o ELL 2010: 28%; Goal 2012:75%<br />
o Socio-economically Disadvantaged: 24%; Goal<br />
2012: 75%<br />
• Increase CST percent proficient and advanced for 9 th<br />
and 10 th graders in Algebra by 10%<br />
<strong>Appendix</strong> 221
Means of evaluating progress toward this goal:<br />
• Progress on state assessments which include proficiency rate on<br />
CSTs schoolwide and for each subgroup, participation and<br />
proficiency rate on CAHSEE census<br />
• Evidence of placing students in benchmark (core), strategic, and<br />
intensive classes based on multiple assessment criteria to target<br />
needed support<br />
• Comparison of 2011 -2012 census data for the CAHSEE (math)<br />
• Algebra Support classes at the 9 th and 10 th grade level<br />
• Enrollment of teachers participating in SB 472 training<br />
• Monitoring of the use of collaboration periods to analyze data and<br />
inform instruction<br />
• Classroom walk-through observation data<br />
Group data to be collected to measure academic gains:<br />
• CAHSEE Census data<br />
• Percent proficient rate on CST and CAHSEE census by schoolwide<br />
and subgroups<br />
• Master schedule indicating placement in benchmark (core),<br />
strategic, and intensive.<br />
• Analysis of curriculum embedded assessments<br />
• Examine lesson plans for coordination with pacing guides<br />
• Examine collaboration period agendas and minutes<br />
• Number of teachers completing SB 472, 1 st segment<br />
• Classroom walk-through observation data<br />
Actions to be Taken to Reach This Goal 1<br />
Consider all appropriate dimensions<br />
Start Date 2<br />
Completion Date<br />
Proposed Expenditures 3 Estimated<br />
Cost<br />
Funding<br />
Source<br />
1. 9 th and 10 th Grade Intervention Plan<br />
a. Strategic: Algebra with support<br />
class – same teacher<br />
b. Intensive: Algebra + support class<br />
– same teacher<br />
c. Focus on CAHSEE skills in 10 th<br />
grade support class<br />
August, 2011<br />
Professional Development<br />
and support<br />
Counseling<br />
$9,268<br />
$25,508<br />
PI, EIA,<br />
Title 1<br />
PI, EIA,<br />
Title 1<br />
2. SPED: Math Support for 9 th and 10 th<br />
3. Professional Development<br />
August, 2011<br />
June-August, 2011<br />
Math program Support<br />
$14,195<br />
PI, EIA,<br />
Title 1<br />
<strong>Appendix</strong> 222
a. SB472 Math Training all teachers<br />
b. Instruction and Curriculum (GRR)<br />
c. Increase and maximize use of text<br />
book.<br />
d. Collaboration – teachers meet<br />
regularly to use data to guide<br />
instruction.<br />
e. Continue to implement curriculum<br />
embedded common assessments.<br />
4. Regular walk-through observations August, 2011<br />
<strong>Appendix</strong> 223
Form A: Planned Improvements in Student Performance<br />
The school site council has analyzed student academic performance and has considered the effectiveness of key elements of the instructional program for<br />
students failing to meet API and AYP growth targets. As a result, it has adopted the following school goals, related actions, and expenditures to raise the<br />
academic performance of student groups not meeting state standards:<br />
SCHOOL GOAL # 3. Improve the success rates of all students with a focus on our most reluctant learners defined by multiple<br />
measures including grades, GPA, discipline, and attendance.<br />
Student groups and grade levels to participate in this goal:<br />
All students with special emphasis on students in the following<br />
categories:<br />
• Students failing two or more classes.<br />
• Latino<br />
• English Language Learners<br />
• Socioeconomically Disadvantaged<br />
• Students with Disabilities<br />
Anticipated annual performance growth for each group:<br />
• Increase percentage of students passing all classes to<br />
75% schoolwide with no class less than 60%.<br />
• Increase the percentage of students earning all grades of<br />
C or better to 50%.<br />
• Increase <strong>School</strong>wide GPA to 2.5 schoolwide with no<br />
grade level less than 2.0.<br />
• Increase schoolwide attendance to 95%.<br />
Means of evaluating progress toward this goal:<br />
• Grade distributions every six weeks<br />
• 6 week GPA<br />
• Student Grades<br />
• Monitor ADA<br />
• Identify at-risk students every six weeks<br />
Group data to be collected to measure academic gains:<br />
• Grade distributions every six weeks<br />
• 6 week GPA<br />
• Student Grades<br />
<strong>Appendix</strong> 224
Actions to be Taken to Reach This Goal 1<br />
Consider all appropriate dimensions<br />
• Regular Counseling Intervention for students<br />
who earn F’s. Include parents.<br />
• <strong>School</strong> Loop Target Student Groups<br />
• Attendance intervention: START Saturday<br />
<strong>School</strong><br />
• Small Learning Community – <strong>School</strong>wide<br />
Implementation<br />
• Link Crew peer mentoring<br />
• Before and after school tutoring in the library.<br />
• YWCA Project Inspire after school program<br />
• Parent Conferencing Plan<br />
• CSI – summer bridge<br />
• <strong>School</strong>wide and targeted Professional<br />
Development to address the high percentage<br />
of failing students.<br />
• Professional development to support<br />
implementation of benchmarks and data<br />
• Multi Service Team to provide student<br />
support.<br />
• Weekly Collaboration<br />
• ISP Opportunity Classes for 9 th and 10 th<br />
• Substitute Support Plan<br />
Start Date 2<br />
Completion Date<br />
June 2011-June<br />
2012<br />
August 2011 – June<br />
2012<br />
August 2011 – June<br />
2012<br />
August 2011 – June<br />
2012<br />
August 2011 – June<br />
2012<br />
August 2011 – June<br />
2012<br />
August 2011 – June<br />
2012<br />
August 2011 – June<br />
2012<br />
August 2011 – June<br />
2012<br />
August 2011 – June<br />
2012<br />
August 2011 – June<br />
2012<br />
Proposed Expenditures 3 Estimated<br />
Cost<br />
Counseling<br />
$25,508<br />
1.0 SLC Coordinator<br />
$125,000<br />
Professional Development<br />
$10,000<br />
At Risk Support<br />
$25,217<br />
Parent Support<br />
$17,875<br />
Funding<br />
Source<br />
PI, EIA,<br />
Title 1<br />
SLC<br />
PI, EIA,<br />
Title 1<br />
PI, EIA,<br />
Title 1<br />
PI, EIA,<br />
Title 1<br />
<strong>Appendix</strong> 225
Form A: Planned Improvements in Student Performance<br />
The school site council has analyzed student academic performance and has considered the effectiveness of key elements of the instructional program for<br />
students failing to meet API and AYP growth targets. As a result, it has adopted the following school goals, related actions, and expenditures to raise the<br />
academic performance of student groups not meeting state standards:<br />
SCHOOL GOAL # 4. Increase the preparedness of our highest achieving students for success at the university level during the<br />
2011-12 school year.<br />
Student groups and grade levels to participate in this goal:<br />
All students with special emphasis on students in the following<br />
categories:<br />
• Latino<br />
• English Language Learners<br />
• Socioeconomically Disadvantaged<br />
• Students with Disabilities<br />
Anticipated annual performance growth for each group:<br />
• Increase the percentage of underrepresented students<br />
prepared for admission to four year university by 10%.<br />
• Maintain the number of AP test takers to 500 while<br />
increasing to a 60% pass rate.<br />
• Increase the percentage of students taking the EAP in<br />
math and English to 90% and the number passing to<br />
100.<br />
• Increase the percentage taking the SAT or ACT by<br />
10%.<br />
• Increase the percentage taking the PSAT by 10%.<br />
• Increase the average score on the SAT or ACT at<br />
<strong>Overfelt</strong> to within 5% of the national average.<br />
<strong>Appendix</strong> 226
Means of evaluating progress toward this goal:<br />
• SAT/ACT Scores<br />
• PSAT Scores<br />
• AP Enrollment<br />
• AP Pass Rates<br />
• Number/Percentage of applicants<br />
• EAP/ELM success rates<br />
• % Students meeting A-G requirements<br />
• Membership in NHS, CSF, MESA<br />
• Success rates for programs: Puente, AVID, Advanced<br />
• Participation in Pre-college Programs<br />
• Number of students taking concurrent community college courses<br />
Group data to be collected to measure academic gains:<br />
• SAT/ACT Scores<br />
• PSAT Scores<br />
• AP Enrollment; AP Pass Rates<br />
• Number/Percentage of applicants to four year University<br />
• EAP/ELM success rates<br />
• % Students meeting A-G requirements<br />
• Membership in NHS, CSF, MESA<br />
• Success rates for programs: Puente, AVID, Advanced<br />
• Participation in Pre-college Programs<br />
• GATE student performance and achievement<br />
Actions to be Taken to Reach This Goal 1<br />
Consider all appropriate dimensions<br />
Counselor visits and intervention<br />
Support academic programs (AVID and Puente)<br />
Start Date 2<br />
Completion Date<br />
8/2011 – 6/2012<br />
8/2011 – 6/2012<br />
Proposed Expenditures 3 Estimated<br />
Cost<br />
Counseling<br />
$25,508<br />
Funding<br />
Source<br />
PI, EIA,<br />
Title 1<br />
Professional Development EAP, AP, UC A-G, Grade<br />
Lesson, New Teacher support, questioning<br />
strategies…<br />
AP and Pre-AP courses<br />
Parent Information<br />
Encourage and promote PSAT, SAT, ACT, EAP<br />
8/2011 – 6/2012<br />
8/2011 – 6/2012<br />
8/2011 – 6/2012<br />
8/2011 – 6/2012<br />
Social Science Support<br />
Science Support<br />
Academic Program Support<br />
$2,379<br />
$2,160<br />
$10,000<br />
PI, EIA,<br />
Title 1<br />
PI, EIA,<br />
Title 1<br />
PI, EIA,<br />
Title 1<br />
<strong>Appendix</strong> 227
(Focus on math as well as English).<br />
Incorporate EAP preparation in curriculum in English<br />
and math.<br />
Support CSF, NHS, MESA<br />
8/2011 – 6/2012<br />
8/2011 – 6/2012<br />
8/2011 – 6/2012<br />
<strong>Appendix</strong> 228
Form B: Centralized Support for Planned Improvements in Student Performance<br />
The school site council has analyzed the planned program improvements and has adopted the following program support goals, related actions,<br />
and expenditures to raise the academic performance of student groups not meeting state standards:<br />
PROGRAM SUPPORT GOAL:<br />
ESUHSD will raise the achievement for all students in English Language Arts and Mathematics and reduce the racial predictability and<br />
disproportionality of which student populations occupy the highest and lowest achievement levels.(Achievement Gap)<br />
Groups and grade levels participating in this goal:<br />
1. ELA and Math students grades 9-12<br />
2. All NCLB sub-groups<br />
Anticipated annual performance growth for each group:<br />
• District percent proficient in ELA and mathematics will increase<br />
by 10% as measured by 2009-10 AYP.<br />
• Each district subgroup will meet the minimum NCLB AMO<br />
targets and /or increase percentage proficient performance by at<br />
least 5% in ELA and mathematics –‘ 09-’10.<br />
Means of evaluating progress toward this goal:<br />
1. Evaluation of school and district-wide AYP performance targets<br />
2. Monitor participation rate for CAHSEE<br />
3. Graduation rate<br />
4. Progress towards API subgroup targets<br />
5. Analysis of ELA and Math curriculum imbedded assessments<br />
6. Analysis of ELD common assessments<br />
7. Review of collaborative time process focused on the Formative<br />
Assessment Protocol.<br />
8. Enrollment in AB 430, administrator training program, SB 472<br />
teacher training in core and or state board of education adopted ELA<br />
9. Monitor implementation of effective intervention curriculum<br />
10. Enrollment in EL Academic Language Training.<br />
Group data to be collected to measure gains:<br />
1. CAHSEE proficiency rate<br />
2. CAHSEE participation rate by subgroup<br />
3. Student data indicating progress towards graduation requirements<br />
4. CST % of proficiency in ELA and Math by subgroup<br />
5. Semester 1 and Semester 2 proficiency rates<br />
6. Pre and post benchmark assessments for ELD 1, 2, & 3<br />
7. Summary of evidence by departments and schools of the monthly<br />
formative assessment collaborations.<br />
8. Completion rate: attendance sheets AB 430 and SB 472<br />
9. Curriculum imbedded assessments of ELA and Math CAHSEE<br />
intervention/support classes quarterly.<br />
10. Number of teachers by site participating in the EL Academic<br />
Language Trainings.<br />
Actions to be Taken to Reach this Goal 35<br />
Consider all appropriate dimensions (e.g., Teaching<br />
And Learning, Staffing and Professional<br />
Development)<br />
Start Date 36<br />
Completion Date<br />
Proposed<br />
Expenditures 37<br />
Estimated<br />
Cost<br />
Funding<br />
Source<br />
1. Provide a Trainer-of-Trainers model for regular<br />
education teachers targeting strategies for<br />
mainstreamed special education students. (EPC 2)<br />
June 2011 – July 2012 PD $40,000 Title I<br />
EIA<br />
<strong>Appendix</strong> 229
2. Provide an EL Institute for teachers focusing on<br />
academic language acquisition and SDAIE<br />
strategies in all content areas to develop a trainer<br />
of trainers model. (EPC 1, 6)<br />
3. Provide ongoing professional development and<br />
coaching on academic language acquisition using<br />
a trainer-of-trainers model. (EPC 1, 6)<br />
4. Create & post content specific SDAIE lessons on<br />
E-Coach. (EPC 1)<br />
5. Provide direct classroom support for the<br />
implementation of program improvement, which<br />
includes, coaching, curriculum workshops, lesson<br />
design, and creating benchmark assessments.<br />
(EPC 6)<br />
6. Implement the common district-wide walkthrough<br />
protocol. (EPC 1,6)<br />
7. Create curriculum imbedded formative<br />
assessment questions in all content areas. (EPC 1,<br />
6, 8)<br />
8. Develop a collaboration protocol for the analysis<br />
of the formative assessments. (EPC 8)<br />
9. Schedule AB 430 / SB 472 training and identify<br />
participants. (EPC 4)<br />
10. Professional development that supports district<br />
Program Improvement goals. (EPC 1,2,6,7)<br />
11. Continue to build and implement data warehouse<br />
to support PI activities. (EPC 7)<br />
May 31 – June 3, 2011<br />
August 2011 – ongoing<br />
June 2011 – ongoing<br />
June 2011 - ongoing<br />
June, 2011 – October<br />
2011<br />
April, 2011 – June, 2012<br />
June, 2011 – October,<br />
2011<br />
June, 2011 – ongoing<br />
June 2011 – ongoing<br />
June 2011 – ongoing<br />
PD<br />
PD<br />
Curriculum Support<br />
PD/Curriculum<br />
support/Support<br />
Teacher<br />
Program<br />
Monitoring/Instruction<br />
al Support<br />
Instructional Support<br />
Instructional Support<br />
PD<br />
PD<br />
Data Director<br />
Software<br />
$60,000<br />
$110,000<br />
$20,000<br />
$360,000<br />
$10,000<br />
$20,000<br />
$10,000<br />
$110,000<br />
$98,000<br />
$192,044.00 (2yr)<br />
Title III<br />
Title III<br />
Title II<br />
EIA<br />
Title III<br />
TitleI<br />
Title II<br />
N/A<br />
Title I,<br />
EIA,<br />
Title I<br />
Title I/II<br />
Title I/II<br />
Multi<br />
funded<br />
Multi<br />
funded<br />
<strong>Appendix</strong> 230
12. Continue to schedule and train certificated and<br />
clerical district employees on Data Director. (EPC<br />
7)<br />
June 2011 – Ongoing<br />
Teacher Hourly<br />
$ 40,000<br />
Title II<br />
13. Expand common assessments for program<br />
monitoring (EPC 1,6,7)<br />
June 2011 – June 2012<br />
Instructional Support<br />
$10,000<br />
Title I<br />
14. Support sites in the implementation of<br />
collaboration meetings through coaching,<br />
facilitation training, and models. (EPC 8)<br />
June, 2011 – June 2012<br />
Program<br />
Monitoring/Collaborat<br />
ion<br />
N/A<br />
N/A<br />
15. Monitor the identification process for students in<br />
the PI model. (EPC 1)<br />
16. Monitor the placement of Long-Term EL<br />
students. ( EPC 1)<br />
April 2011 - Ongoing<br />
April 2011 - Ongoing<br />
Program Monitoring<br />
Program Monitoring<br />
N/A<br />
N/A<br />
35 See <strong>Appendix</strong> B: Chart of Requirements for the SPSA for content required by each program or funding source supporting this goal.<br />
36 List the date an action will be taken or will begin, and the date it will be completed.<br />
37 If funds appropriate to this goal are allocated to the school through the Consolidated Application or other source, list each proposed<br />
expenditure, such as “middle grades reading tutor” or “laptop computer”, and the quantity to be acquired. <strong>School</strong>s participating in<br />
programs for which the school receives no allocation may omit proposed expenditures.<br />
Template for the Single Plan for Student Achievement 22<br />
<strong>Appendix</strong> 231
Form C: Programs Included in this Plan<br />
Check the box for each state and federal categorical program in which the school participates<br />
and, if applicable, enter amounts allocated. (The plan must describe the activities to be<br />
conducted at the school for each of the state and federal categorical programs in which the school<br />
participates. If the school receives funding, then the plan must include the proposed<br />
expenditures.<br />
State Programs W.C. OVERFELT Allocations<br />
California <strong>School</strong> Age Families Education<br />
Purpose: Assist expectant and parenting students succeed in school.<br />
Not Funded<br />
Economic Impact Aid/ State Compensatory Education<br />
Purpose: Help educationally disadvantaged students succeed in the regular<br />
Program.<br />
√ Economic Impact Aid/ English Learner Program<br />
Purpose: Develop fluency in English and academic proficiency of English<br />
Learners.<br />
<strong>High</strong> Priority <strong>School</strong> Grant Program<br />
Purpose: Assist schools in meeting academic growth targets.<br />
Instructional Time and Staff Development Reform<br />
Purpose: Train classroom personnel to improve student performance in<br />
core curriculum areas.<br />
√ Peer Assistance and Review<br />
Purpose: Assist teachers through coaching and mentoring<br />
Pupil Retention Block Grant<br />
Purpose: Prevent students from dropping out of school.<br />
<strong>School</strong> Library Improvement Program Block Grant<br />
Purpose: Improve library and other school programs.<br />
<strong>School</strong> Safety and Violence Prevention Act<br />
Purpose: Increase school safety<br />
Tobacco-Use Prevention Education<br />
Purpose: Eliminate tobacco use among students.<br />
List and Describe Other State or Local funds (e.g., Gifted and Talented<br />
Education)<br />
Not Funded<br />
$42,373<br />
Not Funded<br />
Not Funded<br />
District Services<br />
to <strong>School</strong>s<br />
Not Funded<br />
Not Funded<br />
Not Funded<br />
Not Funded<br />
Not Funded<br />
Total amount of state categorical funds allocated to this school $42,373<br />
3-09 Template for the Single Plan for Student Achievement 24<br />
<strong>Appendix</strong> 232
Federal Programs under No Child Left Behind (NCLB) WCO Allocations<br />
Title I, Neglected<br />
Purpose: Supplement instruction for children abandoned, abused, or rejected<br />
who have been placed in an institution<br />
Title I, Part D: Delinquent<br />
Purpose: Supplement instruction for delinquent youth<br />
√ Title I, Part A: <strong>School</strong>-wide Program<br />
Purpose: Upgrade the entire educational program of eligible schools in high<br />
poverty areas<br />
Title A, Part A: Targeted Assistance Program<br />
Purpose: Help educationally disadvantaged students in eligible schools<br />
achieve grade level proficiency<br />
√ Title I, Part A: Program Improvement<br />
Purpose: Assist Title I schools that have failed to meet NCLB adequate<br />
yearly progress (AYP) targets for one or more identified student groups<br />
Title II, Part A: Teacher and Principal Training and Recruiting<br />
Purpose: Improve and increase the number of highly qualified teachers and<br />
principals<br />
Title II, Part D: Enhancing Education Through Technology<br />
Purpose: Support professional development and the use of technology<br />
Title III, Part A: Language Instruction for Limited-English-Proficient (LEP)<br />
Students<br />
Purpose: Supplemental language instruction to help limited-English-<br />
Proficient (LEP) students attain English proficiency and meet academic<br />
performance standards<br />
Title IV, Part A: Safe and Drug-Free <strong>School</strong>s and Communities<br />
Purpose: Support learning environments that promote academic<br />
achievement<br />
Title V: Innovative Programs<br />
Purpose: Support educational improvement, library, media, and at-risk<br />
students<br />
Title VI, Part B: Rural Education Achievement<br />
Purpose: Provide flexibility in the use of NCLB funds to eligible LEAs<br />
Other Federal Funds (list and describe 40)Small Learning Communities<br />
Not Funded<br />
Not Funded<br />
$191,677<br />
Not Funded<br />
$12,730<br />
Not Funded<br />
District Services<br />
to <strong>School</strong>s<br />
District Services<br />
to <strong>School</strong>s<br />
Not Funded<br />
Not Funded<br />
Not Funded<br />
$225,000<br />
Total amount of federal categorical funds allocated to this school $429,407<br />
Total amount of state and federal categorical funds allocated to this school<br />
$471,780<br />
40 For example, special education funds used in a <strong>School</strong>-Based Coordinated Program to serve students not identified<br />
as individuals with exceptional needs.<br />
3-09 Template for the Single Plan for Student Achievement 25<br />
<strong>Appendix</strong> 233
Form D: <strong>School</strong> Site Council Membership<br />
Education Code Section 64001(g) requires that the SPSA be reviewed and updated at least<br />
annually, including proposed expenditures of funds allocated to the through the Consolidated<br />
Application, by the school site council. The current make-up of the school site council is as<br />
follows: 1<br />
Names of Members<br />
Principal<br />
Classroom<br />
Teacher<br />
Other <strong>School</strong><br />
Staff<br />
Parent or<br />
Community<br />
Member<br />
Secondary<br />
Student<br />
Albini, Sandra<br />
x<br />
Brown, Marissa<br />
x<br />
Burgara, Elvia<br />
x<br />
Cantrell, Pat<br />
x<br />
Chiala, Vito<br />
x<br />
Gregorio, Edna<br />
x<br />
Hurndon, Floyd<br />
x<br />
Martinez, Bruni<br />
x<br />
Murillo, Yovi<br />
x<br />
Panahi, Mehdi<br />
x<br />
Ramos, Robert<br />
x<br />
Solorio, Nancy<br />
x<br />
Taliaoa, Lealofi<br />
x<br />
Tamez, Deb<br />
x<br />
Trieu, Nhu<br />
x<br />
Varguez, Syonna<br />
x<br />
Numbers of members of each category 1 4 3 4 4<br />
1 At elementary schools, the school site council must be constituted to ensure parity between (a) the<br />
principal, classroom teachers, and other school personnel, and (b) parents of students attending the<br />
school or other community members. Classroom teachers must comprise a majority of persons<br />
represented under section (a). At secondary schools there must be, in addition, equal numbers of<br />
parents or other community members selected by parents, and students. Members must be selected<br />
by their peer group.<br />
Template for the Single Plan for Student Achievement<br />
<strong>Appendix</strong> 234
Form E: Recommendations and Assurances<br />
The school site council recommends this school plan and proposed expenditures to the district<br />
governing board for approval and assures the board of the following:<br />
1. The school site council is correctly constituted and was formed in accordance with district<br />
governing board policy and state law.<br />
2. The school site council reviewed its responsibilities under state law and district governing<br />
board policies, including those board policies relating to material changes in the school plan<br />
requiring board approval.<br />
3. The school site council sought and considered all recommendations from the following<br />
groups or committees before adopting this plan (Check those that apply):<br />
___ <strong>School</strong> Advisory Committee for State Compensatory Education Programs<br />
_X_ English Learner Advisory Committee<br />
___ Community Advisory Committee for Special Education Programs<br />
___ Gifted and Talented Education Program Advisory Committee<br />
___ Other (list)<br />
4. The school site council reviewed the content requirements for school plans of programs<br />
included in this Single Plan for Student Achievement and believes all such content<br />
requirements have been met, including those found in district governing board policies and<br />
in the LEA Plan.<br />
5. This school plan is based on a thorough analysis of student academic performance. The<br />
actions proposed herein form a sound, comprehensive, coordinated plan to reach stated<br />
school goals to improve student academic performance.<br />
6. This school plan was adopted by the school site council at a public meeting on: _4/6/11_.<br />
Attested:<br />
__Vito Chiala____________ _______________________ _4/6/11<br />
Typed name of school principal Signature of school principal Date<br />
___Edna Gregorio _____ _______________________ _4/6/11_<br />
Typed name of SSC chairperson Signature of SSC chairperson Date<br />
Template for the Single Plan for Student Achievement<br />
<strong>Appendix</strong> 235
I. Resources<br />
This section contains the following appendices that will assist a school site council in<br />
completing the Single Plan for Student Achievement and in maintaining a cycle of<br />
continuous improvement:<br />
• <strong>Appendix</strong> A: Programs Funded through the Consolidated Application<br />
• <strong>Appendix</strong> B: Chart of Requirements for the Single Plan for Student Achievement<br />
• <strong>Appendix</strong> C: Sample <strong>School</strong> and Student Performance Data Forms<br />
• <strong>Appendix</strong> D: Demographic Data Summary<br />
• <strong>Appendix</strong> E: Analysis of Current Instructional Program<br />
• <strong>Appendix</strong> F: Outline of Sample Bylaws<br />
• <strong>Appendix</strong> G: Use of Resources<br />
• <strong>Appendix</strong> H: Acronyms and Specialized Terms<br />
Template for the Single Plan for Student Achievement<br />
<strong>Appendix</strong> 236
ITEM L Organizational Chart 2011-2012<br />
Principal<br />
• Associate Principal Supervision<br />
• <strong>School</strong> Plan, WASC, <strong>William</strong>s<br />
• Leadership Team Coordination<br />
o Department Chairs<br />
o 18.4 Working<br />
Conditions<br />
o<br />
o<br />
<strong>School</strong> Site Council<br />
Teacher Leadership<br />
Team Coordination<br />
• Collaboration/Staff<br />
Development Plan<br />
• Budget and Account<br />
Management<br />
o General Fund Coordination<br />
& Control<br />
o Compensatory Education<br />
Funds Coordination<br />
Control<br />
o Finance Process, Practices<br />
& Coordination with<br />
District<br />
o Human Resources/Payroll<br />
• Staffing & Teacher Evaluation<br />
• Collective Bargaining<br />
Compliance<br />
• SPED Legal Compliance<br />
• SLC Coordination<br />
• Link Activities<br />
• Athletics<br />
• Communication with Board,<br />
Superintendent, and<br />
designees<br />
• Back To <strong>School</strong> Night<br />
• Classified Supervision &<br />
Evaluation<br />
• Graduation<br />
• Technology Plan<br />
• Student Nutrition<br />
• Library and text book Fees<br />
• Staff Recognition<br />
• CSI Coordination<br />
• Mandated Cost<br />
• Grants and Corporate<br />
Outreach<br />
W.C. <strong>Overfelt</strong> Organizational Chart, 2011-2012<br />
APED<br />
• Instructional Program<br />
• Master Schedule<br />
• Student Scheduling<br />
• 8th Grade Placement<br />
• Articulation with Feeder<br />
<strong>School</strong>s<br />
• 8th Grade Parent Night<br />
• Academic Counseling<br />
• Assessment & Testing<br />
• Registrar/Counseling Tech<br />
• Data Collection & Reporting<br />
• ELD/LEP Program<br />
Coordination<br />
• ELAC/DLAC<br />
• SPED Instructional Program<br />
• Teacher Evaluation<br />
• <strong>School</strong> Loop, Tele Parent<br />
• Tutoring Programs<br />
• CPM<br />
• Mandated Cost<br />
• SST and 504 Coordination<br />
Head Counselor<br />
• Coordination of Guidance<br />
Program<br />
• Scholarship and Financial<br />
Aid<br />
• Student Recognition<br />
• PSAT Testing<br />
• Honor Night<br />
APA<br />
• Student Discipline<br />
• <strong>School</strong> Safety & Security<br />
• Advisor & Campus Monitor<br />
Supervision<br />
• Attendance and SARB<br />
• Athletic Council<br />
• Attendance Staff & Health<br />
Center Tech. Supervision<br />
• Custodial Supervision<br />
• Maintenance of Facilities/Plant<br />
• New Facility-Construction<br />
• Articulation with Public Safety<br />
• Updated Safety Plan, Drills<br />
• Safety & Crisis Team<br />
• Teacher Evaluation<br />
• Summer <strong>School</strong> Coordination<br />
• Classified Supervision &<br />
Evaluation<br />
• ASB Activities<br />
• Short Term Independent Study<br />
• Parent and Community<br />
Involvement<br />
• Mandated Cost<br />
• Lockers<br />
• Facility Use Coordination<br />
Activities Director<br />
• ASB Activities<br />
• Student Senate<br />
• Senior Institute<br />
• Academic Assembly<br />
• Leadership Class<br />
• Crown Awards<br />
• Staff Activities Supervision<br />
MST Coordinator<br />
• Coordination with Outside<br />
Agencies<br />
• MAA Coordination<br />
• Alignment of Services with<br />
Needs<br />
• MST Referral Process and<br />
Reporting<br />
• Healthy Start Center<br />
Supervision<br />
<strong>Appendix</strong> 237
Organizational Chart 2011-2012<br />
ITEM L<br />
Athletics<br />
• Football – Chiala<br />
• Volleyball – Miranda/Murillo<br />
• Boys’Baseball – Murillo<br />
• Girls’ Baseball – Miranda<br />
• Boys’ Soccer – Chiala<br />
• Girls’ Soccer – Chiala<br />
• Wrestling – ?<br />
• Baseball – Admin on Campus<br />
• Softball – Admin on Campus<br />
• Track – Admin on Campus<br />
Collaboration<br />
Departments<br />
• English – Miranda<br />
• Math – Chiala<br />
• SS – Murillo<br />
• Sci – Chiala<br />
• PE – Murillo<br />
• FL/ELD – Murillo<br />
• SPED – Miranda<br />
• Arts – Chiala<br />
SPED Case<br />
Management<br />
• Rodriguez – Chiala<br />
• Hall – Murillo<br />
• Alfaro – Chiala<br />
• Arnold – Miranda<br />
• Nickerson – Miranda<br />
• Rehrig – Chiala<br />
• Cabral – Chiala<br />
• Stauffer – Murillo<br />
• Serote – Miranda<br />
• Gallegos – Miranda<br />
• Christian – Murillo<br />
<strong>Appendix</strong> 238
DRAFT: 3/25/11 (FINAL)<br />
Small Learning Communities Proposal<br />
<strong>Overfelt</strong> <strong>High</strong> <strong>School</strong> 2011‐2012<br />
• Vision/Purpose (brief)<br />
• Description/Overview of Plan (all students/academies assigned to a house)<br />
• Leadership and Decision Making<br />
• Plan for inclusion of special needs, ELD<br />
• Plan for Electives and Singletons<br />
• Student Choice and Equity (include new student placement)<br />
• Adult Choice and Assignment<br />
• Discipline and Student Support<br />
• Professional Development<br />
• Monitoring and Evaluation<br />
Vision/Purpose<br />
In an effort to accelerate academic achievement for all of our students, we will structure <strong>Overfelt</strong> <strong>High</strong><br />
<strong>School</strong> into small learning communities to create a positive connection to school, facilitating increased<br />
rigor, relevance, and support. The plan will build a close‐knit community in order to unify our efforts to<br />
advance our struggling students as well as our highest achieving students.<br />
Description/Overview of Plan<br />
The plan is to create three houses. All students will be assigned to a house in a manner that ensures<br />
equity across houses and support for all students. The staff and students in each of our existing<br />
academies will be placed into one of the three houses. Students learning English as a second language,<br />
advanced students, and students with special needs will be supported within the house structure.<br />
Whenever possible within the master schedule, teachers will be assigned to one of the three houses. A<br />
conscious effort will be made to ensure students and teachers are placed entirely within their academy<br />
or house. A special plan for teachers of electives and singletons is included in this proposal. See<br />
attached chart for specifics.<br />
Leadership and Decision Making<br />
• The leadership structure will continue to include current decision making groups including the<br />
18.4 Committee, Department Chairs, and Teacher Leadership Team. The current SLC<br />
coordinators group will be expanded to include one leader from each house.<br />
• The House Leader will provide a single point of contact for the house, will pay special attention<br />
to freshmen and unassigned students, will facilitate house collaborations, and will represent the<br />
house at Department Chair meetings. The house leader could not be a current academy<br />
coordinator and would be selected using the Department Chair selection process. This position<br />
will not have the authority to evaluate or direct teachers. Administration will continue to retain<br />
those responsibilities as specified by the bargaining agreement and district policy.<br />
<strong>Appendix</strong> 239
Plan for inclusion of Special Needs, ELD, and Advanced Students<br />
• Special Education students will be incorporated into the houses in a manner that provides as<br />
much access to the mainstream as possible. Resource (RSP) students will have access to all<br />
academies and be supported by a case manager assigned to each house. That case manager will<br />
teach a class to support students in each house as well as assist mainstream teachers with<br />
providing accommodations and modifications for RSP students. Special Day Class (SDC) students<br />
and teachers will be assigned to one house. SDC students will have the option to join an<br />
academy whenever their IEPs permit.<br />
• English Language Development (ELD) students and teachers will be assigned to one house. ELD<br />
students will have the option to join any academy at the point when they reach a satisfactory<br />
English proficiency level as determined by the ELD teachers.<br />
• Those advanced students who do not select an academy will be placed in one particular house<br />
where they will receive the support and opportunities provided to academy students (e.g., field<br />
trips and counseling). Additionally, efforts will be made to provide teachers of these students<br />
the opportunity to collaborate in addressing these students’ needs.<br />
Plan for Electives and Singletons<br />
• Students will take the majority of their elective classes outside of the house structures although<br />
efforts will be made to assign teachers to houses whenever possible. Additionally, singleton<br />
classes will, of necessity, be offered to students from all houses.<br />
• Any teacher not assigned to a house will select a house to join for the purposes of professional<br />
development and collaboration. Teachers will be able to use the house assignments of their<br />
students to guide their collaboration decision. The commitment to collaborate with a particular<br />
house will be for no less than one semester.<br />
Student Choice and Equity<br />
• All incoming ninth grade students will be given the opportunity to select a ninth grade program<br />
during our eighth grade middle school visits. Students who are not enrolled in a program will be<br />
randomly assigned to each house in manner that assures equitable distribution of ability levels<br />
to all houses.<br />
• During the ninth grade year, students will learn more about the existing academies at <strong>Overfelt</strong>.<br />
All ninth grade students will attend an academy and elective fair followed by a presentation by<br />
each 10‐12 academy. Students will then prioritize their academy selections. Efforts will be made<br />
to place students in their first choice of academy while maintaining equity. Unassigned students<br />
will remain in their original house.<br />
• Students who want to leave or change academies will have the opportunity to request the<br />
change during a designated one month window. The process will be managed by the counseling<br />
office. All changes will be for the following school year. Academies who wish to remove students<br />
who are not achieving will follow a process that shares students equitably between academies<br />
and meets students’ learning needs.<br />
• When new students enroll, they will participate in an orientation that provides them<br />
information about the expectations and opportunities at <strong>Overfelt</strong>. These students will have the<br />
opportunity to select an academy based upon available space and student preference. Students<br />
who do not select an academy will be assigned to a house with deliberate attention to<br />
maintaining equity.<br />
<strong>Appendix</strong> 240
• The Equity Committee will be formed to oversee the processes outlined above. The goal of this<br />
committee will be to monitor the equitable distribution of students across houses using<br />
academic achievement, behavior, and attendance data as primary indicators. The committee<br />
will include an administrator, counselor, a teacher elected by each house, a teacher from the<br />
electives, and a special education teacher. The members cannot be academy or SLC<br />
coordinators. Each committee member would serve for a year and would receive schoolwide<br />
access and training on data gathering. Meetings will be scheduled in advance and will<br />
correspond to the scheduling and placement timeline. The committee will report findings and<br />
recommendations after each meeting. Administration will be responsible for identifying proper<br />
avenues for the resolution of issues identified by the committee.<br />
Adult Choice and Assignment<br />
• Teachers will complete a preference sheet prioritizing their desired courses, academies, and<br />
houses. The sheet will be submitted to the Department Chair.<br />
• Department Chairs and Academy Coordinators will share the preference sheets and make<br />
schedule recommendations based upon student need, department, house and academy<br />
courses, and teacher preference.<br />
• The master schedule building team will use the schedule recommendations to complete a<br />
master schedule that best meets the students’ needs.<br />
Discipline and Student Support<br />
Teachers will follow the school’s discipline policies and procedures; however they will be able to consult<br />
with other teachers within their house about specific students. In addition, academy and house<br />
teachers will have the flexibility to develop their own strategies and interventions for dealing with issues<br />
as long as they do not contradict school policy. Administration will actively seek solutions to address<br />
students with the most serious behavior issues.<br />
Professional Development<br />
Professional development will be critical as we increase our ability to positively impact student<br />
achievement within the small learning community model. House teachers will develop a plan for<br />
professional development to meet the needs of the teachers in each house. Department chairs will<br />
continue to develop approved curricular professional development for content areas. Administration,<br />
guided by the Teacher Leadership Team, will plan necessary school‐wide professional development,<br />
particularly in the area of effective collaboration. All professional development will support <strong>Overfelt</strong>’s<br />
Single Plan for Student Achievement.<br />
Monitoring and Evaluation<br />
The Equity Committee will present data annually to monitor and evaluate the impact of the Small<br />
Learning Community plan on student achievement. Data will be evaluated on three levels. First, student<br />
attendance, behavior, and retention data will be evaluated to assess student connection to the school.<br />
Second, academic achievement will be evaluated through trends in GPA, California Standards Tests,<br />
California <strong>High</strong> <strong>School</strong> Exit Exam, and class pass rates. Third, longer‐range success of the small learning<br />
communities will be analyzed through data on A‐G completion and graduation rate.<br />
<strong>Appendix</strong> 241
<strong>Appendix</strong><br />
• Proposed SLC Chart<br />
• Rationale (the whys)<br />
• SLC Terms and Research<br />
• Data from WCO<br />
<strong>Appendix</strong> 242
Rationale for <strong>School</strong>wide Change Proposal<br />
Why Small Learning Communities? Why now?<br />
<strong>Overfelt</strong> specific rationale:<br />
• Our current model does not serve all students. Students are able to opt out of small learning<br />
communities. Frequently the students who opt out are our highest and lowest achieving<br />
students. Our highest achieving students will benefit from the opportunities created in the<br />
house model. Our lowest achieving students are the ones we most need to serve with our<br />
efforts. This model will provide the opportunities and support for all students.<br />
• Our current SLCs are not as effective as they could be at connecting students and increasing<br />
achievement within the SLCs. Many students at this time take classes outside of their academies<br />
or with teachers from other academies. Frequently these students are in math and English<br />
support classes. As a result, there are reduced opportunities for collaboration with these<br />
teachers and students are more likely to fall through the cracks in some of our most critical<br />
courses. The proposed model will keep critical classes within the house where teachers can<br />
support the students.<br />
• With current model, teachers are pulled in many directions creating confusion, fragmentation,<br />
and distrust. Teachers who are involved in academies often serve students from other<br />
academies as well as non‐academy students. Teachers who are not in academies may feel that<br />
their students do not have the advantages of academy students. This tends to overextend some<br />
teachers and be divisive for others. The proposed model will unify the teachers in three houses<br />
which will enhance communication, collaboration, and support.<br />
• We will need to be increasingly competitive with the charters if we are to continue to attract<br />
students with diverse academic abilities. The proposal will structure <strong>Overfelt</strong> in a way that<br />
supports increased personalization, creates pathways that weave rigor and relevance, and<br />
improves our ability to accelerate academic achievement. Implementing this model will allow us<br />
to offer many of the same advantages of charter schools along with the advantages of a<br />
comprehensive high school. It will also send a strong message to the public that we are<br />
committed to providing the high quality education needed to be successful in the 21 st century.<br />
• Showing a unified approach in adopting a research based schoolwide effort to improve<br />
academic achievement for all students will help us to maintain current funding and attract<br />
future partnerships, resources, and financial support.<br />
Research Findings (general):<br />
• SLCs bring students together into a structure that makes them feel more connected to their<br />
teachers and other students, and thus more engaged.<br />
• Teachers get to know their students well and take on a variety of roles, such as helping to guide<br />
them toward future goals.<br />
• In career academies students orient their high school coursework toward some future endeavor<br />
and learn the value of higher education in their field.<br />
• A number of studies of these approaches have shown positive impacts on such measures as<br />
attendance, retention, grades, graduation rates, and employment as well as a statistically<br />
significant positive impact on college going among academy graduates.<br />
<strong>Appendix</strong> 243
<strong>Appendix</strong> 244
ITEM N Programs, Grants, and Partnerships, 2011<br />
2011-2012 Summary of Categorical Funds, Grants, and Partnerships<br />
W. C. <strong>Overfelt</strong> <strong>High</strong> <strong>School</strong><br />
Federal<br />
State<br />
Grants<br />
Funding Source Description Amount<br />
NCLB – Title 1<br />
Funds used to support professional development $11,607<br />
including extra time, sub out days, instructional<br />
materials and supplies.<br />
Title 1<br />
$51,460 site allocation not for district allocated $223,088<br />
personnel costs. Funds used to cover repro and<br />
materials costs, library tutoring and tech mentor.<br />
Small Learning Communities 5 Year grant to support WCO and AH<br />
implementation of school-wide small learning<br />
communities. Funds go to counseling, SLC teacher<br />
release periods, summer professional development.<br />
$187,382<br />
Perkins Funds<br />
Funds directly support CTE courses in Electronics, $22,562<br />
Multimedia, and Child Development<br />
EIA<br />
$33,299 site allocation not for district allocated $54,602<br />
personnel costs. Funds support tutoring, parent<br />
outreach and conference days, instructional supplies<br />
and materials.<br />
Professional Development Funds used to support AP training $6,062<br />
CPA Electronics<br />
Lead teacher release period and other academy $33,482<br />
related costs<br />
CPA Multimedia<br />
Lead teacher release period and other academy $37,116<br />
related costs<br />
CPA Child Development<br />
Lead teacher release period and other academy $37,116<br />
related costs<br />
CAPP <strong>High</strong> <strong>School</strong> Leadership Funds and support for developing principal and $64,313<br />
teacher leadership. Funds pay for teacher sub out<br />
days, teacher extra time for TLT and summer work,<br />
and materials. Team planning retreat, mentor, and<br />
two site visits per year provided as part of grant.<br />
CAPP Expository Literacy<br />
Funds cover teacher time and materials to support $31,101<br />
development of expository literacy in English<br />
courses.<br />
CAPP Algebra Support<br />
New planning grant to develop math articulation $15,000<br />
with feeder middle schools. Next year $75,000<br />
implementation grant.<br />
SJ Safe Summer Initiative<br />
Funds help support summer opportunity program $5,960<br />
within CSI.<br />
Applied Materials Foundation Carryover from $50,000 grant to support student $3,066<br />
interventions used to operate library after school.<br />
Google – Tides Foundation Funds to support math materials and PD as well as $15,000<br />
library tutoring.<br />
IBM Community Impact Grant Funds to purchase science materials and equipment. $10,000<br />
ALearn<br />
Support for CSI algebra and geometry classes in $32,000<br />
2011<br />
SVCF Support for CSI Program in 2012 $50,000<br />
<strong>Appendix</strong> 245
Programs, Grants, and Partnerships, 2011<br />
ITEM N<br />
Partnerships<br />
Silicon Valley Education<br />
Foundation<br />
New Teacher Center<br />
YWCA Project Inspire<br />
SJSU Gear Up<br />
CALSOAP<br />
Step Up to Biology program in CSI and at three<br />
other sites, Summer Math Acceleration at WCO, A-<br />
G Audit district-wide<br />
PD support for GRR in Math and Science, PLC for<br />
house leadership training<br />
After school program and summer support for CSI<br />
and three additional courses<br />
After school program and student support for 10 th<br />
grade students. Summer program<br />
College readiness support and CSI college tutor and<br />
college curriculum support<br />
$35,000<br />
$872,567<br />
+ Services<br />
<strong>Appendix</strong> 246
ITEM O<br />
Pyramid of Effort-Based <strong>School</strong> Success<br />
<strong>Appendix</strong> 247
<strong>Appendix</strong> 248
ITEM P<br />
Rosters<br />
SCHOOL COMMITTEE ROSTERS<br />
18.4 Committee Members<br />
Eleanor Aguirre<br />
Natalia Baldwin<br />
Brian Barrientez<br />
Vito Chiala<br />
Mark Delgado<br />
Yovi Murillo<br />
Rachel Stanek<br />
Equity Committee<br />
Laura Alfaro<br />
Chrisanne Beebe<br />
Nilda Calvo<br />
Paul Maligalig<br />
Coleen Montesano<br />
Lawrence Yee<br />
Professional Learning Community<br />
Knights<br />
Lions<br />
Marissa Brown<br />
Sandra Albini<br />
Prema Gammons<br />
Natalia Baldwin*<br />
Honey Gubuan*<br />
Julie Broquet (Fall Sem.)<br />
Julie Gonzalez (Spring Sem.)<br />
Jill Stauffer<br />
Torchbearers<br />
Ludy Aguada<br />
Veronica Davis<br />
Douglas Day<br />
Kelly Kreidler*<br />
Araceli Rodriguez<br />
<strong>School</strong> Safety Team<br />
Alex Adayan<br />
Bob Barnes<br />
Brian Barrientez<br />
Vito Chiala<br />
Carolina Garcia<br />
Floyd Hurndon<br />
Marcela Miranda<br />
Yovi Murillo<br />
Kurt Nickerson<br />
Richard Pierce<br />
Police Officer<br />
Araceli Rodriguez<br />
* House Leader<br />
Alejando Saldivar<br />
Monica Schneider<br />
Rachel Stanek<br />
Soladad Varela<br />
<strong>Appendix</strong> 249
Rosters<br />
ITEM P<br />
<strong>School</strong> Site Council<br />
Chairperson: Sharon Ha<br />
Vice-chairperson: Edna Gregorio<br />
Secretary: Verenice Esquivel<br />
Sergeant of Arms: Luis Ruiz<br />
Staff<br />
Ludy Aguada<br />
Sandra Albini<br />
Marissa Brown<br />
Vito Chiala<br />
Paul Maligalig<br />
Eugene Martinez<br />
Debbie Tamez<br />
Joe Te<br />
Students<br />
Edna Gregorio<br />
Sharon Ha<br />
Laura Diaz<br />
Athena Bugarin<br />
Parents<br />
Elvia Burgara<br />
Pat Cantrell<br />
Sylvia Diaz<br />
Nhu Trieu<br />
Student Alternates<br />
Eric Morales<br />
Brandon Segovia<br />
Victor Cruz<br />
Arturo Rocha<br />
Stephanie Serrano<br />
Suleyma Valdovinos<br />
Parent Alternates<br />
Estella Gregorio<br />
Patrice Kelly<br />
Staff House Assignments<br />
Knights<br />
Hope Alley<br />
Chrisanne Beebe<br />
Marisa Brown<br />
Chris Cali<br />
Adrian Crawford<br />
Deigo Depaz<br />
Martha Espinoza<br />
Eugene Martinez<br />
Prema Gammons<br />
Honey Gubuan<br />
Huy Nguyen<br />
Floyd Hurndon<br />
Dan Nevo<br />
Mehdi Panahi<br />
Harilaos<br />
Petropoulakis<br />
Marylynn<br />
Reynolds<br />
Adele Sagun<br />
Estrella Serote<br />
Marcy Burwin-<br />
Smith<br />
Rachel Stanek<br />
Lions<br />
Ludy Aguada<br />
Laura Alfaro<br />
Felicia Arnold<br />
Brian Barrientez<br />
Richard Cabral<br />
Veronica Davis<br />
Doug Day<br />
Kris Ferguson<br />
Vicky Gallegos<br />
Jim Hall<br />
Kelly Kreidler<br />
Deborah Maybee<br />
Kurt Nickerson<br />
Paul Ortiz<br />
Araceli Rodriguez<br />
John Selby<br />
Wendy Van Camp<br />
Mark Wightman<br />
Lawrence Yee<br />
Torchbearers<br />
Eleanor Aguirre<br />
Joe Albers<br />
Sandra Albini<br />
Natalia Baldwin<br />
Julie Broquet<br />
Mike Cross<br />
Ben Ellison<br />
Ellen Hansen<br />
Jenny Kim<br />
Paul Maligalig<br />
Tony Pacheco<br />
James Radcliffe<br />
Jeff Rehrig<br />
Jill Stauffer<br />
Hector Tejada<br />
Truc Tran<br />
Cindy Wu<br />
Electives<br />
Nilda Calvo<br />
Glen Davis<br />
Mark Delgado<br />
Alvin Floro<br />
Mike Gomez<br />
Julie Gonzalez<br />
Alejandro Saldivar<br />
Ernie Mendoza<br />
Virginia Monge<br />
Van Nguyen<br />
Richard Pierce<br />
Ian Rowe<br />
Joe Te<br />
<strong>Appendix</strong> 250