Characterization of a Dielectric Barrier Discharge in axisymmetric ...
Characterization of a Dielectric Barrier Discharge in axisymmetric ...
Characterization of a Dielectric Barrier Discharge in axisymmetric ...

Create successful ePaper yourself
Turn your PDF publications into a flip-book with our unique Google optimized e-Paper software.
89 International Journal <strong>of</strong> Plasma Environmental Science and Technology Vol.2, No.2, SEPTEMBER 2008<br />
<strong>Characterization</strong> <strong>of</strong> a <strong>Dielectric</strong> <strong>Barrier</strong> <strong>Discharge</strong> <strong>in</strong> <strong>axisymmetric</strong> and<br />
planar configurations -Electrical Properties-<br />
Boni Dramane, Nouredd<strong>in</strong>e Zouzou, Eric Moreau and Gerard Touchard<br />
Laboratoire d’Etudes Aérodynamiques (LEA) , Université de Poitiers, ENSMA, CNRS<br />
2 Bd. Marie & Pierre Curie, Téléport 2, BP. 30179, 86962, Futuroscope Chasseneuil Cedex, France<br />
Abstract— The characteristics <strong>of</strong> a <strong>Dielectric</strong> <strong>Barrier</strong> <strong>Discharge</strong> (DBD) <strong>in</strong> <strong>axisymmetric</strong> and planar configurations are<br />
studied and compared by measur<strong>in</strong>g their electrical discharge parameters and the airflow <strong>in</strong>fluence on these parameters.<br />
With the <strong>axisymmetric</strong> reactor, the application <strong>of</strong> AC high voltage generates a stable and quasi-diffuse discharge whereas<br />
the planar reactor generates a filamentary and unstable discharge. When the flow rate <strong>in</strong>creases the discharge current and<br />
the electric power decrease <strong>in</strong> both cases. This effect is less pronounced <strong>in</strong> the planar configuration.<br />
Keywords— <strong>Dielectric</strong> barrier discharge, Wire to cyl<strong>in</strong>der reactor, Plane to plane reactor<br />
I. INTRODUCTION<br />
<strong>Dielectric</strong> <strong>Barrier</strong> <strong>Discharge</strong> (DBD) is well known<br />
to produce highly non-equilibrium plasmas <strong>in</strong> a<br />
controllable way at atmospheric pressure. This method<br />
can effectively generate atoms, radicals, and excited<br />
species with energetic electrons at moderate gas<br />
temperatures [1, 2].<br />
Because <strong>of</strong> its high electron density and energy, the<br />
DBD <strong>in</strong> air has been used to clean hazardous air<br />
pollutants (HAPs) [3-5].<br />
In general, operat<strong>in</strong>g at atmospheric pressure, the<br />
DBD is generated <strong>in</strong> filamentary form [6]. DBDs can<br />
also be obta<strong>in</strong>ed <strong>in</strong> a diffuse form under certa<strong>in</strong><br />
configurations and conditions [7-9].<br />
In order to remove ultra f<strong>in</strong>e particles from Diesel<br />
exhaust, two DBD reactors have been used to determ<strong>in</strong>e<br />
which <strong>of</strong> them gives the lowest energy density for an<br />
efficient removal. The reactors are <strong>in</strong> <strong>axisymmetric</strong> and<br />
planar configurations.<br />
This prelim<strong>in</strong>ary study was performed by measur<strong>in</strong>g<br />
the electrical parameters <strong>of</strong> the discharge: applied voltage,<br />
discharge current, transferred charge, and electric power<br />
consumption. The results obta<strong>in</strong>ed <strong>in</strong> both configurations<br />
were compared. A detailed attention was given to the<br />
<strong>in</strong>fluence <strong>of</strong> the flow on the discharge behavior.<br />
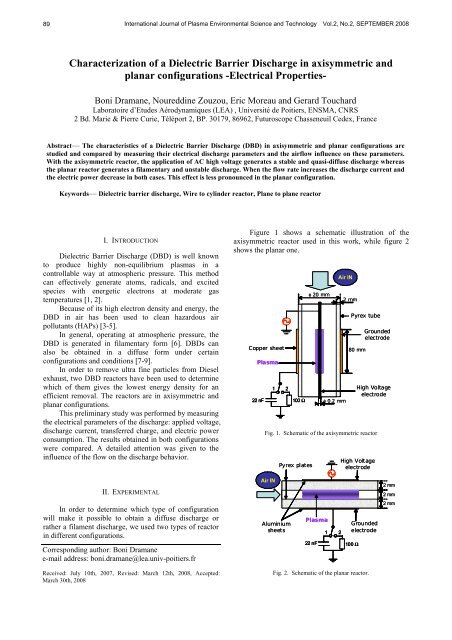
Figure 1 shows a schematic illustration <strong>of</strong> the<br />
<strong>axisymmetric</strong> reactor used <strong>in</strong> this work, while figure 2<br />
shows the planar one.<br />
Copper sheet<br />
Plasma<br />
1 2<br />
22 nF 100 Ω<br />
φ 20 mm<br />
Air IN<br />
φ 0.2 mm<br />
2 mm<br />
Pyrex tube<br />
80 mm<br />
Fig. 1. Schematic <strong>of</strong> the <strong>axisymmetric</strong> reactor<br />
Pyrex plates<br />
Grounded<br />
electrode<br />
High Voltage<br />
electrode<br />
High Voltage<br />
electrode<br />
II. EXPERIMENTAL<br />
Air IN<br />
2 mm<br />
2 mm<br />
In order to determ<strong>in</strong>e which type <strong>of</strong> configuration<br />
will make it possible to obta<strong>in</strong> a diffuse discharge or<br />
rather a filament discharge, we used two types <strong>of</strong> reactor<br />
<strong>in</strong> different configurations.<br />
Correspond<strong>in</strong>g author: Boni Dramane<br />
e-mail address: boni.dramane@lea.univ-poitiers.fr<br />
Alum<strong>in</strong>ium<br />
sheets<br />
Plasma<br />
Grounded<br />
1 2<br />
electrode<br />
22 nF 100 Ω<br />
2 mm<br />
Received: July 10th, 2007, Revised: March 12th, 2008, Accepted:<br />
March 30th, 2008<br />
Fig. 2. Schematic <strong>of</strong> the planar reactor.
Dramane 90<br />
The <strong>axisymmetric</strong> configuration setup consists <strong>of</strong> a<br />
Pyrex tube, a copper sheet, a sta<strong>in</strong>less wire and an air<br />
circulation system. Outer diameter <strong>of</strong> the Pyrex tube was<br />
20 mm and the thickness was 2 mm. The copper sheet<br />
with 8 cm width was rolled up on the outer surface <strong>of</strong> the<br />
Pyrex tube. The sta<strong>in</strong>less wire <strong>of</strong> 0.2 mm <strong>of</strong> diameter was<br />
ma<strong>in</strong>ta<strong>in</strong>ed tended on the central axis <strong>of</strong> the tube and<br />
connected to the high voltage.<br />
The planar configuration setup consists <strong>of</strong> two<br />
alum<strong>in</strong>um sheets, two plates made <strong>of</strong> Pyrex and an air<br />
circulation system. With a thickness <strong>of</strong> 0.1 mm and an<br />
area <strong>of</strong> 50 x 47 mm 2 , each alum<strong>in</strong>um foil is stuck on the<br />
dielectric plate. Us<strong>in</strong>g spacers made <strong>of</strong> glass <strong>of</strong> 2 mm<br />
thick, the active volume <strong>of</strong> the discharge was 50x40x2<br />
mm 3 . The top sheet, used as the active electrode, was<br />
connected to high voltage and the bottom one was<br />
grounded. To avoid the edge effect, the electrode<br />
contours were encapsulated <strong>in</strong> epoxy res<strong>in</strong>.<br />
The high voltage power amplifier (Trek, 20/20C,<br />
±20 kV/ ±20 mA) was driven by a function generator<br />
(HAMEG, HM8130) to generate high voltage s<strong>in</strong>e wave.<br />
High voltage up to 20 kV was applied to the high voltage<br />
electrode with frequencies <strong>of</strong> 0.5, 1 and 2 kHz. Applied<br />
voltage was monitored with an oscilloscope (Tektronix,<br />
TDS3014B) with a high voltage divider (Lecroy 1000:1,<br />
20 kV). The total current <strong>of</strong> discharge is measured with a<br />
resistor <strong>of</strong> 100 Ω and the transferred charge with a<br />
capacitor <strong>of</strong> 22 nF.<br />
All the experiments were carried out under<br />
atmospheric pressure at room temperature. The airflow<br />
<strong>in</strong>side the reactors was controlled. The flow rate (Q) is<br />
measured with a flow meter (Brooks, tube size R-6-15-A,<br />
Tantalum ball).<br />
pulses dom<strong>in</strong>ate the negative half-cycle. This behavior is<br />
also observed <strong>in</strong> po<strong>in</strong>t to plane DBD [10].<br />
The transferred charge waveform shown <strong>in</strong> figure 3-<br />
b presents an evolution which can be break up <strong>in</strong>to two<br />
steps. Dur<strong>in</strong>g the positive half-cycle, the transferred<br />
charge <strong>in</strong>creases and after the voltage maximum it<br />
Current (mA)<br />
Charge (nC)<br />
20<br />
10<br />
0<br />
-10<br />
-20<br />
-20<br />
0,0 0,5 1,0 1,5 2,0<br />
Time (ms)<br />
500<br />
250<br />
0<br />
-250<br />
(a)<br />
20<br />
10<br />
0<br />
Voltage (kV)<br />
-10<br />
20<br />
10<br />
0<br />
-10<br />
Voltage (kV)<br />
III. RESULTS AND DISCUSSION<br />
A. <strong>Discharge</strong> characteristics <strong>in</strong> each configuration<br />
Typical oscillograms <strong>of</strong> the applied voltage,<br />
discharge current, transferred charge and charge-voltage<br />
curve <strong>in</strong> the Lissajous figure with <strong>axisymmetric</strong> and<br />
planar reactors are shown <strong>in</strong> figures 3 and 4, respectively.<br />
Figure 3- a shows the time evolution <strong>of</strong> the applied<br />
voltage and the discharge current obta<strong>in</strong>ed from the<br />
measured current. Indeed, the measured current <strong>in</strong>cludes<br />
fast component (current pulse) and slow component<br />
(capacitive and pseudo cont<strong>in</strong>uous current). The<br />
capacitive current, which was estimated from the I-t<br />
curve with applied voltage low enough to generate any<br />
discharge, was subtracted from the measured current to<br />
obta<strong>in</strong> the discharge current. All the discharge currents<br />
hereafter are presented <strong>in</strong> this way.<br />
The discharge current waveform shows only few<br />
pulses <strong>of</strong> current on the positive half-cycle, while on the<br />
negative one the number <strong>of</strong> pulses is significant. In the<br />
positive half-cycle <strong>of</strong> the applied voltage, the plasma is<br />
characterized by a glow-like type. However, the Trichel<br />
Charge (nC)<br />
-500<br />
-20<br />
0,0 0,5 1,0 1,5 2,0<br />
500<br />
250<br />
0<br />
-250<br />
Time (ms)<br />
-500<br />
-20 -10 0 10 20<br />
Voltage (kV)<br />
(b)<br />
(c)<br />
Fig. 3. Axisymmetric reactor characteristics: (a) time evolution <strong>of</strong> the<br />
discharge current, (b) time evolution <strong>of</strong> the transferred charge, and (c)<br />
charge-voltage curve. Conditions: V peak = 12 kV; f = 1 kHz; Q = 4.7<br />
L.m<strong>in</strong> -1 .
91 International Journal <strong>of</strong> Plasma Environmental Science and Technology Vol.2, No.2, SEPTEMBER 2008<br />
stabilizes. The transferred charge decreases aga<strong>in</strong> for<br />
another sequence.<br />
The charge-voltage curve (figure 3- c) represents a<br />
close loop, which will be described <strong>in</strong> the follow<strong>in</strong>g<br />
section.<br />
In contrast, the discharge <strong>in</strong> planar configuration is<br />
characterized by a filamentary behavior (figure 4- a). The<br />
current pulses are higher <strong>in</strong> magnitude and less numerous<br />
dur<strong>in</strong>g the positive half-cycle than on the negative one.<br />
The time evolution <strong>of</strong> the transferred charge shows<br />
similar steps as that found <strong>in</strong> <strong>axisymmetric</strong> configuration<br />
(figure 4- b).<br />
Another difference between both configurations is<br />
their charge-voltage curve. It is noted that, <strong>in</strong> opposition<br />
to the planar configuration, with a figure close to a<br />
parallelogram [3], the charge-voltage curve <strong>in</strong><br />
<strong>axisymmetric</strong> configuration shows a k<strong>in</strong>d <strong>of</strong> r<strong>in</strong>g <strong>of</strong> the<br />
shape <strong>of</strong> an ellipse flattened on the edges.<br />
The slope <strong>of</strong> the curve represents the total<br />
capacitance (C tot ) <strong>of</strong> the reactor [11]. Indeed, the total<br />
capacitance <strong>of</strong> the reactors without discharge is<br />
1/C tot =1/C d +1/C g , where C d is the dielectric capacitance<br />
and C g is the air gap capacitance.<br />
In the planar configuration, the filaments make a<br />
short-circuit <strong>in</strong> the gap when the discharge occurs. Then,<br />
the total capacitance, which is equal to the capacitance <strong>of</strong><br />
the dielectric, becomes larger.<br />
However, <strong>in</strong> the <strong>axisymmetric</strong> configuration, the<br />
discharge occurs around the wire without mak<strong>in</strong>g a shortcircuit<br />
<strong>in</strong> the air gap. The expansion <strong>of</strong> the discharge <strong>in</strong><br />
the gap varies with the voltage, <strong>in</strong>duc<strong>in</strong>g a variable gap<br />
capacitance and obviously a variable total capacitance.<br />
The slope <strong>of</strong> charge-voltage curve <strong>in</strong>creases more slowly<br />
than <strong>in</strong> the planar configuration, which expla<strong>in</strong>s the<br />
flatten<strong>in</strong>g <strong>of</strong> the edges.<br />
<strong>of</strong> the frequency from 1 kHz to 2 kHz for a fixed voltage<br />
<strong>of</strong> 12 kV <strong>in</strong>volves also an <strong>in</strong>crease <strong>of</strong> the number <strong>of</strong><br />
discharge current pulses.<br />
In contrast, the charge-voltage curve rema<strong>in</strong>s nearly<br />
unchanged on figure 7- b compared to figure 4- c where<br />
V peak = 12 kV and f = 1 kHz.<br />
Current (mA)<br />
300<br />
150<br />
0<br />
-150<br />
-300<br />
-20<br />
0,0 0,5 1,0 1,5 2,0<br />
Charge (nC)<br />
500<br />
250<br />
0<br />
-250<br />
Time (ms)<br />
(a)<br />
20<br />
10<br />
0<br />
-10<br />
20<br />
10<br />
0<br />
-10<br />
Voltage (kV)<br />
Voltage (kV)<br />
B. Effect <strong>of</strong> applied voltage and frequency on discharge<br />
characteristics<br />
Figures 5- a and 5- b show the time evolution <strong>of</strong><br />
applied voltage, discharge current and charge-voltage<br />
curve for <strong>axisymmetric</strong> reactor when the applied voltage<br />
is V peak = 16 kV and the frequency is f = 1 kHz.<br />
Comparatively to figure 3 where the conditions<br />
were V peak = 12 kV and f = 1 kHz, discharge current<br />
<strong>in</strong>creases as well as the number <strong>of</strong> Trichel pulses. In<br />
addition, a glow-like discharge component appears on the<br />
negative half-cycle. The charge-voltage curve <strong>in</strong>creases<br />
with the applied voltage.<br />
Increas<strong>in</strong>g the frequency at 2 kHz (figure 6- a)<br />
implies the <strong>in</strong>crease <strong>of</strong> the magnitude and the number <strong>of</strong><br />
discharge current pulses. A glow-like discharge<br />
component can also be observed dur<strong>in</strong>g the negative half<br />
cycle. The charge-voltage curve decreases with the<br />
frequency (figure 6-b).<br />
In the planar configuration, when the voltage is<br />
raised to V peak = 16 kV at fixed frequency <strong>of</strong> 1 kHz, the<br />
number <strong>of</strong> discharge current pulses <strong>in</strong>creases. In addition,<br />
the charge-voltage curve <strong>in</strong>creases (figure 7- a). The rise<br />
Charge (nC)<br />
-500<br />
-20<br />
0,0 0,5 1,0 1,5 2,0<br />
Time (ms)<br />
(b)<br />
500<br />
250<br />
0<br />
-250<br />
-500<br />
-20 -10 0 10 20<br />
Voltage (kV)<br />
(c)<br />
Fig. 4. Planar reactor characteristics: (a) time evolution <strong>of</strong> the<br />
discharge current, (b) time evolution <strong>of</strong> the transferred charge, and (c)<br />
charge-voltage curve. Conditions: V peak = 12 kV; f = 1 kHz; Q = 4.7<br />
L.m<strong>in</strong> -1 .
Dramane 92<br />
20<br />
20<br />
500<br />
10<br />
10<br />
250<br />
Current (mA)<br />
0<br />
-10<br />
0<br />
Voltage (kV)<br />
Charge (nC)<br />
0<br />
-10<br />
-250<br />
-20<br />
-20<br />
0,0 0,5 1,0 1,5 2,0<br />
Time (ms)<br />
(a)<br />
-500<br />
-20 -10 0 10 20<br />
Voltage (kV)<br />
(b)<br />
Fig. 5. (a) Time evolution <strong>of</strong> the discharge current. (b) Charge-voltage curve for <strong>axisymmetric</strong> reactor.<br />
Conditions: V peak = 16 kV; f = 1 kHz; Q = 4.7 L.m<strong>in</strong> -1 .<br />
20<br />
20<br />
500<br />
10<br />
10<br />
250<br />
Current (mA)<br />
0<br />
0<br />
Voltage (kV)<br />
Charge (nC)<br />
0<br />
-10<br />
-10<br />
-250<br />
-20<br />
-20<br />
0,00 0,25 0,50 0,75 1,00<br />
Time (ms)<br />
(a)<br />
-500<br />
-20 -10 0 10 20<br />
Voltage (kV)<br />
(b)<br />
Fig. 6. (a) Time evolution <strong>of</strong> the discharge current. (b) Charge-voltage curve for <strong>axisymmetric</strong> reactor.<br />
Conditions: V peak = 12 kV; f = 2 kHz; Q = 4.7 L.m<strong>in</strong> -1 .<br />
500<br />
500<br />
250<br />
250<br />
Charge (nC)<br />
0<br />
Charge (nC)<br />
0<br />
-250<br />
-250<br />
-500<br />
-20 -10 0 10 20<br />
Voltage (kV)<br />
(a)<br />
-500<br />
-20 -10 0 10 20<br />
Voltage (kV)<br />
(b)<br />
Fig. 7. Charge-voltage curve for planar reactor.<br />
(a) Conditions: V peak = 16 kV; f = 1 kHz; Q = 4.7 L.m<strong>in</strong> -1 . (b) Conditions: V peak = 12 kV; f = 2kHz; Q = 4.7 L.m<strong>in</strong> -1 .
93 International Journal <strong>of</strong> Plasma Environmental Science and Technology Vol.2, No.2, SEPTEMBER 2008<br />
C. Effect <strong>of</strong> air flow on discharge characteristics<br />
The air circulation system consists <strong>of</strong> a pressure<br />
reduc<strong>in</strong>g valve, a decicator conta<strong>in</strong><strong>in</strong>g CaSO 4 and a flow<br />
meter. The air used is provided by the compressed air<br />
network.<br />
Several flow rates were applied to the discharge but<br />
only the two extreme values will be shown, i.e. 1.6<br />
L.m<strong>in</strong> -1 and 15.8 L.m<strong>in</strong> -1 . The flow is <strong>in</strong>troduced <strong>in</strong>side<br />
the reactor first, then the voltage is quickly raised up to<br />
the desired value and the discharge is ma<strong>in</strong>ta<strong>in</strong>ed dur<strong>in</strong>g<br />
one m<strong>in</strong>ute and f<strong>in</strong>ally the discharge is stopped.<br />
Figures 8 and 9 show the waveforms <strong>of</strong> the chargevoltage<br />
curve obta<strong>in</strong>ed with two flow rates <strong>in</strong> the<br />
<strong>axisymmetric</strong> and planar configurations, respectively.<br />
When the flow rate is <strong>in</strong>creased, the discharge current<br />
decreases and the ignition voltage <strong>of</strong> the discharge<br />
<strong>in</strong>creases (figure 10). Consequently, with higher flow<br />
rates the transferred charge is lower. This effect is more<br />
pronounced <strong>in</strong> the <strong>axisymmetric</strong> configuration.<br />
The effect <strong>of</strong> the flow rate on the average power is<br />
shown on figure 11. The flow rate varies between 1.6 and<br />
Charge (nC)<br />
500<br />
250<br />
0<br />
-250<br />
1,6 L.m<strong>in</strong> -1<br />
15,8 L.m<strong>in</strong> -1<br />
Courant(mA)<br />
Fig. 10. Axisymmetric reactor characteristics: time evolution <strong>of</strong> the<br />
discharge current. Conditions: V peak = 12 kV; f = 1 kHz.<br />
Average power (W)<br />
20<br />
10<br />
0<br />
-10<br />
-20<br />
-20<br />
0,0 0,5 1,0 1,5 2,0<br />
60<br />
40<br />
20<br />
0<br />
1,6 L.m<strong>in</strong> -1<br />
15,8 L.m<strong>in</strong> -1<br />
Time(ms)<br />
Axisymmetric reactor ( 1,6 L.m<strong>in</strong> -1 )<br />
Axisymmetric reactor (15,8 L.m<strong>in</strong> -1 )<br />
Planar reactor ( 1,6 L.m<strong>in</strong> -1 )<br />
Planar reactor (15,8 L.m<strong>in</strong> -1 )<br />
8 10 12 14 16 18 20<br />
Voltage (kV)<br />
Fig. 11. Average power/voltage curve for <strong>axisymmetric</strong> and planar<br />
reactors at f = 1 kHz.<br />
20<br />
10<br />
0<br />
-10<br />
Voltage (kV)<br />
-500<br />
-20 -10 0 10 20<br />
Voltage (kV)<br />
Charge (nC)<br />
Fig. 8. Charge-voltage curve for <strong>axisymmetric</strong> reactor. Conditions:<br />
V peak = 12 kV; f = 1 kHz.<br />
500<br />
250<br />
0<br />
-250<br />
1,6 L.m<strong>in</strong> -1<br />
15,8 L.m<strong>in</strong> -1<br />
-500<br />
-20 -10 0 10 20<br />
Voltage (kV)<br />
Fig. 9. Charge-voltage curve for planar reactor, Conditions: V peak = 12<br />
kV; f = 1 kHz.<br />
15.8 L.m<strong>in</strong> -1 . A high flow rate <strong>in</strong>duces a low average<br />
power for both reactors. However, this tendency is more<br />
important with the <strong>axisymmetric</strong> reactor than the planar<br />
one.<br />
Dur<strong>in</strong>g the discharge, it seems that some charges<br />
are transported outside the plasma section because <strong>of</strong> the<br />
airflow. This phenomenon is pronounced at high flow<br />
rates and expla<strong>in</strong>s the result shown <strong>in</strong> figures 8-11. In<br />
addition, the streamers at the orig<strong>in</strong> <strong>of</strong> the filamentary<br />
discharge progress rapidly <strong>in</strong> the gap (about 10 ns). Thus,<br />
the filamentary discharge is not very affected by the<br />
velocity <strong>of</strong> the air (some m/s).<br />
IV. CONCLUSION<br />
The characteristics <strong>of</strong> the <strong>Dielectric</strong> <strong>Barrier</strong><br />
<strong>Discharge</strong> <strong>in</strong> <strong>axisymmetric</strong> and planar configurations are<br />
studied and compared by measur<strong>in</strong>g their electrical<br />
discharge parameters and the airflow <strong>in</strong>fluence on these<br />
parameters.
Dramane 94<br />
It was observed that the DBD discharge<br />
characteristics <strong>in</strong> <strong>axisymmetric</strong> configuration are<br />
different from those <strong>of</strong> the planar configuration. By<br />
modify<strong>in</strong>g the geometry <strong>of</strong> the reactors, a different<br />
discharge type can be obta<strong>in</strong>ed us<strong>in</strong>g the same electric<br />
excitation.<br />
In <strong>axisymmetric</strong> configuration, DBD discharge is<br />
rather quasi-diffuse while, <strong>in</strong> the planar one, the<br />
discharge is filamentary.<br />
The study <strong>of</strong> the <strong>in</strong>fluence <strong>of</strong> the air flow on the<br />
discharge show that discharge current, transferred charge<br />
and average power decrease with the flow rate. This<br />
evolution is more pronounced with the <strong>axisymmetric</strong><br />
reactor.<br />
Now, both reactors are go<strong>in</strong>g to be tested for<br />
particle precipitation, agglomeration or destruction.<br />
REFERENCES<br />
[1] F. S. Denes and S. Manolache, “Macromolecular plasmachemistry:<br />
an emerg<strong>in</strong>g field <strong>of</strong> polymer science”, Prog. Polym.<br />
Sci., Vol. 29, No.8, pp. 815-885, August 2004.<br />
[2] N. Gherardi and F. Mass<strong>in</strong>es, “Mechanisms controll<strong>in</strong>g the<br />
transition from glow silent discharge to streamers discharge <strong>in</strong><br />
nitrogen”, IEEE Trans. Plasma Sci., Vol. 29, No.3, pp. 536-544,<br />
2001.<br />
[3] J. H. Byeon, J. Hwang, J. H. Park, K. Y. Yoon, B. J. Ko, S. H.<br />
Kang and J. H. Ji, “Collection <strong>of</strong> submicron particles by an<br />
electrostatic precipitator us<strong>in</strong>g a dielectric barrier discharge”, J.<br />
Aerosol Sci., Vol. 37, pp. 1618-1628, November 2006.<br />
[4] S. Sato, M. Kimura, T. Aki, I. Koyamoto, K. Takashima, S. Katsua<br />
and A. Mizuno, “Removal <strong>of</strong> diesel particles us<strong>in</strong>g an electrostatic<br />
precipitator with a barrier discharge electrode as a dust pocket”,<br />
Proc. ESA/IEJ/IEEE-IAS/SFE jo<strong>in</strong>t Conference on Electrostatics<br />
2006, Berkley California, pp. 754-762, 6-9 June, 2006.<br />
[5] Y. Dan, G. Dengshan, Y. Gang, S. Xiangl<strong>in</strong> and G. Fan, “An<br />
<strong>in</strong>vestigation <strong>of</strong> the treatment <strong>of</strong> particulate matter from gasol<strong>in</strong>e<br />
eng<strong>in</strong>e exhaust us<strong>in</strong>g non-thermal plasma”, J. Hazard. Mater., Vol.<br />
B127, pp. 149-155, December 2005.<br />
[6] Z. Fang, Y. Qiu, C. Zhang, and Kuffel, “Factors <strong>in</strong>fluenc<strong>in</strong>g the<br />
existence <strong>of</strong> the homogeneous dielectric barrier discharge <strong>in</strong> air at<br />
atmospheric pressure”, J. Phys. D: Appl. Phys., Vol. 40, pp. 1401-<br />
1407, February 2007.<br />
[7] J. R. Roth, J. Rahel, X. Dai and D. M. Sherman, “The physics and<br />
phenomenology <strong>of</strong> One Atmosphere Uniform Glow <strong>Discharge</strong><br />
Plasma (OAUGDP TM ) reactor for surface treatment applications”, J.<br />
Phys. D: Appl. Phys., Vol. 38, pp. 555-567, February 2005.<br />
[8] J. Rahel and D. M. Sherman, “The transition from a filamentary<br />
dielectric barrier discharge to a diffuse barrier discharge <strong>in</strong> air at<br />
atmospheric pressure”, J. Phys. D: Appl. Phys., vol. 38, pp. 547-<br />
554, February 2005.<br />
[9] M. Abdel-Salam, A. Hashem, A. Yehia, A. Mizuno, A. Turky and<br />
A. Gabr,“Characteristics <strong>of</strong> corona and silent discharges as<br />
<strong>in</strong>fluenced by geometry <strong>of</strong> the discharge reactor”, J. Phys. D: Appl.<br />
Phys., Vol. 36, pp. 252-260, January 2003.<br />
[10] M. Petit, A. Goldman and M. Goldman, “Glow currents <strong>in</strong> a po<strong>in</strong>tto-plane<br />
dielectric barrier discharge <strong>in</strong> the context <strong>of</strong> the chemical<br />
reactivity control”, J. Phys. D: Appl. Phys., Vol. 35, pp. 2969-2977,<br />
November 2002.<br />
[11] I. Nagao, M. Nishida, K. Yukimura, S. Kambara and T. Maruyama,<br />
“NO x removal us<strong>in</strong>g nitrogen gas activated by dielectric barrier<br />
discharge at atmospheric pressure”, Vacuum, Vol. 65, No. 3-4, pp.<br />
481-487, May 2002.