Simulated Exhaust Gas Treatment by Microplasma
Simulated Exhaust Gas Treatment by Microplasma
Simulated Exhaust Gas Treatment by Microplasma

You also want an ePaper? Increase the reach of your titles
YUMPU automatically turns print PDFs into web optimized ePapers that Google loves.
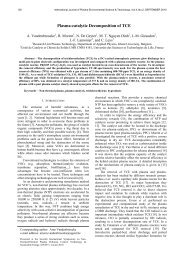
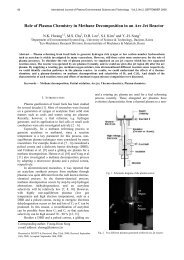
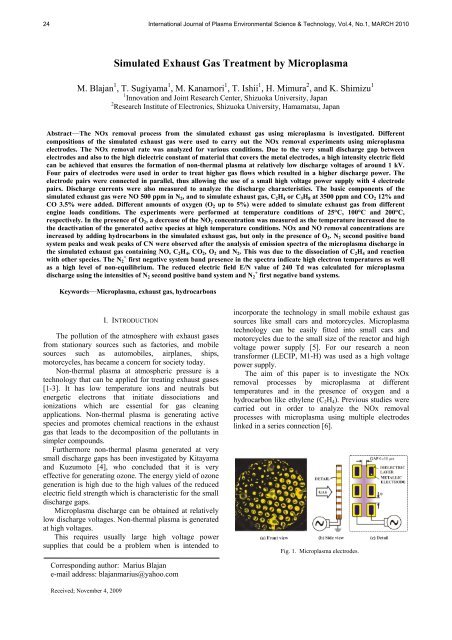
24 International Journal of Plasma Environmental Science & Technology, Vol.4, No.1, MARCH 2010<strong>Simulated</strong> <strong>Exhaust</strong> <strong>Gas</strong> <strong>Treatment</strong> <strong>by</strong> <strong>Microplasma</strong>M. Blajan 1 , T. Sugiyama 1 , M. Kanamori 1 , T. Ishii 1 , H. Mimura 2 , and K. Shimizu 11 Innovation and Joint Research Center, Shizuoka University, Japan2 Research Institute of Electronics, Shizuoka University, Hamamatsu, JapanAbstract—The NOx removal process from the simulated exhaust gas using microplasma is investigated. Differentcompositions of the simulated exhaust gas were used to carry out the NOx removal experiments using microplasmaelectrodes. The NOx removal rate was analyzed for various conditions. Due to the very small discharge gap betweenelectrodes and also to the high dielectric constant of material that covers the metal electrodes, a high intensity electric fieldcan be achieved that ensures the formation of non-thermal plasma at relatively low discharge voltages of around 1 kV.Four pairs of electrodes were used in order to treat higher gas flows which resulted in a higher discharge power. Theelectrode pairs were connected in parallel, thus allowing the use of a small high voltage power supply with 4 electrodepairs. Discharge currents were also measured to analyze the discharge characteristics. The basic components of thesimulated exhaust gas were NO 500 ppm in N 2 , and to simulate exhaust gas, C 2 H 4 or C 3 H 8 at 3500 ppm and CO 2 12% andCO 3.5% were added. Different amounts of oxygen (O 2 up to 5%) were added to simulate exhaust gas from differentengine loads conditions. The experiments were performed at temperature conditions of 25°C, 100°C and 200°C,respectively. In the presence of O 2 , a decrease of the NO 2 concentration was measured as the temperature increased due tothe deactivation of the generated active species at high temperature conditions. NOx and NO removal concentrations areincreased <strong>by</strong> adding hydrocarbons in the simulated exhaust gas, but only in the presence of O 2 . N 2 second positive bandsystem peaks and weak peaks of CN were observed after the analysis of emission spectra of the microplasma discharge inthe simulated exhaust gas containing NO, C 2 H 4 , CO 2 , O 2 and N 2 . This was due to the dissociation of C 2 H 4 and reactionwith other species. The N 2 + first negative system band presence in the spectra indicate high electron temperatures as wellas a high level of non-equilibrium. The reduced electric field E/N value of 240 Td was calculated for microplasmadischarge using the intensities of N 2 second positive band system and N 2 + first negative band systems.Keywords—<strong>Microplasma</strong>, exhaust gas, hydrocarbonsI. INTRODUCTIONThe pollution of the atmosphere with exhaust gasesfrom stationary sources such as factories, and mobilesources such as automobiles, airplanes, ships,motorcycles, has became a concern for society today.Non-thermal plasma at atmospheric pressure is atechnology that can be applied for treating exhaust gases[1-3]. It has low temperature ions and neutrals butenergetic electrons that initiate dissociations andionizations which are essential for gas cleaningapplications. Non-thermal plasma is generating activespecies and promotes chemical reactions in the exhaustgas that leads to the decomposition of the pollutants insimpler compounds.Furthermore non-thermal plasma generated at verysmall discharge gaps has been investigated <strong>by</strong> Kitayamaand Kuzumoto [4], who concluded that it is veryeffective for generating ozone. The energy yield of ozonegeneration is high due to the high values of the reducedelectric field strength which is characteristic for the smalldischarge gaps.<strong>Microplasma</strong> discharge can be obtained at relativelylow discharge voltages. Non-thermal plasma is generatedat high voltages.This requires usually large high voltage powersupplies that could be a problem when is intended toincorporate the technology in small mobile exhaust gassources like small cars and motorcycles. <strong>Microplasma</strong>technology can be easily fitted into small cars andmotorcycles due to the small size of the reactor and highvoltage power supply [5]. For our research a neontransformer (LECIP, M1-H) was used as a high voltagepower supply.The aim of this paper is to investigate the NOxremoval processes <strong>by</strong> microplasma at differenttemperatures and in the presence of oxygen and ahydrocarbon like ethylene (C 2 H 4 ). Previous studies werecarried out in order to analyze the NOx removalprocesses with microplasma using multiple electrodeslinked in a series connection [6].Fig. 1. <strong>Microplasma</strong> electrodes.Corresponding author: Marius Blajane-mail address: blajanmarius@yahoo.comReceived; November 4, 2009
26 International Journal of Plasma Environmental Science & Technology, Vol.4, No.1, MARCH 2010<strong>Gas</strong>CompositionTABLE IGAS COMPOSITION FOR ANALYZINGTHE GAS TEMPERATURE EFFECTC 2 H 4(ppm)C 3 H 8(ppm)GAS COMPONENTSNO(ppm)CO 2(%)CO(%)No.1 3500 - 500 - - balanceNo. 2 - - 500 12 3.5 balanceNo. 3 3500 - 500 12 3.5 balanceNo. 4 - 3500 500 12 3.5 balanceN 2Fig. 4. Waveforms of the discharge voltage and discharge currentfor 4 pairs of electrodes with a discharge gap of 0 µm.Discharge Current (mA)6050403020100Discharge CurrentDischarge Power0.4 0.5 0.6 0.7 0.8 0.9 1 1.1 1.2 1.3Discharge Voltage (kV)Fig. 5. Discharge current and discharge power versus dischargevoltage for 4 pairs of electrodes with a discharge gap of 0 µm.Discharge power was 13.1 W at 1 kV for 4 pairs ofelectrodes according to Fig. 5. At a gas flow rate of 2L/min the value of SIE is 13.1/0.033 = 393 J/L and itresults in an average value of 98.3 J/L per pair ofelectrodes.III. NOX REMOVAL PROCESS4035302520151050Discharge Power (W)NOx Removal Concentration (ppm)NO2 Concentration (ppm)18016014012010080604020030252015105025°C100°C200°CNo. 1 No. 2 No. 3 No. 425°C100°C200°C<strong>Gas</strong> CompositionNo. 1 No. 2 No. 3 No. 4<strong>Gas</strong> Compositiona.b.A. Influence of temperature on NOx removal processNOx removal concentration is affected <strong>by</strong> changingthe temperature of the gases. In this paper NOxrepresents the sum of NO and NO 2 . The NOx analyzerwas set to measure NOx concentration and NOconcentration in ppm. During the microplasma on timeboth the NOx and NO removal are measured thus NOxand NO values are subtracted from the initial values andthe resulted values are NOx removal concentration andNO removal concentration. After the microplasma ontime NO 2 is generated <strong>by</strong> the oxidation of NO to NO 2 .Subtracting the NO concentration from the NOxconcentration provides the figure for the generated NO 2concentration.Compositions of the gases used in the experimentsare shown in Table I. The temperature of the gas was setto 25 °C, 100 °C and 200 °C, respectively. No oxygenwas used in these experiments. The gas flow rate was 2L/min.Fig. 6. NOx removal concentration and generated NO 2concentration for gas compositions No. 1, No. 2, No. 3 and No. 4 at2 L/min gas flow rate and different temperatures.NOx removal concentrations are higher for the gascompositions No. 1 and No. 2 and are increasing with theincreases of gas temperature (Fig. 6.a). At 200 °C,removal concentrations of 148 ppm and 110 ppm weremeasured, respectively. Almost the same values of NOxremoval concentrations were measured for the gascompositions No.3 and No. 4 at all temperatures.NO removal concentration has a similar trend as NOxremoval process but with the increase of gas temperaturethe NO removal concentration increases also for the gascompositions No. 3 and No. 4.Generated NO 2 concentration increases with theincrease of gas temperature, as clearly shown in Fig. 6.b.The lowest value of 8 ppm was measured for gascomposition No. 3 and No. 4 at 25 °C.
Blajan et al. 27When no CO 2 was used (gas composition No. 1), theNOx removal concentrations were higher [9], [10], [11]:42e N e N(S) N() (2)2D2 N D) N2 ONO ( (3)(k = 7 x 10 -11 cm 3 /s)CO N( 42S) NO CO (4)(k = 1.07 x 10 -15 cm 3 /s)With the increase of the discharge voltage, the intensityof electric field increases. Consequently the electronenergy thus is achieved from the dissociation energy fornitrogen at 9 eV. The reduction of NO to N 2 is mainlyrealized <strong>by</strong> reaction (3). According to reactions (2) and(4), CO 2 reacts with N( 4 S), which is a ground statenitrogen atom, resulting in NO and CO.B. Influence of C 2 H 4 and O 2 on NOx removal processThe gas compositions presented in Table II wereused, the gas flow rate was set at 2 L/min and all theexperiments were performed at 25 °C gas temperature.The values of NOx removal concentration, NOremoval concentration and NO2 concentration versusdischarge voltage for the gas compositions A1, A2, A3and A4 that do not contain C 2 H 4 , are shown in Fig. 7.NOx removal concentration presented in Fig. 7.ashows higher values for the gases with lowerconcentrations of O 2 in their composition. NOx removalconcentration increases with the increase of the dischargevoltage. NOx removal concentration of 194 ppm wasmeasured at 1.2 kV for the A1 composition and 189 ppmfor A2 gas composition, respectively.NO removal concentration can be calculated as perFig. 7 <strong>by</strong> subtracting the values of generated NO 2 fromNOx removal concentration curves.The same trends for NO removal concentrationsversus discharge voltage result at different O 2concentrations from that of NOx removal concentration.The highest value of 198 ppm was measured for thegas composition with 1 % O 2 amount at 1.2 kV dischargevoltage.NO 2 concentration presented in Fig. 7.b shows athigher discharge voltages an increase for the gascomposition with 5 % O 2 . This could be explained <strong>by</strong> thereaction of NO with ozone [9]:31e O2 e O(P) O(D)(5)O O2M O3 M(6)(k = 6 x 10 -34 at 27 °C, and k = 2.11 x 10 -34 at 200 °C)NO O3 NO2 O2(7)(k = 1.8 x 10 -14 at 27 °C, and k = 9.94 x 10 -14 at 200 °C)Lower values for the NOx removal concentration athigher concentrations of O 2 are due to the reactions (5),(6) and (7) that are increasing the oxidation process ofNO to NO 2 .Dissociation energy for nitrogen is 9 eV and foroxygen is 5-6 eV. The intensity of the electric fieldincreases commensurate with the increase of dischargevoltage. Consequently, electrons will achieve higherTABLE IIGAS COMPOSITION FOR ANALYZING THE INFLUENCE OF O 2 ANDHYDROCARBONS ON NOx REMOVAL PROCESSGAS COMPOSITIONComp.A1 A2 A3 A4 B1 B2 B3 B4C 2 H 4(ppm)- - - - 3500 3500 3500 3500NO(ppm)500 500 500 500 500 500 500 500CO 2(%)12 12 12 12 12 12 12 12O 2(%)0 1 2 5 0 1 2 5N 2 balance balanceNOx Removal Concentration(ppm)NO2 Concentration (ppm)300250200150100500140120100806040200a.<strong>Gas</strong> Composition A1<strong>Gas</strong> Composition A2<strong>Gas</strong> Composition A3<strong>Gas</strong> Composition A40.5 0.6 0.7 0.8 0.9 1 1.1 1.2 1.3<strong>Gas</strong> Composition A1<strong>Gas</strong> Composition A2<strong>Gas</strong> Composition A3<strong>Gas</strong> Composition A4b.Discharge Voltage (kV)0.5 0.6 0.7 0.8 0.9 1 1.1 1.2 1.3Discharge Voltage (kV)Fig. 7. NOx removal concentration and generated NO 2concentration versus discharge voltage for gas compositions A1,A2, A3 and A4.energies in order to dissociate nitrogen. Thus at higherdischarge voltages the atomic nitrogen will react withNO and reduce it to N 2 . Oxygen will dissociate andproduce ozone that will also oxidize NO to NO 2 at highervoltages as per reactions (5), (6) and (7).NOx removal concentration versus discharge voltagefor the gas compositions B1, B2, B3 and B4 are shown inFig. 8.a.The highest and the lowest values of NOx removalconcentrations of 287 and 133 ppm were obtained for thegas composition with 2 % O 2 and with 5 %, respectively.NO removal concentration increases in the presenceof C 2 H 4 with the increase of O 2 content. At 1.2 kVdischarge voltage a NO removal concentration of 287ppm was measured for the gas composition B3.The measured NOx removal concentration values forthe gas composition with 5 % O 2 are lower due to the
28 International Journal of Plasma Environmental Science & Technology, Vol.4, No.1, MARCH 2010higher amount of NO 2 produced after the microplasmatreatment (Fig. 8.b).In absence of H 2 O and in the presence of C 2 H 4 thereactions in the microplasma reactor are [12], [13]:12O( D) C H OH() C H (8)2C H 3 O 2HCO ONO HO4 HCHO HCO CO NO OH2(9) (10)2HO 222(11)(k = 8.23 x 10 -12 cm 3 /s at 27 °C and k = 6.15 x 10 -12 cm 3 /sat 200 °C)In the presence of C 2 H 4 the oxidation of NO to NO 2is realized not only <strong>by</strong> the reaction (7) but also <strong>by</strong> thereaction (11). The rate constant for the reaction 11 ishigher than for the reaction 7. Thus the oxidation of NOto NO 2 is realized mainly through the reaction (11) whichhas an important role in improving the NO removalconcentration.<strong>Gas</strong> composition B4 was heated at 200 °C andtreated <strong>by</strong> microplasma. NOx removal concentration, NOremoval concentration and NO 2 concentration versusdischarge voltage at 2 L/min gas flow rate are shown inFig. 9.At 1 kV discharge voltage 119 ppm NOx removalconcentration, 176 ppm NO removal concentration and57 ppm NO 2 concentration were obtained. In comparisonwith the results obtained for the same gas composition at1 kV discharge voltage and 25 °C, the NOx and NOremoval efficiencies are higher with 61 % and 13 %,respectively, at 200 °C, and the NO 2 concentration islower with 34 %.At higher temperatures the characteristics of thedielectric layer are changing. Thus discharge power anddischarge currents have greater values and the NOx andNO removal concentrations are increasing [14].Lower NO 2 concentration for the gas temperature200°C could be explained <strong>by</strong> the destruction of O 3 athigh temperatures <strong>by</strong> the following reaction:O O (12)32O 2(k = 7.96 x 10 -15 cm 3 /s at 25 °C and 1.03 x 10 -13 cm 3 /s at200 °C)The rate constant at 25 °C is k = 7.96 x 10 -15 cm 3 /sand at 200°C is k = 1.03 x 10 -13 cm 3 /s. Thus the oxidationprocess of NO to NO 2 <strong>by</strong> reaction (7) could be decreased.IR spectrum of the untreated gas and treated gas at800 V and 1000 V in the microplasma reactor and at atemperature of 200 °C is shown in Fig. 10. In Fig. 10.aspectra represent HCHO wavenumbers, formaldehydebeing a <strong>by</strong>product as per (9).CO was also discovered as a <strong>by</strong>product (Fig. 10.b) asa result of reactions (2) and (4), and N 2 O (Fig. 10.c) asthe results of the following reactions [15], [16]:N2 O2 N2O O(13)NO2 N N2O O(14)23NOx Removal Concentration(ppm)NO2 Concentration (ppm)300250200150100500140120100806040200<strong>Gas</strong> Composition B1<strong>Gas</strong> Composition B2<strong>Gas</strong> Composition B3<strong>Gas</strong> Composition B4a.0.5 0.6 0.7 0.8 0.9 1 1.1 1.2 1.3b.Discharge Voltage (kV)<strong>Gas</strong> Composition B1<strong>Gas</strong> Composition B2<strong>Gas</strong> Composition B3<strong>Gas</strong> Composition B40.5 0.6 0.7 0.8 0.9 1 1.1 1.2 1.3Discharge Voltage (kV)Fig. 8. NOx removal concentration and generated NO 2concentration versus discharge voltage for gas compositions B1, B2,B3 and B4.NOx and NO RemovalConcentration (ppm)300250200150100500NOxNONO20.5 0.6 0.7 0.8 0.9 1 1.1Discharge Voltage (kV)Fig. 9. NOx and NO removal concentrations and generated NO 2concentration versus discharge voltage for the gas composition B4at 200°C and 2 L/min gas flow rate.C. Emission spectrometry of microplasmaA microplasma diagnosis was performed <strong>by</strong> usingthe discharge gas with composition NO 500 ppm, C 2 H 43500 ppm, CO 2 12 %, O 2 5 % and N 2 balance.<strong>Microplasma</strong> electrodes are placed inside a box with aquartz window and the gap between electrodes is set at50 µm. An experimental Marx Generator with MOSFETswitches which generate output voltages up to -1.8 kV(negative pulse, width 1 µs) and frequency of 1 kHz wasused to energize the electrodes.Emission spectra were measured <strong>by</strong> an ICCD camera(SMCP, ICCD1024 HAM-NDS/UV) and a spectrometer(VIS 351). A pulse generator (Tektronix, AFG 3021B)was used to trigger the Marx Generator and the ICCDcamera. The obtained data were transferred to a computer.6050403020100NO2 Concentration (ppm)
Blajan et al. 29Absorbance (a.u.)HCHOa.1000 V800 VNo dischargeWavenumber (cm -1 )Absorbance (a.u.)800 VN 2 OCOb.1000 VNo dischargeFig. 11. Optical emission spectra of the microplasma discharge in thegas composition NO 500 ppm, C 2 H 4 3500 ppm, CO 2 12 %, O 2 5 % andN 2 balance.TABLE IIILIST OF DETECTED PEAKS BY EMISSION SPECTROMETRYSpecies (system) Transition Peak Position (nm)N 2 second positive C 3 Π→B 3 Π296; 315; 337.7; 357.7;375.5; 380.5; 400N + 2 first negative B 2 Σ + u →X 2 +Σ g 427.8CN violet system B 2 Σ→A 2 Π 388.3Absorbance (a.u.)No dischargeWavenumber (cm -1 )N 2 O800 V1000 VWavenumber (cm -1 )Fig. 10. FTIR spectrum before and after microplasma treatment ofthe gas composition NO 500 ppm, C 2 H 4 3500 ppm, CO 2 12 %, O 25 % and N 2 balance at 200 °C.Discharge voltage and the corresponding dischargecurrent were measured <strong>by</strong> a high voltage probe(Tektronix, P6015), an AC current transformer(Tektronix, P6021), and a digital oscilloscope (Tektronix,TDS 2014B).Optical emission spectra of microplasma discharge ata discharge voltage of -1.8 kV peak and a correspondingcurrent of -4.5 A peak are shown in Fig. 11. Major activespecies are N 2 second positive band system. Alsodetected were N +2 first negative band system and CNviolet system (Table III).High ratio C 2 H 4 /NO = 7 favored the conversion ofNO, as well as the presence of O 2 oxidized NO molecules.That could explain the absence of NO γ band from thespectra.c.Excited N 2 is consumed <strong>by</strong> colliding with NO andreducing or transferring energy. NO conversion isenhanced <strong>by</strong> dissociating C 2 H 4 into active species,leading it to react with NO and to form highly stableproducts like N 2 , CO and CO 2 [17]. A large amount ofC 2 H 4 is dissociated and reacts with other species in themicroplasma, thus resulting in the weak peaks ofintensities of CN.N +2 first negative system band presence in thespectra indicates high electron temperatures as well as ahigh level of non-equilibrium. The ratio between theintensities of light for first negative system of nitrogenN + 2 IB (λ = 391.5 nm) and second positive system ofnitrogen N 2 IC (λ = 337.1 nm) depends upon the reducedelectric field strength E/N, where E is the intensity ofelectric field and N the concentration of neutral particles[18]. The calculated ratio for the spectra presented in Fig.11 IB/IC = 0.02 corresponds to a value of reducedelectric field strength of 240 Td according with [18]. Thereduced electric field strength high value is specific foratmospheric pressure non thermal plasma at narrowdischarge gaps [4], and could favor the production ofhigh energy electrons necessary for the dissociation ofmolecular nitrogen and oxygen.The reduced electric field can be correlated with theaverage electron energy according to the relation:E e Te (15)N en12where σ en is the cross section of electron-neutralcollisions and factor δ characterizes the fraction of anelectron energy lost in a collision with a neutral particle[19]. The value of δ ≈ 3 x 10 −3 in typical conditions ofnon-equilibrium discharges in nitrogen [19] and the value
30 International Journal of Plasma Environmental Science & Technology, Vol.4, No.1, MARCH 2010of σ en is 8.20 x 10 -16 cm 2 [20]. At a value of reducedelectric field of 240 Td and according with relation (15)it is obtained a value of average electron energy of 27.3eV.IV. CONCLUSION<strong>Microplasma</strong> was generated only around 1 kV with 4pairs of electrodes. Each electrode pair was connected inparallel to keep the discharge voltage low. The simulatedexhaust gas has hydrocarbons at relatively highconcentration and low O 2 concentration.The following conclusions were obtained <strong>by</strong> series ofexperiments:1) NOx and NO removal concentrations values werehigher for the gas composition that contains C 2 H 4 and noCO 2 and CO <strong>by</strong> analyzing the microplasma treatmentprocess for 4 gases compositions in the absence of O 2 .2) NOx and NO removal concentrations and NO 2concentration are increasing in the absence of O 2 andwith the increase of gas temperature.3) NOx and NO removal concentrations increasedwith the addition of C 2 H 4 in the gas composition but onlyin the presence of O 2 . By adding C 2 H 4 3500 ppm wasmeasured the highest NOx removal concentration of 287ppm in comparison with 198 ppm without C 2 H 4 at 1.2 kVdischarge voltage. Maximal value of NO removalconcentration was 197 ppm without hydrocarbons and287 ppm with the addition of C 2 H 4 at 1.2 kV dischargevoltage.4) NOx and NO removal concentration increase <strong>by</strong>61% and 13% respectively in the presence of O 2 andC 2 H 4 and with the increase of gas temperature to 200 °C.Also the generated NO 2 concentration is lower <strong>by</strong> 34% incomparison with rate at 25°C. Due to the destruction ofO 3 at higher temperatures the oxidation of NO producesfewer quantities of NO 2 .5) HCHO, CO and N 2 O are confirmed as <strong>by</strong>productsof the microplasma treatment.6) Emission spectrometry analysis shows thepresence of N 2 second positive band system peaks andweak peaks of intensities of CN due to the dissociation ofC 2 H 4 and reaction with other species. The value ofreduced electric field strength was 240 Td according tothe ratio between the intensities of light for first negativesystem of nitrogen N 2 + IB (λ = 391.5 nm) and secondpositive system of nitrogen N 2 IC (λ = 337.1 nm).gaseous pollutants,” Non-Thermal Plasma Techniques forPollution Control, NATO ASI Ser. 34, Part B, Springer-VerlagPub., Oxford, pp. 165-185, 1993.[4] J. Kitayama and M. Kuzumoto, “Analysis of ozone generationfrom air in silent discharge,” Journal of Physics D: AppliedPhysics, vol. 32, pp. 3032-3040, 1999.[5] K. Shimizu, T. Sugiyama, and M. N. L. Samaratunge, “Study ofair pollution control <strong>by</strong> using micro plasma filter,” IEEETransactions on Industry Application, vol. 44, pp. 68-73, 2008[6] K. Shimizu, T. Sugiyama, M. N. L. Samaratunge, and M.Kanamori, “Application of micro plasma for NOx removal,”IEEE Transactions on Industry Application, vol. 45, pp. 1506-1512, 2009.[7] L. Dascalescu, An Introduction to Ionized <strong>Gas</strong>es. Theory andApplications. Toyohashi University of Technology, 1993.[8] S. Sato, M. Kimura, T. Aki, I. Koyamoto, K. Takashima, S.Katsura, and A. Mizuno, “Removal of diesel particles using anelectrostatic precipitator with barrier discharge electrode as adust pocket,” in Proc. of ESA/IEJ/IEEE-IA/SFE Joint Conferenceon Electrostatics 2006, vol. 2, pp. 754-761, Berkeley, CA, 2006.[9] C. R. McLarnon and B. M. Penetrante, “Effect of gas compositionon the NOx conversion chemistry in plasma,” presented atSociety of Automotive Engineers, Fall Fuels and LubricantsMeeting, San Francisco, CA, 1998.[10] C. Sutherland and J. Zinn, “Chemistry computation for irradiatedhot air,” Los Alamos Scientific Laboratory Informal Report LA-6055-MS, Los Alamos, 1975.[11] C. Lin and F. Kaufman, “Reactions of metastable nitrogen atoms,”Journal of Chemical Physics, vol. 55, pp. 3760-3770, 1971.[12] H. Tsurumaki, Y. Fujimura, and O. Kajimoto, “Stereodynamics ofthe reactions of O( 1 D) with C 2 H 4 and C 2 H 6 ,” Chemical PhysicsLetters, vol. 301, pp. 145-152, 1999.[13] N. Marinov, R. Steele, P. Malte, and M. Hori, “The NO to NO 2conversion <strong>by</strong> ethylene oxidation,” presented at Twenty-FifthInternational Symposium on Combustion, Irvine, CA, 1994.[14] K. Shimizu, T. Sugiyama, M. Kanamori, and M. Blajan, “Effect ofgas temperature and electrode configuration on NOx removal <strong>by</strong>microplasma,” in Proc. 6th Conference of the FrenchElectrostatic Society, pp. 341-346, Paris, 2008.[15] U. Kogelschatz, “Dielectric-barrier discharges: their history,discharge physics, and industrial applications,” PlasmaChemistry and Plasma Processing, vol. 23, pp. 1-46, 2003.[16] D. L. Baulch, R.A. Cox, R. F. Hampson Jr., J. A. Kerr, J. Troe,and R. T. Watson, “Evaluated kinetic and photochemical data foratmospheric chemistry,” J. Phys. Chem. Ref. Data, vol. 9, pp.295-471, 1980.[17] C. H. Tsai, Y. F. Wang, H. H. Yang, and C. N. Liao, “Effects ofethylene on NO conversion and product distributions in a rfdischarge reactor,” Journal of Hazardous Materials, vol. 150, pp.404-407, 2008.[18] K. V. Kozlov, H. –E. Wagner, R. Brandenburg, and P. Michel,“Spatio-temporally resolved spectroscopic diagnostics of thebarrier discharge in air at atmospheric pressure,” Journal ofPhysics D: Applied Physics, vol. 34, pp. 3164-3176, 2001.[19] A. Fridman, Plasma Chemistry, Cambridge University Press,Cambridge, UK, 2008.[20] Y. Itikawa, “Cross Sections for Electron Collisions with NitrogenMolecules,” J. Phys. Chem. Ref. Data, vol. 35, pp. 31-54, 2005.REFERENCES[1] J. S. Clements, A. Mizuno, W. C. Finney, and R. H. Davis,“Combined removal of SO 2 and NOx and fly ash from flue gasusing pulsed streamer corona,” IEEE Transactions on IndustryApplication, vol. 25, pp. 62-69, 1989.[2] S. Masuda and. H. Nakao, “Control of NOx <strong>by</strong> positive andnegative pulsed corona discharges,” IEEE Transactions onIndustry Application, vol. 26, pp. 374-383, 1990.[3] A. Mizuno, A. Chakrabarti, and K. Okazaki, “Application ofcorona technology in the reduction of greenhouse gases and other