Simulated Exhaust Gas Treatment by Microplasma
Simulated Exhaust Gas Treatment by Microplasma
Simulated Exhaust Gas Treatment by Microplasma

You also want an ePaper? Increase the reach of your titles
YUMPU automatically turns print PDFs into web optimized ePapers that Google loves.
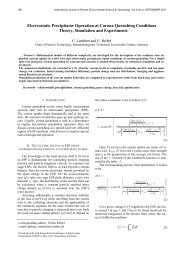
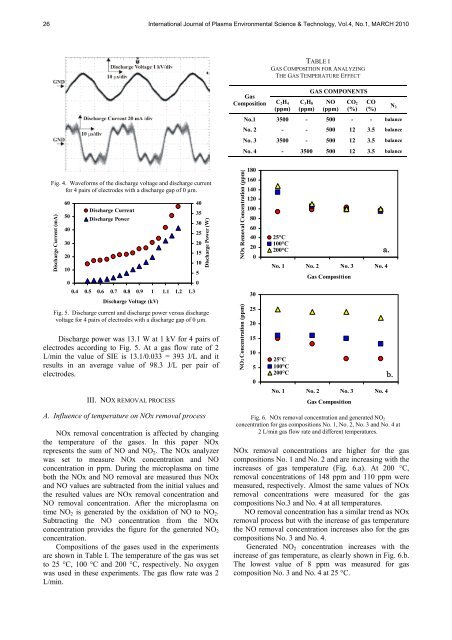
26 International Journal of Plasma Environmental Science & Technology, Vol.4, No.1, MARCH 2010<strong>Gas</strong>CompositionTABLE IGAS COMPOSITION FOR ANALYZINGTHE GAS TEMPERATURE EFFECTC 2 H 4(ppm)C 3 H 8(ppm)GAS COMPONENTSNO(ppm)CO 2(%)CO(%)No.1 3500 - 500 - - balanceNo. 2 - - 500 12 3.5 balanceNo. 3 3500 - 500 12 3.5 balanceNo. 4 - 3500 500 12 3.5 balanceN 2Fig. 4. Waveforms of the discharge voltage and discharge currentfor 4 pairs of electrodes with a discharge gap of 0 µm.Discharge Current (mA)6050403020100Discharge CurrentDischarge Power0.4 0.5 0.6 0.7 0.8 0.9 1 1.1 1.2 1.3Discharge Voltage (kV)Fig. 5. Discharge current and discharge power versus dischargevoltage for 4 pairs of electrodes with a discharge gap of 0 µm.Discharge power was 13.1 W at 1 kV for 4 pairs ofelectrodes according to Fig. 5. At a gas flow rate of 2L/min the value of SIE is 13.1/0.033 = 393 J/L and itresults in an average value of 98.3 J/L per pair ofelectrodes.III. NOX REMOVAL PROCESS4035302520151050Discharge Power (W)NOx Removal Concentration (ppm)NO2 Concentration (ppm)18016014012010080604020030252015105025°C100°C200°CNo. 1 No. 2 No. 3 No. 425°C100°C200°C<strong>Gas</strong> CompositionNo. 1 No. 2 No. 3 No. 4<strong>Gas</strong> Compositiona.b.A. Influence of temperature on NOx removal processNOx removal concentration is affected <strong>by</strong> changingthe temperature of the gases. In this paper NOxrepresents the sum of NO and NO 2 . The NOx analyzerwas set to measure NOx concentration and NOconcentration in ppm. During the microplasma on timeboth the NOx and NO removal are measured thus NOxand NO values are subtracted from the initial values andthe resulted values are NOx removal concentration andNO removal concentration. After the microplasma ontime NO 2 is generated <strong>by</strong> the oxidation of NO to NO 2 .Subtracting the NO concentration from the NOxconcentration provides the figure for the generated NO 2concentration.Compositions of the gases used in the experimentsare shown in Table I. The temperature of the gas was setto 25 °C, 100 °C and 200 °C, respectively. No oxygenwas used in these experiments. The gas flow rate was 2L/min.Fig. 6. NOx removal concentration and generated NO 2concentration for gas compositions No. 1, No. 2, No. 3 and No. 4 at2 L/min gas flow rate and different temperatures.NOx removal concentrations are higher for the gascompositions No. 1 and No. 2 and are increasing with theincreases of gas temperature (Fig. 6.a). At 200 °C,removal concentrations of 148 ppm and 110 ppm weremeasured, respectively. Almost the same values of NOxremoval concentrations were measured for the gascompositions No.3 and No. 4 at all temperatures.NO removal concentration has a similar trend as NOxremoval process but with the increase of gas temperaturethe NO removal concentration increases also for the gascompositions No. 3 and No. 4.Generated NO 2 concentration increases with theincrease of gas temperature, as clearly shown in Fig. 6.b.The lowest value of 8 ppm was measured for gascomposition No. 3 and No. 4 at 25 °C.