DraftMitigation .pdf - New York-New Jersey Harbor Estuary Program
DraftMitigation .pdf - New York-New Jersey Harbor Estuary Program
DraftMitigation .pdf - New York-New Jersey Harbor Estuary Program

You also want an ePaper? Increase the reach of your titles
YUMPU automatically turns print PDFs into web optimized ePapers that Google loves.
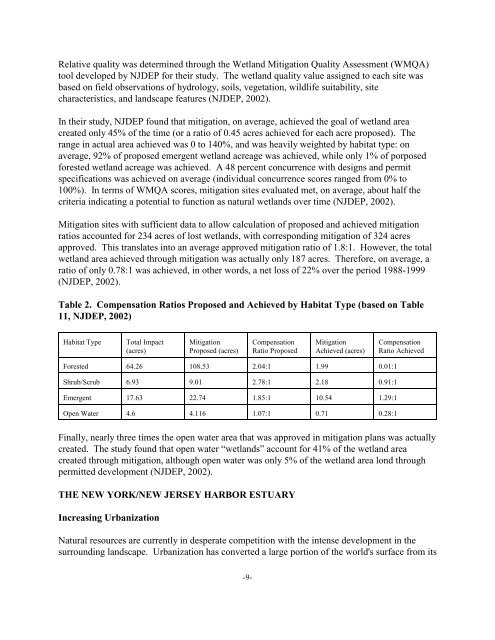
Relative quality was determined through the Wetland Mitigation Quality Assessment (WMQA)<br />
tool developed by NJDEP for their study. The wetland quality value assigned to each site was<br />
based on field observations of hydrology, soils, vegetation, wildlife suitability, site<br />
characteristics, and landscape features (NJDEP, 2002).<br />
In their study, NJDEP found that mitigation, on average, achieved the goal of wetland area<br />
created only 45% of the time (or a ratio of 0.45 acres achieved for each acre proposed). The<br />
range in actual area achieved was 0 to 140%, and was heavily weighted by habitat type: on<br />
average, 92% of proposed emergent wetland acreage was achieved, while only 1% of porposed<br />
forested wetland acreage was achieved. A 48 percent concurrence with designs and permit<br />
specifications was achieved on average (individual concurrence scores ranged from 0% to<br />
100%). In terms of WMQA scores, mitigation sites evaluated met, on average, about half the<br />
criteria indicating a potential to function as natural wetlands over time (NJDEP, 2002).<br />
Mitigation sites with sufficient data to allow calculation of proposed and achieved mitigation<br />
ratios accounted for 234 acres of lost wetlands, with corresponding mitigation of 324 acres<br />
approved. This translates into an average approved mitigation ratio of 1.8:1. However, the total<br />
wetland area achieved through mitigation was actually only 187 acres. Therefore, on average, a<br />
ratio of only 0.78:1 was achieved, in other words, a net loss of 22% over the period 1988-1999<br />
(NJDEP, 2002).<br />
Table 2. Compensation Ratios Proposed and Achieved by Habitat Type (based on Table<br />
11, NJDEP, 2002)<br />
Habitat Type<br />
Total Impact<br />
(acres)<br />
Mitigation<br />
Proposed (acres)<br />
Compensation<br />
Ratio Proposed<br />
Mitigation<br />
Achieved (acres)<br />
Compensation<br />
Ratio Achieved<br />
Forested 64.26 108.53 2.04:1 1.99 0.01:1<br />
Shrub/Scrub 6.93 9.01 2.78:1 2.18 0.91:1<br />
Emergent 17.63 22.74 1.85:1 10.54 1.29:1<br />
Open Water 4.6 4.116 1.07:1 0.71 0.28:1<br />
Finally, nearly three times the open water area that was approved in mitigation plans was actually<br />
created. The study found that open water “wetlands” account for 41% of the wetland area<br />
created through mitigation, although open water was only 5% of the wetland area lond through<br />
permitted development (NJDEP, 2002).<br />
THE NEW YORK/NEW JERSEY HARBOR ESTUARY<br />
Increasing Urbanization<br />
Natural resources are currently in desperate competition with the intense development in the<br />
surrounding landscape. Urbanization has converted a large portion of the world's surface from its<br />
-9-