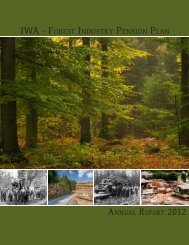
Annual Report 2010 - IWA Forest Industry Pension Plan
Annual Report 2010 - IWA Forest Industry Pension Plan
Annual Report 2010 - IWA Forest Industry Pension Plan

Create successful ePaper yourself
Turn your PDF publications into a flip-book with our unique Google optimized e-Paper software.
<strong>Plan</strong>’s Financial Position<br />
Solvency Liability<br />
Solvency is the ability of a plan to pay its obligations assuming that the plan is wound up on the date of the valuation. The <strong>Pension</strong><br />
Benefits Standards Act of British Columbia regulates pension plans for solvency requirements. “Solvency valuations” are filed every<br />
three years with the Financial Institutions Commission of BC.<br />
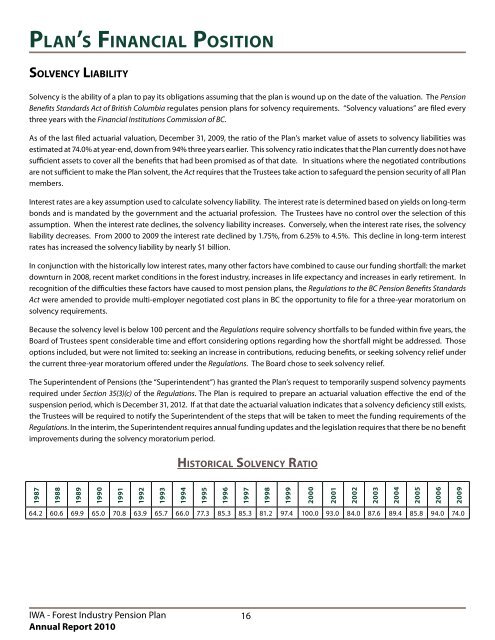
As of the last filed actuarial valuation, December 31, 2009, the ratio of the <strong>Plan</strong>’s market value of assets to solvency liabilities was<br />
estimated at 74.0% at year-end, down from 94% three years earlier. This solvency ratio indicates that the <strong>Plan</strong> currently does not have<br />
sufficient assets to cover all the benefits that had been promised as of that date. In situations where the negotiated contributions<br />
are not sufficient to make the <strong>Plan</strong> solvent, the Act requires that the Trustees take action to safeguard the pension security of all <strong>Plan</strong><br />
members.<br />
Interest rates are a key assumption used to calculate solvency liability. The interest rate is determined based on yields on long-term<br />
bonds and is mandated by the government and the actuarial profession. The Trustees have no control over the selection of this<br />
assumption. When the interest rate declines, the solvency liability increases. Conversely, when the interest rate rises, the solvency<br />
liability decreases. From 2000 to 2009 the interest rate declined by 1.75%, from 6.25% to 4.5%. This decline in long-term interest<br />
rates has increased the solvency liability by nearly $1 billion.<br />
In conjunction with the historically low interest rates, many other factors have combined to cause our funding shortfall: the market<br />
downturn in 2008, recent market conditions in the forest industry, increases in life expectancy and increases in early retirement. In<br />
recognition of the difficulties these factors have caused to most pension plans, the Regulations to the BC <strong>Pension</strong> Benefits Standards<br />
Act were amended to provide multi-employer negotiated cost plans in BC the opportunity to file for a three-year moratorium on<br />
solvency requirements.<br />
Because the solvency level is below 100 percent and the Regulations require solvency shortfalls to be funded within five years, the<br />
Board of Trustees spent considerable time and effort considering options regarding how the shortfall might be addressed. Those<br />
options included, but were not limited to: seeking an increase in contributions, reducing benefits, or seeking solvency relief under<br />
the current three-year moratorium offered under the Regulations. The Board chose to seek solvency relief.<br />
The Superintendent of <strong>Pension</strong>s (the “Superintendent”) has granted the <strong>Plan</strong>’s request to temporarily suspend solvency payments<br />
required under Section 35(3)(c) of the Regulations. The <strong>Plan</strong> is required to prepare an actuarial valuation effective the end of the<br />
suspension period, which is December 31, 2012. If at that date the actuarial valuation indicates that a solvency deficiency still exists,<br />
the Trustees will be required to notify the Superintendent of the steps that will be taken to meet the funding requirements of the<br />
Regulations. In the interim, the Superintendent requires annual funding updates and the legislation requires that there be no benefit<br />
improvements during the solvency moratorium period.<br />
Historical Solvency Ratio<br />
1987<br />
1988<br />
1989<br />
1990<br />
1991<br />
1992<br />
1993<br />
1994<br />
1995<br />
1996<br />
1997<br />
1998<br />
1999<br />
2000<br />
2001<br />
2002<br />
2003<br />
2004<br />
2005<br />
2006<br />
2009<br />
64.2 60.6 69.9 65.0 70.8 63.9 65.7 66.0 77.3 85.3 85.3 81.2 97.4 100.0 93.0 84.0 87.6 89.4 85.8 94.0 74.0<br />
<strong>IWA</strong> - <strong>Forest</strong> <strong>Industry</strong> <strong>Pension</strong> <strong>Plan</strong><br />
<strong>Annual</strong> <strong>Report</strong> <strong>2010</strong><br />
16