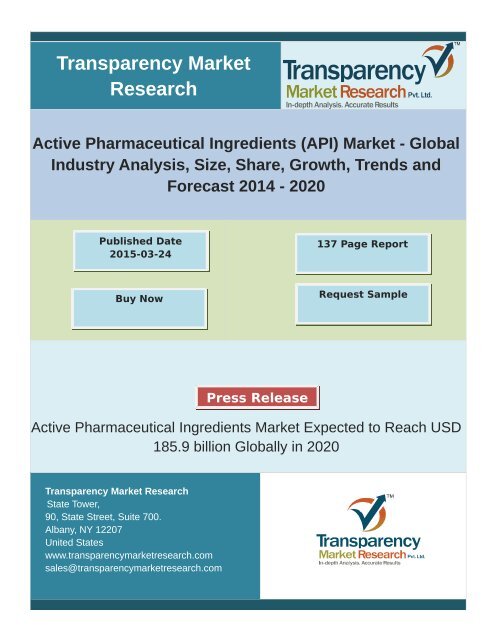
Active Pharmaceutical Ingredients (API) Market - Global Industry Analysis, Size, Share, Growth, Trends and Forecast 2014 – 2020
According to the World Health Organization (WHO), in 2012, cancer was among the leading causes of morbidity and mortality worldwide, with approximately 14 million newly diagnosed cases and 8.2 million cancer-related deaths. Therefore, the oncology segment is expected to be fastest growing segment in the global API market. Moreover, most of the drugs in this segment contain High Potency Active Pharmaceutical Ingredients (HPAPIs) which itself is a rapidly growing segment in the global API market. The market growth of this segment will be particularly higher than other segments owing to loss of patent protection for blockbuster drugs such as Herceptin (Roche), Arimidex (AstraZeneca), Xeloda (Roche), Abraxane (Celgene), Temodar (Merck & Co.) and Vidaza (Celgene) between 2010 and 2014.
According to the World Health Organization (WHO), in 2012, cancer was among the leading causes of morbidity and mortality worldwide, with approximately 14 million newly diagnosed cases and 8.2 million cancer-related deaths. Therefore, the oncology segment is expected to be fastest growing segment in the global API market. Moreover, most of the drugs in this segment contain High Potency Active Pharmaceutical Ingredients (HPAPIs) which itself is a rapidly growing segment in the global API market. The market growth of this segment will be particularly higher than other segments owing to loss of patent protection for blockbuster drugs such as Herceptin (Roche), Arimidex (AstraZeneca), Xeloda (Roche), Abraxane (Celgene), Temodar (Merck & Co.) and Vidaza (Celgene) between 2010 and 2014.
Create successful ePaper yourself
Turn your PDF publications into a flip-book with our unique Google optimized e-Paper software.
Transparency <strong>Market</strong><br />
Research<br />
<strong>Active</strong> <strong>Pharmaceutical</strong> <strong>Ingredients</strong> (<strong>API</strong>) <strong>Market</strong> - <strong>Global</strong><br />
<strong>Industry</strong> <strong>Analysis</strong>, <strong>Size</strong>, <strong>Share</strong>, <strong>Growth</strong>, <strong>Trends</strong> <strong>and</strong><br />
<strong>Forecast</strong> <strong>2014</strong> - <strong>2020</strong><br />
Published Date<br />
2015-03-24<br />
137 Page Report<br />
Buy Now<br />
Request Sample<br />
Press Release<br />
<strong>Active</strong> <strong>Pharmaceutical</strong> <strong>Ingredients</strong> <strong>Market</strong> Expected to Reach USD<br />
185.9 billion <strong>Global</strong>ly in <strong>2020</strong><br />
Transparency <strong>Market</strong> Research<br />
State Tower,<br />
90, State Street, Suite 700.<br />
Albany, NY 12207<br />
United States<br />
www.transparencymarketresearch.com<br />
sales@transparencymarketresearch.com
<strong>Active</strong> <strong>Pharmaceutical</strong> <strong>Ingredients</strong><br />
(<strong>API</strong>) <strong>Market</strong><br />
REPORT DESCRIPTION<br />
<strong>Active</strong> <strong>Pharmaceutical</strong> <strong>Ingredients</strong> (<strong>API</strong>) <strong>Market</strong><br />
<strong>Size</strong>, <strong>Share</strong>, <strong>Growth</strong>, <strong>Trends</strong> <strong>and</strong> <strong>Forecast</strong> <strong>2014</strong> <strong>–</strong> <strong>2020</strong><br />
- <strong>Global</strong> <strong>Industry</strong> <strong>Analysis</strong>,<br />
According to a new market report published by Transparency <strong>Market</strong> Research "<strong>Active</strong><br />
<strong>Pharmaceutical</strong> <strong>Ingredients</strong> (<strong>API</strong>) <strong>Market</strong> - <strong>Global</strong> <strong>Industry</strong> <strong>Analysis</strong>, <strong>Size</strong>, <strong>Share</strong>, <strong>Growth</strong>, <strong>Trends</strong><br />
<strong>and</strong> <strong>Forecast</strong> <strong>2014</strong> - <strong>2020</strong>," the global active pharmaceutical ingredients market was valued at<br />
USD 119.7 billion in 2013 <strong>and</strong> is anticipated to reach USD 185.9 billion by <strong>2020</strong>, exp<strong>and</strong>ing at a<br />
CAGR of 6.5% during the forecast period from <strong>2014</strong> to <strong>2020</strong>.<br />
According to the World Health Organization (WHO), in 2012, cancer was among the leading<br />
causes of morbidity <strong>and</strong> mortality worldwide, with approximately 14 million newly diagnosed<br />
cases <strong>and</strong> 8.2 million cancer-related deaths. Therefore, the oncology segment is expected to be<br />
fastest growing segment in the global <strong>API</strong> market. Moreover, most of the drugs in this segment<br />
contain High Potency <strong>Active</strong> <strong>Pharmaceutical</strong> <strong>Ingredients</strong> (HP<strong>API</strong>s) which itself is a rapidly growing<br />
segment in the global <strong>API</strong> market. The market growth of this segment will be particularly higher<br />
than other segments owing to loss of patent protection for blockbuster drugs such as Herceptin<br />
(Roche), Arimidex (AstraZeneca), Xeloda (Roche), Abraxane (Celgene), Temodar (Merck & Co.)<br />
<strong>and</strong> Vidaza (Celgene) between 2010 <strong>and</strong> <strong>2014</strong>.<br />
Browse the full <strong>Active</strong> <strong>Pharmaceutical</strong> <strong>Ingredients</strong> (<strong>API</strong>) <strong>Market</strong> Report<br />
@ :<br />
http://www.transparencymarketresearch.com/active-pharmaceuticalingredients.html<br />
The global active pharmaceutical ingredients market is segmented on the basis of therapeutic<br />
area into non-steroidal anti-inflammatory drugs (NSAIDS), oncology drugs, anti-diabetic drugs,<br />
cardiovascular drugs, central nervous system drugs, musculoskeletal drugs, <strong>and</strong> others. The<br />
overall <strong>API</strong> market is expected to witness substantial growth during the forecast period from<br />
Transparency <strong>Market</strong> Research<br />
2
<strong>Active</strong> <strong>Pharmaceutical</strong> <strong>Ingredients</strong><br />
(<strong>API</strong>) <strong>Market</strong><br />
<strong>2014</strong> to <strong>2020</strong>, wherein oncology <strong>and</strong> central nervous system drugs segments would play a vital<br />
role. These segments are expected to grow at the highest CAGR during the forecast period from<br />
<strong>2014</strong> to <strong>2020</strong>. Cardiovascular drugs accounted for the largest market revenue share in 2013 due<br />
to the rising prevalence of cardiovascular diseases, sedentary lifestyle, <strong>and</strong> aging population.<br />
Bestselling products losing market exclusivity has been a common trend in all market segments,<br />
thus creating opportunities for generic products. This in turn increases the dem<strong>and</strong> for <strong>API</strong>s in<br />
particular therapeutics segments.<br />
Browse the full <strong>Active</strong> <strong>Pharmaceutical</strong> <strong>Ingredients</strong> (<strong>API</strong>) <strong>Market</strong> press<br />
release @ :<br />
http://www.transparencymarketresearch.com/pressrelease/activepharmaceutical-ingredients.htm<br />
Currently, biological drugs are gaining importance in the treatment of chronic diseases such as<br />
cancer <strong>and</strong> diabetes. These drugs are costlier due to challenging set of manufacturing<br />
requirements <strong>and</strong> difficult replication as against chemical <strong>API</strong>s. Advancements in the production<br />
technology have enabled production of biosimilars that are not exact copies of innovator drugs,<br />
but highly comparable in terms of safety <strong>and</strong> efficacy. Europe has been the frontrunner in<br />
approving biosimilars, <strong>and</strong> the WHO has also set guidelines on similar lines of those set by the<br />
European Union. Regulatory pathways in the biosimilars space in different nations are evolving<br />
<strong>and</strong> this implies a great market opportunity ahead for the biopharmaceutical companies.<br />
Approval of the first biosimilar in the U.S. for filgrastim (2015) indicates opening up of the highly<br />
regulated U.S. market, which would further push the overall <strong>API</strong> market growth.<br />
Get Free Sample Report <strong>Active</strong> <strong>Pharmaceutical</strong> <strong>Ingredients</strong> (<strong>API</strong>) <strong>Market</strong> :<br />
http://www.transparencymarketresearch.com/sample/sample.php?<br />
flag=S&rep_id=1690<br />
Transparency <strong>Market</strong> Research<br />
3
<strong>Active</strong> <strong>Pharmaceutical</strong> <strong>Ingredients</strong><br />
(<strong>API</strong>) <strong>Market</strong><br />
Major players competing in this market include Boehringer Ingelheim Group, Cambrex<br />
Corporation, Dr. Reddy’s Laboratories, Ltd., BASF SE, Hospira, Inc., Lonza Group, Mylan, Inc.,<br />
Novartis AG, Pfizer, Inc., Teva <strong>Pharmaceutical</strong> Industries Ltd., Actavis plc, <strong>and</strong> Wuxi Apptec.<br />
The global active pharmaceutical ingredients market is segmented as follows:<br />
<strong>Active</strong> <strong>Pharmaceutical</strong> <strong>Ingredients</strong> <strong>Market</strong>, by Type of Manufacturing<br />
Captive or In-house <strong>API</strong> manufacturing<br />
<strong>API</strong> contract manufacturing<br />
<strong>Active</strong> <strong>Pharmaceutical</strong> <strong>Ingredients</strong> <strong>Market</strong>, by Type of <strong>API</strong><br />
Synthetic Chemical <strong>API</strong><br />
Biological <strong>API</strong><br />
<strong>Active</strong> <strong>Pharmaceutical</strong> <strong>Ingredients</strong> <strong>Market</strong>, by Type of Drug<br />
Br<strong>and</strong>ed or Innovative Prescription Drugs<br />
Generic Prescription Drugs<br />
Transparency <strong>Market</strong> Research<br />
4
<strong>Active</strong> <strong>Pharmaceutical</strong> <strong>Ingredients</strong><br />
(<strong>API</strong>) <strong>Market</strong><br />
Over-the-counter Drugs<br />
<strong>Active</strong> <strong>Pharmaceutical</strong> <strong>Ingredients</strong> <strong>Market</strong>, by Therapeutic Area<br />
Non-steroidal Anti-inflammatory Drugs (NSAIDs)<br />
Oncology Drugs<br />
Anti-diabetic Drugs<br />
Cardiovascular Drugs<br />
Central Nervous System Drugs<br />
Musculoskeletal Drugs<br />
Other Drugs (antibacterial, antiviral, antifungal, etc.)<br />
<strong>Active</strong> <strong>Pharmaceutical</strong> <strong>Ingredients</strong> <strong>Market</strong>, by Geography<br />
North America<br />
Transparency <strong>Market</strong> Research<br />
5
<strong>Active</strong> <strong>Pharmaceutical</strong> <strong>Ingredients</strong><br />
(<strong>API</strong>) <strong>Market</strong><br />
Europe<br />
Asia Pacific<br />
Rest of the World (RoW)<br />
TABLE OF CONTENT<br />
Chapter 1 Preface<br />
1.1 Report Description<br />
1.2 <strong>Market</strong> Segmentation<br />
1.3 Research Methodology<br />
1.3.1 Secondary Research<br />
1.3.2 Primary Research<br />
1.3.3 Assumptions<br />
1.4 List of Abbreviations<br />
Chapter 2 Executive Summary<br />
2.1 <strong>Market</strong> Snapshot: <strong>Global</strong> <strong>API</strong> <strong>Market</strong> (2013 & <strong>2020</strong>)<br />
2.2 Comparative <strong>Analysis</strong>: <strong>Global</strong> <strong>API</strong> <strong>Market</strong> Revenue, by Geography, 2013 & <strong>2020</strong> (Value %)<br />
Transparency <strong>Market</strong> Research<br />
6
<strong>Active</strong> <strong>Pharmaceutical</strong> <strong>Ingredients</strong><br />
(<strong>API</strong>) <strong>Market</strong><br />
2.3 <strong>Global</strong> <strong>API</strong> <strong>Market</strong> Revenue, by Therapeutic Area, 2013 (USD Million)<br />
Chapter 3 <strong>Market</strong> Overview<br />
3.1 Introduction<br />
3.2 <strong>Market</strong> Dynamics<br />
3.2.1 Drivers<br />
3.2.1.1 Increase in Abbreviated New Drug Applications (ANDA) in the recent past boosted the<br />
dem<strong>and</strong> for <strong>API</strong>s<br />
3.2.1.2 Increase in Drug Master File (DMF) filing from Indian companies indicates a rapid <strong>API</strong><br />
market growth<br />
3.2.2 Restraints<br />
3.2.2.1 Strict European Union regulatory policies restraining market growth<br />
3.2.3 Opportunities<br />
3.2.3.1 Patent expiry of lucrative biological drugs would provide new opportunities for specialized<br />
<strong>API</strong> manufacturers<br />
3.3 Event Impact <strong>Analysis</strong><br />
3.4 Value Chain <strong>Analysis</strong><br />
3.4.1 <strong>Global</strong> <strong>Active</strong> <strong>Pharmaceutical</strong> Ingredient <strong>Market</strong>: Value Chain <strong>Analysis</strong><br />
3.5 Porter’s Five Forces <strong>Analysis</strong>: <strong>Global</strong> <strong>Active</strong> <strong>Pharmaceutical</strong> <strong>Ingredients</strong> <strong>Market</strong><br />
3.5.1 Bargaining Power of Suppliers<br />
3.5.2 Bargaining Power of Buyers<br />
Transparency <strong>Market</strong> Research<br />
7
<strong>Active</strong> <strong>Pharmaceutical</strong> <strong>Ingredients</strong><br />
(<strong>API</strong>) <strong>Market</strong><br />
3.5.3 Threat of Substitutes<br />
3.5.4 Threat of New Entrants<br />
3.5.5 Competitive Rivalry<br />
3.6 <strong>Market</strong> Attractiveness <strong>Analysis</strong>: <strong>Global</strong> <strong>API</strong> <strong>Market</strong>, by Geography<br />
3.7 Competitive L<strong>and</strong>scape<br />
Chapter 4 <strong>Global</strong> <strong>Active</strong> <strong>Pharmaceutical</strong> <strong>Ingredients</strong> <strong>Market</strong>, by Types of Manufacturers<br />
4.1 Overview<br />
Million)<br />
4.1.1 <strong>Global</strong> <strong>Active</strong> <strong>Pharmaceutical</strong> <strong>Ingredients</strong> <strong>Market</strong>, by Type of Manufacturers, 2012 <strong>–</strong> <strong>2020</strong> (USD<br />
4.2 Captive or In-house <strong>API</strong> Manufacturing<br />
4.2.1 <strong>Global</strong> Captive or In-house <strong>API</strong> Manufacturing <strong>Market</strong> Revenue, 2012 <strong>–</strong> <strong>2020</strong> (USD Million)<br />
4.3 <strong>API</strong> Contract Manufacturing<br />
4.3.1 <strong>Global</strong> <strong>API</strong> Contract Manufacturing <strong>Market</strong> Revenue, 2012 <strong>–</strong> <strong>2020</strong> (USD Million)<br />
Chapter 5 <strong>Global</strong> <strong>Active</strong> <strong>Pharmaceutical</strong> <strong>Ingredients</strong> <strong>Market</strong>, by Type of <strong>API</strong><br />
5.1 Synthetic Chemical <strong>API</strong><br />
5.1.1 Differences between Small Molecule <strong>API</strong>s <strong>and</strong> Biological <strong>API</strong>s<br />
5.1.2 <strong>Global</strong> Synthetic Chemical <strong>API</strong> <strong>Market</strong> Revenue, 2012 <strong>–</strong> <strong>2020</strong> (USD Million)<br />
5.2 Biological <strong>API</strong><br />
Transparency <strong>Market</strong> Research<br />
8
<strong>Active</strong> <strong>Pharmaceutical</strong> <strong>Ingredients</strong><br />
(<strong>API</strong>) <strong>Market</strong><br />
5.2.1 Top 10 drugs <strong>–</strong> Small Molecule vs. Biological, by <strong>API</strong> Type, 2008 <strong>and</strong> 2013<br />
5.2.2 <strong>Global</strong> Biological <strong>API</strong> <strong>Market</strong> Revenue, 2012 <strong>–</strong> <strong>2020</strong> (USD Million)<br />
Chapter 6 <strong>Global</strong> <strong>Active</strong> <strong>Pharmaceutical</strong> <strong>Ingredients</strong> <strong>Market</strong>, by Type of Drugs<br />
6.1 Br<strong>and</strong>ed or Innovative Prescription Drugs<br />
6.1.1 <strong>Global</strong> Br<strong>and</strong>ed or Innovative Prescription Drugs <strong>API</strong> <strong>Market</strong> Revenue, 2012 <strong>–</strong> <strong>2020</strong> (USD Million)<br />
6.2 Generic Prescription Drugs<br />
6.2.1 <strong>Global</strong> Generic Prescription Drugs <strong>API</strong> <strong>Market</strong> Revenue, 2012 <strong>–</strong> <strong>2020</strong> (USD Million)<br />
6.3 Over-the-counter (OTC) Drugs<br />
6.3.1 <strong>Global</strong> Over-the-counter (OTC) Drugs <strong>API</strong> <strong>Market</strong> Revenue, 2012 <strong>–</strong> <strong>2020</strong> (USD Million)<br />
Chapter 7 <strong>Global</strong> <strong>Active</strong> <strong>Pharmaceutical</strong> <strong>Ingredients</strong> <strong>Market</strong>, by Therapeutic Area<br />
7.1 Overview<br />
7.1.1 <strong>Global</strong> <strong>Active</strong> <strong>Pharmaceutical</strong> <strong>Ingredients</strong> <strong>Market</strong>, by Therapeutic Area, 2012 <strong>–</strong> <strong>2020</strong> (USD Million)<br />
7.2 Non-steroidal Anti-inflammatory Drugs<br />
7.2.1 <strong>Global</strong> NSAIDs <strong>API</strong> <strong>Market</strong> Revenue, 2012 <strong>–</strong> <strong>2020</strong> (USD Million)<br />
7.3 Oncology Drugs<br />
7.3.1 <strong>Global</strong> Oncology Drugs <strong>API</strong> <strong>Market</strong> Revenue, 2012 <strong>–</strong> <strong>2020</strong> (USD Million)<br />
7.4 Anti-diabetic Drugs<br />
7.4.1 <strong>Global</strong> Anti-diabetic Drugs <strong>API</strong> <strong>Market</strong> Revenue, 2012 <strong>–</strong> <strong>2020</strong> (USD Million)<br />
Transparency <strong>Market</strong> Research<br />
9
<strong>Active</strong> <strong>Pharmaceutical</strong> <strong>Ingredients</strong><br />
(<strong>API</strong>) <strong>Market</strong><br />
7.5 Cardiovascular Drugs<br />
7.5.1 <strong>Global</strong> Cardiovascular Drugs <strong>API</strong> <strong>Market</strong> Revenue, 2012 <strong>–</strong> <strong>2020</strong> (USD Million)<br />
7.6 Central Nervous System Drugs<br />
7.6.1 <strong>Global</strong> CNS Drugs <strong>API</strong> <strong>Market</strong> Revenue, 2012 <strong>–</strong> <strong>2020</strong> (USD Million)<br />
7.7 Musculoskeletal drugs<br />
7.7.1 <strong>Global</strong> Musculoskeletal Drugs <strong>API</strong> <strong>Market</strong> Revenue, 2012 <strong>–</strong> <strong>2020</strong> (USD Million)<br />
7.8 Other drugs (antibacterial, antiviral, antifungal, etc.)<br />
7.8.1 <strong>Global</strong> Other Drugs <strong>API</strong> <strong>Market</strong> Revenue, 2012 <strong>–</strong> <strong>2020</strong> (USD Million)<br />
Chapter 8 <strong>Global</strong> <strong>Active</strong> <strong>Pharmaceutical</strong> <strong>Ingredients</strong> <strong>Market</strong>, by Geography<br />
8.1 Overview<br />
8.1.1 <strong>Global</strong> <strong>Active</strong> <strong>Pharmaceutical</strong> <strong>Ingredients</strong> <strong>Market</strong>, by Geography, 2012 <strong>–</strong> <strong>2020</strong> (USD Million)<br />
8.2 North America<br />
8.2.1 North America <strong>API</strong> <strong>Market</strong> Revenue, 2012 <strong>–</strong> <strong>2020</strong> (USD Million)<br />
8.3 Europe<br />
8.3.1 Europe <strong>API</strong> <strong>Market</strong> Revenue, 2012 <strong>–</strong> <strong>2020</strong> (USD Million)<br />
8.4 Asia Pacific<br />
8.4.1 Asia Pacific <strong>API</strong> <strong>Market</strong> Revenue, 2012 <strong>–</strong> <strong>2020</strong> (USD Million)<br />
8.5 Rest of the World<br />
8.5.1 Rest of the World <strong>API</strong> <strong>Market</strong> Revenue, 2012 <strong>–</strong> <strong>2020</strong> (USD Million)<br />
Transparency <strong>Market</strong> Research<br />
10
<strong>Active</strong> <strong>Pharmaceutical</strong> <strong>Ingredients</strong><br />
(<strong>API</strong>) <strong>Market</strong><br />
Chapter 9 <strong>Global</strong> <strong>Market</strong> <strong>Analysis</strong> of Select NSAIDs, by Geography<br />
9.1 Paracetamol<br />
9.1.1 North America<br />
9.1.1.1 Dem<strong>and</strong> <strong>and</strong> Consumption <strong>Analysis</strong><br />
9.1.1.2 North America Paracetamol (APAP) <strong>Market</strong> Revenue, 2012 <strong>–</strong> <strong>2020</strong> (USD Million)<br />
9.1.1.3 North America Paracetamol (APAP) <strong>Market</strong> Volume, 2012 <strong>–</strong> <strong>2020</strong> (Metric Tons)<br />
9.1.2 Europe<br />
9.1.2.1 Dem<strong>and</strong> <strong>and</strong> Consumption <strong>Analysis</strong><br />
9.1.2.2 Europe Paracetamol (APAP) <strong>Market</strong> Revenue, 2012 <strong>–</strong> <strong>2020</strong> (USD Million)<br />
9.1.2.3 Europe Paracetamol (APAP) <strong>Market</strong> Volume, 2012 <strong>–</strong> <strong>2020</strong> (Metric Tons)<br />
9.1.3 Asia Pacific<br />
9.1.3.1 Dem<strong>and</strong> <strong>and</strong> Consumption <strong>Analysis</strong><br />
9.1.3.2 Asia Pacific Paracetamol (APAP) <strong>Market</strong> Revenue, 2012 <strong>–</strong> <strong>2020</strong> (USD Million)<br />
9.1.3.3 Asia Pacific Paracetamol (APAP) <strong>Market</strong> Volume, 2012 <strong>–</strong> <strong>2020</strong> (Metric Tons)<br />
9.1.4 Rest of the World<br />
9.1.4.1 Rest of the World Paracetamol (APAP) <strong>Market</strong> Revenue, 2012 <strong>–</strong> <strong>2020</strong> (USD Million)<br />
9.1.4.2 Rest of the World Paracetamol (APAP) <strong>Market</strong> Volume, 2012 <strong>–</strong> <strong>2020</strong> (Metric Tons)<br />
9.2 Ibuprofen<br />
9.2.1 North America<br />
Transparency <strong>Market</strong> Research<br />
11
<strong>Active</strong> <strong>Pharmaceutical</strong> <strong>Ingredients</strong><br />
(<strong>API</strong>) <strong>Market</strong><br />
9.2.1.1 Dem<strong>and</strong> <strong>and</strong> Consumption <strong>Analysis</strong><br />
9.2.1.2 North America Ibuprofen <strong>Market</strong> Revenue, 2012 <strong>–</strong> <strong>2020</strong> (USD Million)<br />
9.2.1.3 North America Ibuprofen <strong>Market</strong> Volume, 2012 <strong>–</strong> <strong>2020</strong> (Metric Tons)<br />
9.2.2 Europe<br />
9.2.2.1 Dem<strong>and</strong> <strong>and</strong> Consumption <strong>Analysis</strong><br />
9.2.2.2 Europe Ibuprofen <strong>Market</strong> Revenue, 2012 <strong>–</strong> <strong>2020</strong> (USD Million)<br />
9.2.2.3 Europe Ibuprofen <strong>Market</strong> Volume, 2012 <strong>–</strong> <strong>2020</strong> (Metric Tons)<br />
9.2.3 Asia Pacific<br />
9.2.3.1 Dem<strong>and</strong> <strong>and</strong> Consumption <strong>Analysis</strong><br />
9.2.3.2 Asia Pacific Ibuprofen <strong>Market</strong> Revenue, 2012 <strong>–</strong> <strong>2020</strong> (USD Million)<br />
9.2.3.3 Asia Pacific Ibuprofen <strong>Market</strong> Volume, 2012 <strong>–</strong> <strong>2020</strong> (Metric Tons)<br />
9.2.4 Rest of the World<br />
9.2.4.1 Rest of the World Ibuprofen <strong>Market</strong> Revenue, 2012 <strong>–</strong> <strong>2020</strong> (USD Million)<br />
9.2.4.2 Rest of the World Ibuprofen <strong>Market</strong> Volume, 2012 <strong>–</strong> <strong>2020</strong> (Metric Tons)<br />
9.3 Aspirin<br />
9.3.1 North America<br />
9.3.1.1 Dem<strong>and</strong> <strong>and</strong> Consumption <strong>Analysis</strong><br />
9.3.1.2 North America Aspirin <strong>Market</strong> Revenue, 2012 <strong>–</strong> <strong>2020</strong> (USD Million)<br />
9.3.1.3 North America Aspirin <strong>Market</strong> Volume, 2012 <strong>–</strong> <strong>2020</strong> (Metric Tons)<br />
9.3.2 Europe<br />
Transparency <strong>Market</strong> Research<br />
12
<strong>Active</strong> <strong>Pharmaceutical</strong> <strong>Ingredients</strong><br />
(<strong>API</strong>) <strong>Market</strong><br />
9.3.2.1 Dem<strong>and</strong> <strong>and</strong> Consumption <strong>Analysis</strong><br />
9.3.2.2 Europe Aspirin <strong>Market</strong> Revenue, 2012 <strong>–</strong> <strong>2020</strong> (USD Million)<br />
9.3.2.3 Europe Aspirin <strong>Market</strong> Volume, 2012 <strong>–</strong> <strong>2020</strong> (Metric Tons)<br />
9.3.3 Asia Pacific<br />
9.3.3.1 Dem<strong>and</strong> <strong>and</strong> Consumption <strong>Analysis</strong><br />
9.3.3.2 Asia Pacific Aspirin <strong>Market</strong> Revenue, 2012 <strong>–</strong> <strong>2020</strong> (USD Million)<br />
9.3.3.3 Asia Pacific Aspirin <strong>Market</strong> Volume, 2012 <strong>–</strong> <strong>2020</strong> (Metric Tons)<br />
9.3.4 Rest of the World<br />
9.3.4.1 Rest of the World Aspirin <strong>Market</strong> Revenue, 2012 <strong>–</strong> <strong>2020</strong> (USD Million)<br />
9.3.4.2 Rest of the World Aspirin <strong>Market</strong> Volume, 2012 <strong>–</strong> <strong>2020</strong> (Metric Tons)<br />
9.4 Naproxen<br />
9.4.1 North America<br />
9.4.1.1 Dem<strong>and</strong> <strong>and</strong> Consumption <strong>Analysis</strong><br />
9.4.1.2 North America Naproxen <strong>Market</strong> Revenue, 2012 <strong>–</strong> <strong>2020</strong> (USD Million)<br />
9.4.1.3 North America Naproxen <strong>Market</strong> Volume, 2012 <strong>–</strong> <strong>2020</strong> (Metric Tons)<br />
9.4.2 Europe<br />
9.4.2.1 Dem<strong>and</strong> <strong>and</strong> Consumption <strong>Analysis</strong><br />
9.4.2.2 Europe Naproxen <strong>Market</strong> Revenue, 2012 <strong>–</strong> <strong>2020</strong> (USD Million)<br />
9.4.2.3 Europe Naproxen <strong>Market</strong> Volume, 2012 <strong>–</strong> <strong>2020</strong> (Metric Tons)<br />
9.4.3 Asia Pacific<br />
Transparency <strong>Market</strong> Research<br />
13
<strong>Active</strong> <strong>Pharmaceutical</strong> <strong>Ingredients</strong><br />
(<strong>API</strong>) <strong>Market</strong><br />
9.4.3.1 Dem<strong>and</strong> <strong>and</strong> Consumption <strong>Analysis</strong><br />
9.4.3.2 Asia Pacific Naproxen <strong>Market</strong> Revenue, 2012 <strong>–</strong> <strong>2020</strong> (USD Million)<br />
9.4.3.3 Asia Pacific Naproxen <strong>Market</strong> Volume, 2012 <strong>–</strong> <strong>2020</strong> (Metric Tons)<br />
9.4.4 Rest of the World<br />
9.4.4.1 Rest of the World Naproxen <strong>Market</strong> Revenue, 2012 <strong>–</strong> <strong>2020</strong> (USD Million)<br />
9.4.4.2 Rest of the World Naproxen <strong>Market</strong> Volume, 2012 <strong>–</strong> <strong>2020</strong> (Metric Tons)<br />
Chapter 10 Recommendations<br />
10.1 Enhance manufacturing capacity through acquisitions in targeted geographies<br />
10.2 Achieve cost leadership in specific <strong>API</strong> molecules<br />
Chapter 11 Company Profiles<br />
11.1 Actavis plc<br />
11.1.1 Company Overview<br />
11.1.2 Financial Overview<br />
11.1.3 Business Strategies<br />
11.1.4 Recent Developments<br />
11.2 BASF SE<br />
11.2.1 Company Overview<br />
11.2.2 Financial Overview<br />
Transparency <strong>Market</strong> Research<br />
14
<strong>Active</strong> <strong>Pharmaceutical</strong> <strong>Ingredients</strong><br />
(<strong>API</strong>) <strong>Market</strong><br />
11.2.3 Business Strategies<br />
11.2.4 Recent developments<br />
11.3 Boehringer Ingelheim Group<br />
11.3.1 Company Overview<br />
11.3.2 Financial Overview<br />
11.3.3 Business Strategies<br />
11.3.4 Recent Developments<br />
11.4 Cambrex Corporation<br />
11.4.1 Company Overview<br />
11.4.2 Financial Overview<br />
11.4.3 Business Strategies<br />
11.4.4 Recent Developments<br />
11.5 Dr. Reddy’s Laboratories Ltd.<br />
11.5.1 Company Overview<br />
11.5.2 Financial Overview<br />
11.5.3 Business Strategies<br />
11.5.4 Recent Developments<br />
11.6 Hospira, Inc.<br />
11.6.1 Company Overview<br />
11.6.2 Financial Overview<br />
Transparency <strong>Market</strong> Research<br />
15
<strong>Active</strong> <strong>Pharmaceutical</strong> <strong>Ingredients</strong><br />
(<strong>API</strong>) <strong>Market</strong><br />
11.6.3 Business Strategies<br />
11.6.4 Recent Developments<br />
11.7 Lonza Group<br />
11.7.1 Company Overview<br />
11.7.2 Financial Overview<br />
11.7.3 Business Strategies<br />
11.7.4 Recent Developments<br />
11.8 Mylan, Inc.<br />
11.8.1 Company Overview<br />
11.8.2 Financial Overview<br />
11.8.3 Business Strategies<br />
11.8.4 Recent Developments<br />
11.9 Novartis International AG<br />
11.9.1 Company Overview<br />
11.9.2 Financial Overview<br />
11.9.3 Business Strategies<br />
11.9.4 Recent Developments<br />
11.10 Pfizer, Inc.<br />
11.10.1 Company Overview<br />
11.10.2 Financial Overview<br />
Transparency <strong>Market</strong> Research<br />
16
<strong>Active</strong> <strong>Pharmaceutical</strong> <strong>Ingredients</strong><br />
(<strong>API</strong>) <strong>Market</strong><br />
11.10.3 Product Portfolio<br />
11.10.4 Business Strategies<br />
11.10.5 Recent Developments<br />
11.11 Teva <strong>Pharmaceutical</strong> Industries Ltd.<br />
11.11.1 Company Overview<br />
11.11.2 Financial Overview<br />
11.11.3 Business Strategies<br />
11.11.4 Recent Developments<br />
11.12 WuXi Apptec<br />
11.12.1 Company Overview<br />
11.12.2 Financial Overview<br />
11.12.3 Business Strategies<br />
11.12.4 Recent Developments<br />
List of Figures<br />
FIG. 1 <strong>Active</strong> <strong>Pharmaceutical</strong> <strong>Ingredients</strong> <strong>Market</strong> Segmentation<br />
FIG. 2 Comparative <strong>Analysis</strong>: <strong>Global</strong> <strong>API</strong> <strong>Market</strong> Revenue, by Geography, 2013 &<strong>2020</strong> (Value %)<br />
FIG. 3 <strong>Global</strong> <strong>API</strong> <strong>Market</strong> Revenue, by Therapeutic Area, 2013 (USD Million)<br />
FIG. 4 Number of DMF Type II applications filed at the U.S. FDA by countries till 2011<br />
FIG. 5 <strong>Global</strong> <strong>Active</strong> <strong>Pharmaceutical</strong> Ingredient <strong>Market</strong>: Value Chain <strong>Analysis</strong><br />
Transparency <strong>Market</strong> Research<br />
17
<strong>Active</strong> <strong>Pharmaceutical</strong> <strong>Ingredients</strong><br />
(<strong>API</strong>) <strong>Market</strong><br />
FIG. 6 Porter’s Five Forces <strong>Analysis</strong>: <strong>Global</strong> <strong>Active</strong> <strong>Pharmaceutical</strong> <strong>Ingredients</strong> <strong>Market</strong><br />
FIG. 7 <strong>Market</strong> Attractiveness <strong>Analysis</strong>: <strong>Global</strong> <strong>API</strong> <strong>Market</strong>, by Geography<br />
FIG. 8 <strong>Global</strong> Captive or In-house <strong>API</strong> Manufacturing <strong>Market</strong> Revenue, 2012 <strong>–</strong> <strong>2020</strong> (USD Million)<br />
FIG. 9 <strong>Global</strong> <strong>API</strong> Contract Manufacturing <strong>Market</strong> Revenue, 2012 <strong>–</strong> <strong>2020</strong> (USD Million)<br />
FIG. 10 <strong>Global</strong> Synthetic Chemical <strong>API</strong> <strong>Market</strong> Revenue, 2012 <strong>–</strong> <strong>2020</strong> (USD Million)<br />
FIG. 11 Top 10 drugs <strong>–</strong> Small Molecule vs. Biological, by <strong>API</strong> Type, 2008 <strong>and</strong> 2013<br />
FIG. 12 <strong>Global</strong> Biological <strong>API</strong> <strong>Market</strong> Revenue, 2012 <strong>–</strong> <strong>2020</strong> (USD Million)<br />
FIG. 13 <strong>Global</strong> Br<strong>and</strong>ed or Innovative Prescription Drugs <strong>API</strong> <strong>Market</strong> Revenue, 2012 <strong>–</strong> <strong>2020</strong> (USD Million)<br />
FIG. 14 <strong>Global</strong> Generic Prescription Drugs <strong>API</strong> <strong>Market</strong> Revenue, 2012 <strong>–</strong> <strong>2020</strong> (USD Million)<br />
FIG. 15 <strong>Global</strong> Over-the-counter (OTC) Drugs <strong>API</strong> <strong>Market</strong> Revenue, 2012 <strong>–</strong> <strong>2020</strong> (USD Million)<br />
FIG. 16 <strong>Global</strong> NSAIDs <strong>API</strong> <strong>Market</strong> Revenue, 2012 <strong>–</strong> <strong>2020</strong> (USD Million)<br />
FIG. 17 <strong>Global</strong> Oncology Drugs <strong>API</strong> <strong>Market</strong> Revenue, 2012 <strong>–</strong> <strong>2020</strong> (USD Million)<br />
FIG. 18 <strong>Global</strong> Anti-diabetic Drugs <strong>API</strong> <strong>Market</strong> Revenue, 2012 <strong>–</strong> <strong>2020</strong> (USD Million)<br />
FIG. 19 <strong>Global</strong> Cardiovascular Drugs <strong>API</strong> <strong>Market</strong> Revenue, 2012 <strong>–</strong> <strong>2020</strong> (USD Million)<br />
FIG. 20 <strong>Global</strong> CNS Drugs <strong>API</strong> <strong>Market</strong> Revenue, 2012 <strong>–</strong> <strong>2020</strong> (USD Million)<br />
FIG. 21 <strong>Global</strong> Musculoskeletal Drugs <strong>API</strong> <strong>Market</strong> Revenue, 2012 <strong>–</strong> <strong>2020</strong> (USD Million)<br />
FIG. 22 <strong>Global</strong> Other Drugs <strong>API</strong> <strong>Market</strong> Revenue, 2012 <strong>–</strong> <strong>2020</strong> (USD Million)<br />
FIG. 23 North America <strong>API</strong> <strong>Market</strong> Revenue, 2012 <strong>–</strong> <strong>2020</strong> (USD Million)<br />
FIG. 24 Europe <strong>API</strong> <strong>Market</strong> Revenue, 2012 <strong>–</strong> <strong>2020</strong> (USD Million)<br />
FIG. 25 Asia Pacific <strong>API</strong> <strong>Market</strong> Revenue, 2012 <strong>–</strong> <strong>2020</strong> (USD Million)<br />
Transparency <strong>Market</strong> Research<br />
18
<strong>Active</strong> <strong>Pharmaceutical</strong> <strong>Ingredients</strong><br />
(<strong>API</strong>) <strong>Market</strong><br />
FIG. 26 Rest of the World <strong>API</strong> <strong>Market</strong> Revenue, 2012 <strong>–</strong> <strong>2020</strong> (USD Million)<br />
FIG. 27 North America Paracetamol (APAP) <strong>Market</strong> Revenue, 2012 <strong>–</strong> <strong>2020</strong> (USD Million)<br />
FIG. 28 North America Paracetamol (APAP) <strong>Market</strong> Volume, 2012 <strong>–</strong> <strong>2020</strong> (Metric Tons)<br />
FIG. 29 Europe Paracetamol (APAP) <strong>Market</strong> Revenue, 2012 <strong>–</strong> <strong>2020</strong> (USD Million)<br />
FIG. 30 Europe Paracetamol (APAP) <strong>Market</strong> Volume, 2012 <strong>–</strong> <strong>2020</strong> (Metric Tons)<br />
FIG. 31 Asia Pacific Paracetamol (APAP) <strong>Market</strong> Revenue, 2012 <strong>–</strong> <strong>2020</strong> (USD Million)<br />
FIG. 32 Asia Pacific Paracetamol (APAP) <strong>Market</strong> Volume, 2012 <strong>–</strong> <strong>2020</strong> (Metric Tons)<br />
FIG. 33 Rest of the World Paracetamol (APAP) <strong>Market</strong> Revenue, 2012 <strong>–</strong> <strong>2020</strong> (USD Million)<br />
FIG. 34 Rest of the World Paracetamol (APAP) <strong>Market</strong> Volume, 2012 <strong>–</strong> <strong>2020</strong> (Metric Tons)<br />
FIG. 35 North America Ibuprofen <strong>Market</strong> Revenue, 2012 <strong>–</strong> <strong>2020</strong> (USD Million)<br />
FIG. 36 North America Ibuprofen <strong>Market</strong> Volume, 2012 <strong>–</strong> <strong>2020</strong> (Metric Tons)<br />
FIG. 37 Europe Ibuprofen <strong>Market</strong> Revenue, 2012 <strong>–</strong> <strong>2020</strong> (USD Million)<br />
FIG. 38 Europe Ibuprofen <strong>Market</strong> Volume, 2012 <strong>–</strong> <strong>2020</strong> (Metric Tons)<br />
FIG. 39 Asia Pacific Ibuprofen <strong>Market</strong> Revenue, 2012 <strong>–</strong> <strong>2020</strong> (USD Million)<br />
FIG. 40 Asia Pacific Ibuprofen <strong>Market</strong> Volume, 2012 <strong>–</strong> <strong>2020</strong> (Metric Tons)<br />
FIG. 41 Rest of the World Ibuprofen <strong>Market</strong> Revenue, 2012 <strong>–</strong> <strong>2020</strong> (USD Million)<br />
FIG. 42 Rest of the World Ibuprofen <strong>Market</strong> Volume, 2012 <strong>–</strong> <strong>2020</strong> (Metric Tons)<br />
FIG. 43 North America Aspirin <strong>Market</strong> Revenue, 2012 <strong>–</strong> <strong>2020</strong> (USD Million)<br />
FIG. 44 North America Aspirin <strong>Market</strong> Volume, 2012 <strong>–</strong> <strong>2020</strong> (Metric Tons)<br />
FIG. 45 Europe Aspirin <strong>Market</strong> Revenue, 2012 <strong>–</strong> <strong>2020</strong> (USD Million)<br />
Transparency <strong>Market</strong> Research<br />
19
<strong>Active</strong> <strong>Pharmaceutical</strong> <strong>Ingredients</strong><br />
(<strong>API</strong>) <strong>Market</strong><br />
FIG. 46 Europe Aspirin <strong>Market</strong> Volume, 2012 <strong>–</strong> <strong>2020</strong> (Metric Tons)<br />
FIG. 47 Asia Pacific Aspirin <strong>Market</strong> Revenue, 2012 <strong>–</strong> <strong>2020</strong> (USD Million)<br />
FIG. 48 Asia Pacific Aspirin <strong>Market</strong> Volume, 2012 <strong>–</strong> <strong>2020</strong> (Metric Tons)<br />
FIG. 49 Rest of the World Aspirin <strong>Market</strong> Revenue, 2012 <strong>–</strong> <strong>2020</strong> (USD Million)<br />
FIG. 50 Rest of the World Aspirin <strong>Market</strong> Volume, 2012 <strong>–</strong> <strong>2020</strong> (Metric Tons)<br />
FIG. 51 North America Naproxen <strong>Market</strong> Revenue, 2012 <strong>–</strong> <strong>2020</strong> (USD Million)<br />
FIG. 52 North America Naproxen <strong>Market</strong> Volume, 2012 <strong>–</strong> <strong>2020</strong> (Metric Tons)<br />
FIG. 53 Europe Naproxen <strong>Market</strong> Revenue, 2012 <strong>–</strong> <strong>2020</strong> (USD Million)<br />
FIG. 54 Europe Naproxen <strong>Market</strong> Volume, 2012 <strong>–</strong> <strong>2020</strong> (Metric Tons)<br />
FIG. 55 Asia Pacific Naproxen <strong>Market</strong> Revenue, 2012 <strong>–</strong> <strong>2020</strong> (USD Million)<br />
FIG. 56 Asia Pacific Naproxen <strong>Market</strong> Volume, 2012 <strong>–</strong> <strong>2020</strong> (Metric Tons)<br />
FIG. 57 Rest of the World Naproxen <strong>Market</strong> Revenue, 2012 <strong>–</strong> <strong>2020</strong> (USD Million)<br />
FIG. 58 Rest of the World Naproxen <strong>Market</strong> Volume, 2012 <strong>–</strong> <strong>2020</strong> (Metric Tons)<br />
FIG. 59 Actavis plc: Annual Sales Revenue, 2011 <strong>–</strong> 2013 (USD Million)<br />
FIG. 60 BASF SE : Annual Sales Revenue of Chemicals, 2012 <strong>–</strong> <strong>2014</strong> (USD Million)<br />
FIG. 61 Boehringer Ingelheim: Annual Sales Revenue, 2011 <strong>–</strong> 2013 (USD Million)<br />
FIG. 62 Cambrex Corporation: Annual Sales Revenue, 2012 <strong>–</strong> <strong>2014</strong> (USD Million)<br />
FIG. 63 Dr. Reddy's Laboratories Ltd.: Annual Sales Revenue, 2012 <strong>–</strong> <strong>2014</strong> (USD Million)<br />
FIG. 64 Hospira, Inc.: Annual Sales Revenue, 2011 <strong>–</strong> 2013 (USD million)<br />
FIG. 65 Lonza Group: Annual Sales Revenue, 2011<strong>–</strong> 2013 (USD Million)<br />
Transparency <strong>Market</strong> Research<br />
20
<strong>Active</strong> <strong>Pharmaceutical</strong> <strong>Ingredients</strong><br />
(<strong>API</strong>) <strong>Market</strong><br />
FIG. 66 Mylan, Inc.: Annual Sales Revenue, 2011 <strong>–</strong> 2013 (USD Million)<br />
FIG. 67 Novartis International AG: Annual Sales Revenue, 2011 <strong>–</strong> 2013 (USD Million)<br />
FIG. 68 Pfizer, Inc.: Annual Sales Revenue, 2011 <strong>–</strong> 2013 (USD Million)<br />
FIG. 69 Teva, Inc.: Annual Sales Revenue, 2011 <strong>–</strong> 2013 (USD Million)<br />
FIG. 70 WuXi PharmaTech (Cayman), Inc.: Annual Sales Revenue, 2011 <strong>–</strong> 2013 (USD Million)<br />
List of Tables<br />
TABLE 1 List of Abbreviations<br />
TABLE 2 <strong>Market</strong> Snapshot: <strong>Global</strong> <strong>API</strong> <strong>Market</strong> (2013 & <strong>2020</strong>)<br />
TABLE 3 Patent Expiry of Major <strong>Pharmaceutical</strong> Drugs, 2009 - <strong>2014</strong><br />
TABLE 4 Patent Expiry of Major Biological Drugs in the U.S. <strong>and</strong> EU<br />
TABLE 5 Event Impact <strong>Analysis</strong>: <strong>Global</strong> <strong>API</strong> <strong>Market</strong><br />
TABLE 6 Competitive L<strong>and</strong>scape: <strong>Global</strong> <strong>API</strong> <strong>Market</strong>, 2013 (USD Million)<br />
TABLE 7 <strong>Global</strong> <strong>Active</strong> <strong>Pharmaceutical</strong> <strong>Ingredients</strong> <strong>Market</strong>, by Type of Manufacturers, 2012 <strong>–</strong> <strong>2020</strong> (USD<br />
Million)<br />
TABLE 8 Differences between Small Molecule <strong>API</strong>s <strong>and</strong> Biological <strong>API</strong>s<br />
TABLE 9 <strong>Global</strong> <strong>Active</strong> <strong>Pharmaceutical</strong> <strong>Ingredients</strong> <strong>Market</strong>, by Therapeutic Area, 2012 <strong>–</strong> <strong>2020</strong> (USD Million)<br />
TABLE 10 <strong>Global</strong> <strong>Active</strong> <strong>Pharmaceutical</strong> <strong>Ingredients</strong> <strong>Market</strong>, by Geography, 2012 <strong>–</strong> <strong>2020</strong> (USD Million)<br />
TABLE 11 Actavis plc: Expenses & Revenue, 2011 <strong>–</strong> 2013 (USD Million)<br />
TABLE 12 BASF SE: Expenses & Revenue, 2012 <strong>–</strong> <strong>2014</strong> (USD Million)<br />
Transparency <strong>Market</strong> Research<br />
21
<strong>Active</strong> <strong>Pharmaceutical</strong> <strong>Ingredients</strong><br />
(<strong>API</strong>) <strong>Market</strong><br />
TABLE 13 Cambrex Corporation: Expenses & Revenue, 2011 <strong>–</strong> 2013 (USD Million)<br />
TABLE 14 Dr. Reddy's Laboratories Ltd: Expenses & Revenue, 2012 <strong>–</strong> <strong>2014</strong> (USD Million)<br />
TABLE 15 Hospira, Inc.: Expenses & Revenue, 2011 <strong>–</strong> 2013 (USD Million)<br />
TABLE 16 Mylan, Inc..: Expenses & Revenue, 2011 <strong>–</strong> 2013 (USD Million)<br />
TABLE 17 Novartis International AG: Expenses & Revenue, 2011 <strong>–</strong> 2013 (USD Million)<br />
TABLE 18 Pfizer, Inc.: Expenses & Revenue, 2011 <strong>–</strong> 2013 (USD Million)<br />
TABLE 19 Teva, Inc.: Expenses & Revenue, 2011 <strong>–</strong> 2013 (USD Million)<br />
TABLE 20 WuXi PharmaTech, (Cayman), Inc.: Expenses & Revenue, 2011 <strong>–</strong> 2013 (Thous<strong>and</strong> USD)<br />
Browse All <strong>Pharmaceutical</strong> <strong>Market</strong> Research Reports @<br />
http://www.transparencymarketresearch.com/pharmaceutical-market-reports-1.html<br />
About Us<br />
Transparency <strong>Market</strong> Research is a market intelligence company providing global business information<br />
reports <strong>and</strong> services. Our exclusive blend of quantitative forecasting <strong>and</strong> trends analysis provides forwardlooking<br />
insight for thous<strong>and</strong>s of decision makers.<br />
We are privileged with highly experienced team of Analysts, Researchers <strong>and</strong> Consultants, who use<br />
proprietary data sources <strong>and</strong> various tools <strong>and</strong> techniques to gather, <strong>and</strong> analyze information. Our<br />
business offerings represent the latest <strong>and</strong> the most reliable information indispensable for businesses to<br />
sustain a competitive edge.<br />
Contact<br />
Transparency <strong>Market</strong> Research<br />
22
<strong>Active</strong> <strong>Pharmaceutical</strong> <strong>Ingredients</strong><br />
(<strong>API</strong>) <strong>Market</strong><br />
Transparency <strong>Market</strong> Research<br />
90 State Street,<br />
Suite 700,<br />
Albany<br />
NY - 12207<br />
United States<br />
Tel: +1-518-618-1030<br />
USA - Canada Toll Free 866-552-3453<br />
Email: sales@transparencymarketresearch.com<br />
Website: http://www.transparencymarketresearch.com/<br />
Browse The <strong>Market</strong> Research Blog :<br />
http://research<strong>and</strong>reports.wordpress.com/ http://www.transparencymarketresearch.com<br />
Transparency <strong>Market</strong> Research<br />
23


