- Page 1 and 2:
THE US CONTACT CENTER DECISION-MAKE
- Page 3 and 4:
At Syntellect, we help our customer
- Page 5 and 6:
Changes in contact center size, ope
- Page 7 and 8:
LIST OF TABLES FIGURE 1: VERTICAL M
- Page 9 and 10:
FIGURE 83: AVERAGE TIME TAKEN TO RE
- Page 11 and 12:
INTRODUCTION AND METHODOLOGY The "U
- Page 13 and 14:
SIZE BAND Almost every survey quest
- Page 15 and 16:
DISTRIBUTION AND USE OF THIS REPORT
- Page 17 and 18: QUALITY MANAGEMENT AND IMPROVEMENT
- Page 19 and 20: Smaller contact centers are much le
- Page 21 and 22: • Demonstrating the investment a
- Page 23 and 24: Figure 5: Supervisor activities Sup
- Page 25 and 26: way, the real-time call statistics
- Page 27 and 28: functionality, in some form, althou
- Page 29 and 30: Management information systems inte
- Page 31 and 32: Public sector and outsourcing conta
- Page 33 and 34: Figure 13: Inhibitors to scripting
- Page 35 and 36: The following table shows how custo
- Page 37 and 38: The following figure shows that res
- Page 39 and 40: Despite customer satisfaction being
- Page 41 and 42: Looking in more depth about how dis
- Page 43 and 44: COMPLAINTS John Seddon uses the ter
- Page 45 and 46: can see customers calling into the
- Page 47 and 48: Virtual queuing and call-back, when
- Page 49 and 50: INDUCTION COURSE TRAINING METHODS R
- Page 51 and 52: TIME REQUIRED TO BECOME FULLY-PRODU
- Page 53 and 54: INDUCTION COURSE COSTS The cost of
- Page 55 and 56: ONGOING TRAINING AND COACHING Once
- Page 57 and 58: Quite apart from the time spent on
- Page 59 and 60: MAXIMIZING EFFICIENCY AND AGENT OPT
- Page 61 and 62: CONTACT CENTER PERFORMANCE METRICS
- Page 63 and 64: Customer loyalty / lifetime value /
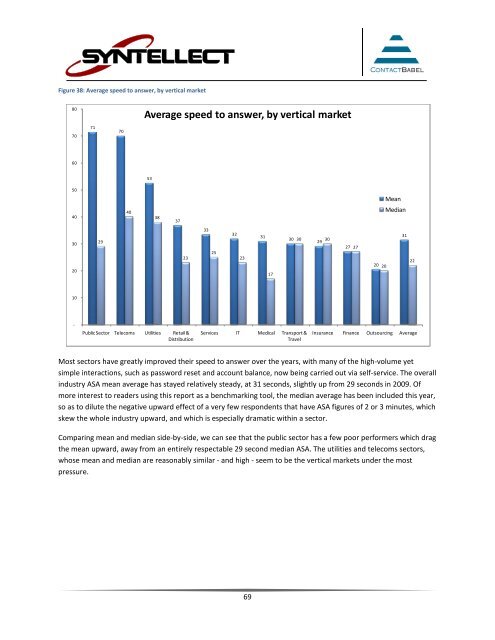
- Page 65 and 66: Average call duration varies betwee
- Page 67: CALL ABANDONMENT Call abandonment r
- Page 71 and 72: FIRST-CALL RESOLUTION The ability t
- Page 73 and 74: message, the business has less oppo
- Page 75 and 76: CALL TRANSFERS This metric indicate
- Page 77 and 78: BUDGET This section looks at how co
- Page 79 and 80: CHANGES IN CONTACT CENTER SIZE, OPE
- Page 81 and 82: Respondents expect the next 12 mont
- Page 83 and 84: Looking at the change in capital ex
- Page 85 and 86: VIRTUAL CONTACT CENTERS The applica
- Page 87 and 88: Linking contact centers together ca
- Page 89 and 90: Figure 52: Benefits of virtualizing
- Page 91 and 92: HOMEWORKING AND TELECOTTAGES Homewo
- Page 93 and 94: center respondents are concerned ab
- Page 95 and 96: "Data security issues are a concern
- Page 97 and 98: "Many staff would not have anywhere
- Page 99 and 100: Knowledge workers can be incorporat
- Page 101 and 102: choose the applications that exactl
- Page 103 and 104: Figure 60: Current use of IP, by co
- Page 105 and 106: Figure 62: Main drivers for moving
- Page 107 and 108: INCREASING EFFICIENCY AND EFFECTIVE
- Page 109 and 110: Such an approach can have severe pr
- Page 111 and 112: The following table shows the knowl
- Page 113 and 114: VOICE BIOMETRICS Until a few years
- Page 115 and 116: The amount of time required to auth
- Page 117 and 118: THE FUTURE OF IDENTITY AUTHENTICATI
- Page 119 and 120:
CTI, CALL ROUTING AND SCREEN POPPIN
- Page 121 and 122:
control is of great value to any bu
- Page 123 and 124:
Fulfilling service levels while man
- Page 125 and 126:
Figure 74: Use of workforce managem
- Page 127 and 128:
HEADSETS There are various factors
- Page 129 and 130:
HEADSET REPLACEMENT AND COST Around
- Page 131 and 132:
IP headsets and homeworkers The hom
- Page 133 and 134:
Channel Current use Drivers Inhibit
- Page 135 and 136:
“A satisfied customer is the best
- Page 137 and 138:
physical store. Of course, not all
- Page 139 and 140:
SMS and web collaboration - are sti
- Page 141 and 142:
Email response handling times have
- Page 143 and 144:
MULTIMEDIA BLENDING There is no gen
- Page 145 and 146:
MULTIMEDIA BLENDING AND ATTRITION R
- Page 147 and 148:
NICHE CHANNELS Apart from email, wh
- Page 149 and 150:
CUSTOMER REACTION TO SMS Customer r
- Page 151 and 152:
VIDEO AND IVVR Away from the self-s
- Page 153 and 154:
Figure 90: Advantages and disadvant
- Page 155 and 156:
Although self-service is in widespr
- Page 157 and 158:
The utilities sector is a leader in
- Page 159 and 160:
FROM TOUCHTONE IVR TO AUTOMATED SPE
- Page 161 and 162:
SOCIAL NETWORKING Second Life and t
- Page 163 and 164:
Customer communities In her book, T
- Page 165 and 166:
• Firms with already strong brand
- Page 167 and 168:
Figure 94: What effect will social
- Page 169 and 170:
The business objective of CRM is to
- Page 171 and 172:
and insurance respondents were keen
- Page 173 and 174:
HOSTED AND MANAGED SOLUTIONS Buildi
- Page 175 and 176:
WHAT TYPES OF COMPANY SHOULD CONSID
- Page 177 and 178:
DRIVERS FOR HOSTED AND MANAGED SOLU
- Page 179 and 180:
o o Low-risk ability to start up or
- Page 181 and 182:
o Network solutions can provide bac
- Page 183 and 184:
CHECKLIST WHEN CHOOSING A HOSTED/NE
- Page 185 and 186:
OUTBOUND AUTOMATION The traditional
- Page 187 and 188:
Vertical market patterns are very d
- Page 189 and 190:
EFFECTS OF LEGISLATION The Do-Not-C
- Page 191 and 192:
THE ROLE OF MOBILE TELEPHONY ON OUT
- Page 193 and 194:
Figure 105: Agent positions by US d
- Page 195 and 196:
DIVISIONAL RATINGS The cost-effecti
- Page 197 and 198:
It is controversial, and worse, ris
- Page 199 and 200:
• Adverse affect on contact cente
- Page 201 and 202:
Around half of contact centers have
- Page 203 and 204:
It is the medium and large operatio
- Page 205 and 206:
The inbound sector has experienced
- Page 207 and 208:
METHODS OF MOTIVATING AND RETAINING
- Page 209 and 210:
DESTINATIONS OF DEPARTING AGENTS De
- Page 211 and 212:
The medical and outsourcing sectors
- Page 213 and 214:
RECRUITMENT Rather than just asking
- Page 215 and 216:
Figure 123: The effectiveness of re
- Page 217 and 218:
MOST IMPORTANT ATTRIBUTES OF A SUCC
- Page 219 and 220:
SALARIES The human element to conta
- Page 221 and 222:
NEW AGENT SALARIES Mean average sta
- Page 223 and 224:
SALARIES BY CONTACT CENTER ACTIVITY
- Page 225 and 226:
Small contact centers tend to pay b
- Page 227 and 228:
STRATEGIC DIRECTIONS Most of this r
- Page 229 and 230:
THE USE OF TACTICAL AND OPERATIONAL
- Page 231 and 232:
“Flexibility of quickly adding ag
- Page 233 and 234:
• Outsourcer's key IT supplier re
- Page 235 and 236:
Other areas that have grown in impo
- Page 237 and 238:
Increasing the levels of self-servi
- Page 239:
APPENDIX: ABOUT CONTACTBABEL Contac


