A control chart pattern recognition system using a statistical ...
A control chart pattern recognition system using a statistical ...
A control chart pattern recognition system using a statistical ...

Create successful ePaper yourself
Turn your PDF publications into a flip-book with our unique Google optimized e-Paper software.
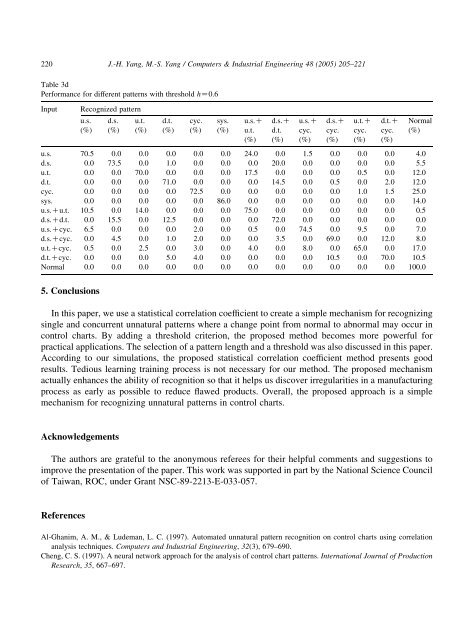
220<br />
J.-H. Yang, M.-S. Yang / Computers & Industrial Engineering 48 (2005) 205–221<br />
Table 3d<br />
Performance for different <strong>pattern</strong>s with threshold hZ0.6<br />
Input<br />
Recognized <strong>pattern</strong><br />
u.s.<br />
(%)<br />
d.s.<br />
(%)<br />
u.t.<br />
(%)<br />
d.t.<br />
(%)<br />
cyc.<br />
(%)<br />
sys.<br />
(%)<br />
u.s.C<br />
u.t.<br />
(%)<br />
d.s.C<br />
d.t.<br />
(%)<br />
u.s.C<br />
cyc.<br />
(%)<br />
d.s.C<br />
cyc.<br />
(%)<br />
u.t.C<br />
cyc.<br />
(%)<br />
d.t.C<br />
cyc.<br />
(%)<br />
Normal<br />
(%)<br />
u.s. 70.5 0.0 0.0 0.0 0.0 0.0 24.0 0.0 1.5 0.0 0.0 0.0 4.0<br />
d.s. 0.0 73.5 0.0 1.0 0.0 0.0 0.0 20.0 0.0 0.0 0.0 0.0 5.5<br />
u.t. 0.0 0.0 70.0 0.0 0.0 0.0 17.5 0.0 0.0 0.0 0.5 0.0 12.0<br />
d.t. 0.0 0.0 0.0 71.0 0.0 0.0 0.0 14.5 0.0 0.5 0.0 2.0 12.0<br />
cyc. 0.0 0.0 0.0 0.0 72.5 0.0 0.0 0.0 0.0 0.0 1.0 1.5 25.0<br />
sys. 0.0 0.0 0.0 0.0 0.0 86.0 0.0 0.0 0.0 0.0 0.0 0.0 14.0<br />
u.s.Cu.t. 10.5 0.0 14.0 0.0 0.0 0.0 75.0 0.0 0.0 0.0 0.0 0.0 0.5<br />
d.s.Cd.t. 0.0 15.5 0.0 12.5 0.0 0.0 0.0 72.0 0.0 0.0 0.0 0.0 0.0<br />
u.s.Ccyc. 6.5 0.0 0.0 0.0 2.0 0.0 0.5 0.0 74.5 0.0 9.5 0.0 7.0<br />
d.s.Ccyc. 0.0 4.5 0.0 1.0 2.0 0.0 0.0 3.5 0.0 69.0 0.0 12.0 8.0<br />
u.t.Ccyc. 0.5 0.0 2.5 0.0 3.0 0.0 4.0 0.0 8.0 0.0 65.0 0.0 17.0<br />
d.t.Ccyc. 0.0 0.0 0.0 5.0 4.0 0.0 0.0 0.0 0.0 10.5 0.0 70.0 10.5<br />
Normal 0.0 0.0 0.0 0.0 0.0 0.0 0.0 0.0 0.0 0.0 0.0 0.0 100.0<br />
5. Conclusions<br />
In this paper, we use a <strong>statistical</strong> correlation coefficient to create a simple mechanism for recognizing<br />
single and concurrent unnatural <strong>pattern</strong>s where a change point from normal to abnormal may occur in<br />
<strong>control</strong> <strong>chart</strong>s. By adding a threshold criterion, the proposed method becomes more powerful for<br />
practical applications. The selection of a <strong>pattern</strong> length and a threshold was also discussed in this paper.<br />
According to our simulations, the proposed <strong>statistical</strong> correlation coefficient method presents good<br />
results. Tedious learning training process is not necessary for our method. The proposed mechanism<br />
actually enhances the ability of <strong>recognition</strong> so that it helps us discover irregularities in a manufacturing<br />
process as early as possible to reduce flawed products. Overall, the proposed approach is a simple<br />
mechanism for recognizing unnatural <strong>pattern</strong>s in <strong>control</strong> <strong>chart</strong>s.<br />
Acknowledgements<br />
The authors are grateful to the anonymous referees for their helpful comments and suggestions to<br />
improve the presentation of the paper. This work was supported in part by the National Science Council<br />
of Taiwan, ROC, under Grant NSC-89-2213-E-033-057.<br />
References<br />
Al-Ghanim, A. M., & Ludeman, L. C. (1997). Automated unnatural <strong>pattern</strong> <strong>recognition</strong> on <strong>control</strong> <strong>chart</strong>s <strong>using</strong> correlation<br />
analysis techniques. Computers and Industrial Engineering, 32(3), 679–690.<br />
Cheng, C. S. (1997). A neural network approach for the analysis of <strong>control</strong> <strong>chart</strong> <strong>pattern</strong>s. International Journal of Production<br />
Research, 35, 667–697.