Global Ecology and Biogeography - Phycology Research Group ...
Global Ecology and Biogeography - Phycology Research Group ...
Global Ecology and Biogeography - Phycology Research Group ...

You also want an ePaper? Increase the reach of your titles
YUMPU automatically turns print PDFs into web optimized ePapers that Google loves.
ISSN 1466–822X<br />
Volume 18<br />
Number 4<br />
July 2009<br />
<strong>Global</strong> <strong>Ecology</strong><br />
<strong>and</strong> <strong>Biogeography</strong><br />
A Journal of Macroecology<br />
Editor-in-Chief:<br />
David J. Currie
<strong>Global</strong> <strong>Ecology</strong> <strong>and</strong> <strong>Biogeography</strong>, (<strong>Global</strong> Ecol. Biogeogr.) (2009) 18, 393–405<br />
Blackwell Publishing Ltd<br />
RESEARCH<br />
PAPER<br />
Macroecology meets macroevolution:<br />
evolutionary niche dynamics in the<br />
seaweed Halimeda<br />
Heroen Verbruggen 1 *†, Lennert Tyberghein 1 †, Klaas Pauly 1 †,<br />
Caroline Vlaeminck 1 , Katrien Van Nieuwenhuyze 1 , Wiebe H.C.F. Kooistra 2 ,<br />
Frederik Leliaert 1 <strong>and</strong> Olivier De Clerck 1<br />
1 <strong>Phycology</strong> <strong>Research</strong> <strong>Group</strong> <strong>and</strong> Center for<br />
Molecular Phylogenetics <strong>and</strong> Evolution, Ghent<br />
University, Krijgslaan 281 S8 (WE11), B-9000<br />
Ghent, Belgium, 2 Stazione Zoologica ‘Anton<br />
Dohrn’, Villa Comunale, 80121 Naples, Italy<br />
ABSTRACT<br />
Aim Because of their broad distribution in geographical <strong>and</strong> ecological dimensions,<br />
seaweeds (marine macroalgae) offer great potential as models for marine biogeographical<br />
inquiry <strong>and</strong> exploration of the interface between macroecology <strong>and</strong><br />
macroevolution. This study aims to characterize evolutionary niche dynamics in the<br />
common green seaweed genus Halimeda, use the observed insights to gain underst<strong>and</strong>ing<br />
of the biogeographical history of the genus <strong>and</strong> predict habitats that can be<br />
targeted for the discovery of species of special biogeographical interest.<br />
Location Tropical <strong>and</strong> subtropical coastal waters.<br />
Methods The evolutionary history of the genus is characterized using molecular<br />
phylogenetics <strong>and</strong> relaxed molecular clock analysis. Niche modelling is carried out<br />
with maximum entropy techniques <strong>and</strong> uses macroecological data derived from<br />
global satellite imagery. Evolutionary niche dynamics are inferred through application<br />
of ancestral character state estimation.<br />
Results A nearly comprehensive molecular phylogeny of the genus was inferred<br />
from a six-locus dataset. Macroecological niche models showed that species<br />
distribution ranges are considerably smaller than their potential ranges. We show<br />
strong phylogenetic signal in various macroecological niche features.<br />
*Correspondence: Heroen Verbruggen,<br />
<strong>Phycology</strong> <strong>Research</strong> <strong>Group</strong>, Krijgslaan 281 S8,<br />
B-9000 Ghent, Belgium.<br />
E-mail: heroen.verbruggen@ugent.be<br />
†These authors contributed equally to this<br />
work<br />
Main conclusions The evolution of Halimeda is characterized by conservatism<br />
for tropical, nutrient-depleted habitats, yet one section of the genus managed to<br />
invade colder habitats multiple times independently. Niche models indicate that the<br />
restricted geographical ranges of Halimeda species are not due to habitat unsuitability,<br />
strengthening the case for dispersal limitation. Niche models identified hotspots of<br />
habitat suitability of Caribbean species in the eastern Pacific Ocean. We propose that<br />
these hotspots be targeted for discovery of new species separated from their Caribbean<br />
siblings since the Pliocene rise of the Central American Isthmus.<br />
Keywords<br />
Geographical information systems, Halimeda, historical biogeography, macroecology,<br />
niche evolution, niche conservatism, niche modelling, phylogenetics.<br />
INTRODUCTION<br />
Various interacting features influence the distribution of a<br />
species. The niche of a species is commonly defined as the set of<br />
biotic <strong>and</strong> abiotic conditions in which it is able to persist <strong>and</strong><br />
maintain stable population sizes (Hutchinson, 1957). Further<br />
distinction is made between a species’ fundamental niche, which<br />
consists of the set of all conditions that allow for its long-term<br />
survival, <strong>and</strong> the realized niche, which is a subset of the fundamental<br />
niche that a species actually occupies. Species tolerances<br />
are determined by their morphological, reproductive <strong>and</strong><br />
physiological traits, which are in turn susceptible to evolutionary<br />
forces. Hence, niche characteristics can be interpreted as evolutionary<br />
phenomena. Underst<strong>and</strong>ing niche evolution yields valuable insights<br />
into biogeography, biodiversity patterns <strong>and</strong> conservation biology<br />
(Wiens & Graham, 2005; Rissler et al., 2006; Wiens et al., 2007).<br />
DOI: 10.1111/j.1466-8238.2009.00463.x<br />
© 2009 Blackwell Publishing Ltd www.blackwellpublishing.com/geb 393
H. Verbruggen et al.<br />
The niche concept provides a conceptual framework to predict<br />
geographical distributions of species. Niche models establish the<br />
macroecological preferences of a given species based on observed<br />
distribution records <strong>and</strong> a set of macroecological variables, <strong>and</strong><br />
these preferences can subsequently be used to predict geographical<br />
areas with suitable habitat for the species (e.g. Guisan & Thuiller,<br />
2005; Raxworthy et al., 2007; Rissler & Apodaca, 2007). The<br />
availability of macroecological data, either in the form of<br />
remotely sensed or interpolated measurement data, is increasing<br />
<strong>and</strong> has already provided many biological studies with environmental<br />
information (Kozak et al., 2008). To date, most ecological<br />
niche modelling studies have focused on terrestrial organisms.<br />
A notable exception is the study by Graham et al. (2007), which<br />
used a synthetic oceanographic <strong>and</strong> ecophysiological model to<br />
identify known kelp populations <strong>and</strong> predict the existence of<br />
undiscovered kelp habitats in deep tropical waters.<br />
Integration of niche models, macroecological data <strong>and</strong> phylogenetic<br />
information yields information on niche shifts <strong>and</strong><br />
insights into the evolution of environmental preferences across<br />
phylogenetic trees. So far, evolutionary niche dynamics have<br />
been studied almost exclusively in terrestrial organisms (e.g.<br />
Graham et al., 2004; Knouft et al., 2006; Yesson & Culham, 2006)<br />
<strong>and</strong> little information is available on niche evolution of the<br />
organisms inhabiting the world’s oceans. Seaweeds appear to be<br />
an excellent model system for studying the evolutionary dynamics<br />
of the macroecological niche in coastal marine organisms.<br />
Individual seaweed specimens are fixed in one location, yielding<br />
a direct link to georeferenced macroecological data. As a whole,<br />
seaweeds occur in a wide range of coastal habitats <strong>and</strong> many<br />
seaweed genera or families have a world-wide distribution,<br />
resulting in sufficient variability in macroecological dimensions<br />
<strong>and</strong> biogeographical patterns. Evolutionary relationships<br />
between <strong>and</strong> within seaweed genera are being characterized in<br />
increasing detail as a result of molecular phylogenetic research<br />
during the past few decades. Finally, seaweeds are straightforward<br />
to collect <strong>and</strong> process, making them easy targets for this<br />
kind of research.<br />
The marine green algal genus Halimeda is among the betterstudied<br />
seaweeds from a phylogenetic perspective <strong>and</strong> is<br />
therefore an obvious c<strong>and</strong>idate for studies of niche evolution <strong>and</strong><br />
biogeography. Halimeda consists of segmented, calcified thalli<br />
<strong>and</strong> abounds on <strong>and</strong> around coral reefs <strong>and</strong> in lagoons throughout<br />
the tropics <strong>and</strong> subtropics up to depths in excess of 150 m<br />
(Hillis-Colinvaux, 1980). Halimeda species are important<br />
primary producers <strong>and</strong> provide food <strong>and</strong> habitat for small<br />
animals <strong>and</strong> epiflora (Jensen et al., 1985; Naim, 1988). After the<br />
algae reproduce, they die <strong>and</strong> their calcified segments are shed.<br />
Halimeda segments account for up to 90% of tropical beach s<strong>and</strong><br />
<strong>and</strong> carbonate rock of tropical reefs (e.g. Drew, 1983; Freile et al.,<br />
1995). The biogeography of Halimeda has been described in<br />
some detail. All but one species are restricted to a single ocean<br />
basin (Indo-Pacific or Atlantic), <strong>and</strong> biogeography has a strong<br />
phylogenetic imprint: each of the five sections of the genus is<br />
separated into Atlantic <strong>and</strong> Indo-Pacific sublineages, suggestive<br />
of a strong vicariance event. Even though the species distribution<br />
ranges <strong>and</strong> the historical biogeographical patterns have been<br />
identified, questions about what causes them remain (Kooistra<br />
et al., 2002; Verbruggen et al., 2005b). Are species restricted to<br />
one ocean basin because of habitat unsuitability in the other<br />
basin or should the limited distribution ranges be attributed to<br />
dispersal limitation? It is also not known with certainty which<br />
vicariance event may be responsible for the phylogenetic<br />
separation of Indo-Pacific <strong>and</strong> Atlantic lineages. So far, two<br />
geological events have been implied: the Miocene closure of the<br />
Tethys Seaway in the Middle East <strong>and</strong> the Pliocene shoaling of the<br />
Central American Isthmus (Kooistra et al., 2002; Verbruggen<br />
et al., 2005b).<br />
The first goal of the present study is to investigate the<br />
evolutionary niche dynamics of the seaweed genus Halimeda,<br />
focusing on niche dimensions relevant to global geographical<br />
distributions rather than local distributional issues such as<br />
microhabitat preferences. The second goal is to investigate two<br />
aspects of the biogeography of the genus: why are species<br />
restricted to a single ocean basin <strong>and</strong> what caused the historical<br />
biogeographical splits. Our approach consists of a combination<br />
of molecular phylogenetics, niche modelling, optimization of<br />
models of macroecological trait evolution, <strong>and</strong> ancestral state<br />
estimation.<br />
MATERIALS AND METHODS<br />
Species identifications<br />
Species delimitation was based on a combination of DNA<br />
sequence data <strong>and</strong> morphological knowledge, with molecular<br />
data serving as the primary source of information used to define<br />
species boundaries <strong>and</strong> morphological species boundaries being<br />
assessed secondarily, using the species groups determined with<br />
DNA data. We used this approach because traditional morphological<br />
species definitions are often inaccurate in seaweeds due to<br />
morphological plasticity, convergence <strong>and</strong> cryptic speciation<br />
(e.g. Saunders & Lehmkuhl, 2005). The proposed approach has<br />
previously been applied to define species boundaries more<br />
accurately (Verbruggen et al., 2005a).<br />
The DNA datasets initiated by Kooistra et al. (2002) <strong>and</strong><br />
Verbruggen (2005) were extended for this study using previously<br />
described protocols (Verbruggen, 2005), resulting in 264 UCP7<br />
sequences, 337 ITS sequences <strong>and</strong> 106 tufA sequences belonging<br />
to a total of 444 specimens. These three datasets were subjected<br />
to neighbour joining analysis to detect species-level clusters.<br />
Using this approach, the sequenced specimens were attributed to<br />
52 Halimeda species. If easily recognizable combinations of<br />
morphological features could be identified for species by<br />
studying the sequenced specimens, these features were used for<br />
identification of additional collections from various herbaria<br />
(BISH, Bishop Museum; GENT, Ghent University; L, Nationaal<br />
Herbarium Nederl<strong>and</strong>, Leiden University branch; PC,<br />
Muséum National d’Histoire Naturelle; UPF, Université de<br />
Polynésie Française; US, Smithsonian Institution) that were not<br />
suitable for sequencing (see the Index Herbariorum website<br />
(http://sweetgum.nybg.org/ih/) for further herbarium<br />
details).<br />
394 <strong>Global</strong> <strong>Ecology</strong> <strong>and</strong> <strong>Biogeography</strong>, 18, 393–405, © 2009 Blackwell Publishing Ltd
Evolutionary niche dynamics in the seaweed Halimeda<br />
Preprocessing observation data<br />
Recent collections had accurate coordinates recorded with a<br />
global positioning device. Older collections with detailed locality<br />
information were georeferenced (latitude <strong>and</strong> longitude) using<br />
Google Earth (http://earth.google.com). Points that fell ashore<br />
when plotted on coarse-resolution environmental grids were<br />
manually moved to the adjacent coastal waters using idrisi<br />
Andes (http://www.clarklabs.org/). Data were examined for<br />
georeferencing errors by checking for geographical outliers with<br />
visual <strong>and</strong> overlay methods in Arcgis (http://www.esri.com/).<br />
Errors were identified by creating an overlay between the point<br />
locality layer <strong>and</strong> a maritime boundaries layer (exclusive economic<br />
zones <strong>and</strong> coastlines) provided by the Fl<strong>and</strong>ers Marine Institute<br />
(http://www.vliz.be/). Any mismatch between these layers was<br />
indicative of a potential georeferencing error <strong>and</strong> outlying points<br />
were removed if their origin could not be confirmed.<br />
Species phylogeny<br />
The evolutionary history underlying the 52 species of Halimeda<br />
included in the study was inferred from a multilocus DNA<br />
dataset using Bayesian phylogenetic inference (Holder & Lewis,<br />
2003). Bayesian phylogenetic inference techniques make explicit<br />
use of models of sequence evolution, an approach that has been<br />
shown to outperform methods that do not assume such models<br />
(Swofford et al., 2001). Sequence data from four chloroplast<br />
loci (rbcL, tufA, UCP3, UCP7) <strong>and</strong> two nuclear markers (SSU<br />
nrDNA, ITS region) were obtained following previously<br />
described protocols (Famà et al., 2002; Kooistra et al., 2002;<br />
Provan et al., 2004; Lam & Zechman, 2006) or from previously<br />
published studies (Kooistra et al., 2002; Verbruggen et al.,<br />
2005a,b). Individual loci were aligned by eye <strong>and</strong> ambiguous<br />
regions were removed. Data for a few loci were missing mainly<br />
for recently discovered species but the concatenated data matrix<br />
was 90% filled. The final alignment can be obtained from<br />
http://www.phycoweb.net/ <strong>and</strong> http://www.treebase.org/. All new<br />
sequences generated in this study have been submitted to<br />
GenBank (accession numbers FJ624485–FJ624863).<br />
In order to identify a suitable model of sequence evolution for<br />
our dataset, we used model selection procedures based on the<br />
second-order Akaike information criterion (AICc) (Sullivan,<br />
2005). The phylogenetic analysis was carried out with the model<br />
of sequence evolution that yielded the lowest AICc score. This<br />
model contained 14 partitions: SSU nrDNA, the ITS region <strong>and</strong><br />
three codon positions per protein-coding gene. The GTR + Γ 8<br />
substitution models yielded the best fit to the data for all<br />
partitions. Bayesian phylogenetic inference was carried out with<br />
MrBayes v.3.1.2 (Ronquist & Huelsenbeck, 2003). Five runs of<br />
four incrementally heated chains were run for 10 million generations<br />
using default priors <strong>and</strong> chain temperature settings.<br />
Convergence of the Markov chain Monte Carlo (MCMC) runs<br />
was assessed with Tracer v.1.4 (Rambaut & Drummond, 2007).<br />
An appropriate burn-in was determined with the automated<br />
method proposed by Beiko et al. (2006) <strong>and</strong> a majority rule consensus<br />
tree was built from the post-burn-in trees. The tree was<br />
rooted at the point where root-to-tip path length variance was<br />
minimal.<br />
The branch lengths of the obtained consensus phylogram are<br />
proportional to the estimated amount of molecular evolution<br />
occurring on the branches. In order to model character evolution,<br />
in our case evolutionary niche dynamics, branch lengths should<br />
be proportional to evolutionary time rather than amounts of<br />
molecular evolution. To obtain a chronogram (i.e. a phylogram<br />
with branch lengths proportional to evolutionary time), penalized<br />
likelihood rate smoothing (S<strong>and</strong>erson, 2002) was carried out on<br />
the consensus tree with r8s (S<strong>and</strong>erson, 2003), using both the<br />
additive <strong>and</strong> the log-additive penalty settings. The root of the<br />
phylogeny was assigned an age of 147 Ma, following the molecular<br />
clock result from Verbruggen et al. (2009). We refer to the latter<br />
paper for details regarding the dating of the phylogeny.<br />
Macroecological data<br />
Macroecological variables were selected to represent the major<br />
environmental dimensions assumed to influence seaweed<br />
distribution at a global scale <strong>and</strong> subject to data availability<br />
(Lüning, 1990) (Table 1). The base macroecological data<br />
included geophysical, biotic <strong>and</strong> climate variables derived from<br />
level-3 preprocessed satellite data (Aqua-MODIS <strong>and</strong> SeaWiFS)<br />
available at OceanColor Web (http://oceancolor.gsfc.nasa.gov/).<br />
We downloaded grids representing monthly averages at a 5 arcmin<br />
(≈ 9.2 km) spatial resolution. These geometrically corrected<br />
images are two-dimensional arrays with an equidistant cylindrical<br />
Table 1 Geophysical parameters included in the macroecological dataset.<br />
Macroecological parameter<br />
Units<br />
Original spatial<br />
resolution (arcmin) Date Source Derived parameters<br />
Sea surface temperature (SST) °C 2.5 2003–2007 Aqua-MODIS (NASA) Max, min, average<br />
(day <strong>and</strong> night)<br />
Diffuse attenuation (DA) m −1 2.5 2003–2007 Aqua-MODIS (NASA) Max, min, average<br />
Calcite concentration (Ca) mol/m 3 2.5 2006 Aqua-MODIS (NASA) Average<br />
Chlorophyll A (CHLO) mg/m 3 5 1998–2007 SeaWiFS (NASA) Max, min, average<br />
Photosynthetically active<br />
radiation (PAR)<br />
Einstein/m 2 /day 5 1998–2007 SeaWiFS (NASA) Max, min, average<br />
<strong>Global</strong> <strong>Ecology</strong> <strong>and</strong> <strong>Biogeography</strong>, 18, 393–405, © 2009 Blackwell Publishing Ltd 395
H. Verbruggen et al.<br />
(Platte Carre) projection of the globe. Yearly minimum,<br />
maximum <strong>and</strong> average values were calculated from the monthly<br />
averages with matlab (http://www.mathworks.com/). To achieve<br />
this, average monthly images were generated by averaging images<br />
of the same month across years (e.g. average sea surface temperature<br />
(SST) of July from 2003 to 2007). Subsequently, yearly<br />
minimum <strong>and</strong> maximum images were composed by selecting<br />
the minimum <strong>and</strong> maximum pixels from these monthly averages.<br />
Finally, yearly average images were created by taking the mean<br />
value for every grid cell of the monthly averages. All images were<br />
cropped to the latitudinal range 50° N–40° S, which includes the<br />
highest latitudes at which Halimeda can be found.<br />
Evolutionary analysis of niche characteristics<br />
The evolutionary dynamics of niche features were studied by<br />
inferring their patterns of change along the chronogram in a<br />
maximum likelihood (ML) framework. The macroecological<br />
niche features included in our study are continuous variables <strong>and</strong><br />
we inferred their evolution with common models of continuous<br />
trait evolution. Brownian motion models, also known as<br />
constant-variance r<strong>and</strong>om walk models, assume that traits vary<br />
naturally along a continuous scale <strong>and</strong> that variation is accumulated<br />
proportionally to evolutionary time, as measured by the<br />
branch lengths in a chronogram (Martins & Hansen, 1997; Pagel,<br />
1999). Two branch length scaling parameters (lambda <strong>and</strong><br />
kappa) were used to extend this model <strong>and</strong> better describe the<br />
mode <strong>and</strong> tempo of trait evolution (Pagel, 1999). Lambda (λ)<br />
transformations measure the amount of phylogenetic signal<br />
present in a continuous character. The transformation consists of<br />
multiplying all internal branch lengths of the tree by λ, leaving<br />
tip branches their original length. When the ML estimate of λ is<br />
close to 1, the internal branches retain their original length,<br />
indicating strong phylogenetic signal in the trait. If λ approaches<br />
0, the evolution of the trait is virtually independent of phylogeny.<br />
Kappa (κ) transformations measure the degree of punctuational<br />
versus gradual evolution of characters on a phylogeny, by raising<br />
all branch lengths to the power κ. If the ML estimate of κ is close<br />
to 0, all branch lengths approach unity, <strong>and</strong> path lengths become<br />
proportional to the number of lineage splitting events, suggesting<br />
that the evolution of the trait approximates punctuated evolution<br />
associated with speciation events. If the ML estimate of κ is close<br />
to 1, branch lengths remain unchanged, indicating that the<br />
amount of change in the character is proportional to evolutionary<br />
time. In other words, κ values close to 1 indicate gradual evolution.<br />
In order to fit the models above <strong>and</strong> infer changes of the<br />
macroecological niche along the species phylogeny, a<br />
species × variables matrix had to be constructed. To achieve this,<br />
the values of the macroecological data layers were extracted for<br />
each sample locality. For each species, the minimum, maximum<br />
<strong>and</strong> average of each macroecological parameter were stored in<br />
the species × variables matrix. To reduce the influence of<br />
geographical sampling bias on the average values, they were<br />
calculated by weighted averaging. The Euclidean distance from<br />
the sample location to the centre of gravity for the species in<br />
question was used as the sample weight. The centre of gravity for<br />
the species was determined by averaging the three-dimensional<br />
Cartesian coordinates of all sample locations for that species.<br />
The models of continuous trait evolution listed above were<br />
optimized along the phylogenetic tree for the minimum, average<br />
<strong>and</strong> maximum values of a selection of niche variables using the<br />
ML optimization of the geiger package (Harmon et al., 2008).<br />
Ancestral character values for macroecological niche features<br />
were estimated by ML inference (Schluter et al., 1997) with the<br />
ape package (Paradis et al., 2004). Resulting ancestral state values<br />
were plotted on the phylogeny with TreeGradients v1.03<br />
(Verbruggen, 2008).<br />
Niche modelling procedure<br />
The macroecological niches of species were modelled with<br />
Maxent, a presence-only niche modelling technique based on<br />
the maximum entropy principle (Phillips et al., 2006). We used a<br />
presence-only technique because only specimen collection data<br />
are available <strong>and</strong> absence data cannot be reliably obtained for<br />
seaweed species on a global scale. Maxent has shown remarkably<br />
good performance in a comparative study of presence-only niche<br />
modelling techniques (Elith et al., 2006). It estimates the probability<br />
distribution of maximum entropy (i.e. that is most spread out, or<br />
closest to uniform) of each macroecological variable across the<br />
study area. This distribution is calculated with the constraint that<br />
the expected value of each macroecological variable under the<br />
estimated distribution matches the empirical average generated<br />
from macroecological values associated with species occurrence<br />
data. The model output consists of a spatially explicit probability<br />
surface that represents an ecological niche (habitat suitability)<br />
translated from macroecological space into geographical space.<br />
The output grid is in the logistic format, where each pixel value<br />
represents the estimated probability that the species can be<br />
present at that pixel (Phillips & Dudík, 2008).<br />
To avoid using redundant <strong>and</strong> correlated macroecological<br />
layers for niche modelling, an unst<strong>and</strong>ardized principal component<br />
analysis was performed on the original variables in idrisi<br />
Andes. The first, second <strong>and</strong> third principal component grids,<br />
which together accounted for 98.82% of the overall variance in the<br />
original variables, were exported for subsequent use in Maxent.<br />
<strong>Global</strong> species niches were modelled for all Halimeda species<br />
for which more than 10 distribution records were available, while<br />
excluding species with distribution records suffering from high<br />
spatial autocorrelation. Additionally, a single regional model was<br />
generated using pooled occurrence data of six Caribbean species<br />
(Halimeda goreauii, Halimeda simulans, Halimeda incrassata,<br />
Halimeda monile, Halimeda discoidea.atl <strong>and</strong> Halimeda tuna.car).<br />
The Maxent algorithm was run with default parameters<br />
(convergence threshold = 10 –5 , maximum iterations = 500,<br />
regularization multiplier = 1, maximum number of background<br />
points = 10,000, <strong>and</strong> use of linear, quadratic, product <strong>and</strong> hinge<br />
features). Models were created using 80% of the localities for<br />
model training <strong>and</strong> 20% for model testing.<br />
Statistical evaluation of the models was based on thresholdindependent<br />
receiver operating characteristic (ROC) analysis<br />
(Phillips et al., 2006). For presence-only modelling, the ROC<br />
396 <strong>Global</strong> <strong>Ecology</strong> <strong>and</strong> <strong>Biogeography</strong>, 18, 393–405, © 2009 Blackwell Publishing Ltd
Evolutionary niche dynamics in the seaweed Halimeda<br />
curve is a plot of sensitivity (proportion of correctly predicted<br />
presences) against the fractional area predicted present. The area<br />
under the ROC curve (AUC) is subsequently compared with the<br />
area under the null expectations line connecting the origin <strong>and</strong><br />
(1,1), thus providing a measure of predictive model performance.<br />
An AUC approximating 1 would mean optimal discrimination of<br />
suitable versus unsuitable sites, whereas an AUC between 0 <strong>and</strong><br />
0.5 is indicative of predictions no better than r<strong>and</strong>om. Additionally,<br />
we use a modified AUC based on partial ROC curves as proposed<br />
by Peterson et al. (2008). This approach accounts for a user-defined<br />
maximum acceptable omission error, which we set at 0.1, <strong>and</strong><br />
takes only the range of acceptable models in terms of omission<br />
error into account. The partial AUC is then rationed to the<br />
partial area under the null expectations line. Hence, the AUC<br />
ratio equals 1 for models performing no better than r<strong>and</strong>om, <strong>and</strong><br />
increases with improving model accuracy. All partial AUC<br />
calculations were performed in the R statistical computing<br />
environment (R Development Core Team, 2008).<br />
RESULTS<br />
Species delimitation <strong>and</strong> phylogeny<br />
Neighbour joining analysis of the UCP7, ITS <strong>and</strong> tufA sequence<br />
alignments pointed out 52 clusters with low sequence divergence<br />
within clusters <strong>and</strong> relatively high divergence between clusters, as<br />
is typically found at the species boundary (Hebert et al., 2004;<br />
Verbruggen et al., 2005a). Not all clusters corresponded to<br />
described, named species. The undescribed clusters represent<br />
cryptic or pseudo-cryptic species (Kooistra et al., 2002; Verbruggen<br />
et al., 2005a,b). The clusters inferred from DNA data formed the<br />
basis of the species definitions used in the remainder of the<br />
paper. After the addition of morphologically identified herbarium<br />
specimens, the database consisted of 1080 samples from 538<br />
unique localities. Analysis of the concatenated alignment of rbcL,<br />
tufA, UCP3, UCP7, 18S <strong>and</strong> ITS sequences (4965 characters) yielded<br />
a well-resolved species phylogeny in which five lineages, corresponding<br />
to the five sections of the genus, could be recognized<br />
(Fig. 1).<br />
Evolution of niche characteristics<br />
A few niche features contained considerable amounts of phylogenetic<br />
signal, as indicated by the high ML estimates of λ values using<br />
Pagel’s lambda branch length modifier (Table 2). A general<br />
observation was that average trait values contained more phylogenetic<br />
signal than minimum <strong>and</strong> maximum trait values (e.g.<br />
average temperature, not minimum or maximum temperature).<br />
High κ values for the average trait values indicate that change of<br />
these traits is proportional to evolutionary time; in other words,<br />
change is gradual (Table 2). Some traits that also contained<br />
phylogenetic signal were not included in the table because of<br />
significant correlation with the listed variables. This is the case<br />
for photosynthetically active radiation, which is correlated with<br />
SST, <strong>and</strong> diffuse attenuation, which is correlated with chlorophyll<br />
values (caused by phytoplankton).<br />
Table 2 Optimum values of the branch length scaling parameters λ<br />
<strong>and</strong> κ used to test the mode <strong>and</strong> tempo of evolution of niche features.<br />
The niche traits are sea surface temperature (SST) <strong>and</strong> chlorophyll A<br />
(CHLO) values. The high optimal λ values inferred for average trait<br />
values indicate strong phylogenetic signal in these traits whereas the<br />
low λ values obtained for the minimum <strong>and</strong> maximum traits suggest<br />
a lack of phylogenetic signal. The relatively high optimum values for<br />
κ for average SST values suggest that evolution of this niche feature<br />
was more or less gradual (proportional to time). The lower value for<br />
average CHLO suggests that there is a non-negligible punctuated<br />
component to the evolution of nutrient preferences. The first two<br />
columns used the tree smoothed with the additive penalty; the last<br />
two columns used the tree smoothed with the log-additive penalty.<br />
The κ parameter was not optimized when there was poor<br />
phylogenetic signal in the data (low λ).<br />
Trait Optimal λ Optimal κ Optimal λ Optimal κ<br />
Max SST 0.07262 0.05448<br />
Average SST 0.90087 0.83616 0.15159 0.66764<br />
Min SST 0.09371 0.05308<br />
Min CHLO 0.10672 0.06804<br />
Average CHLO 0.78528 0.47084 0.80792 0.37894<br />
Max CHLO 0.01364 0.00000<br />
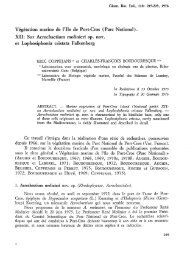
Figure 2 illustrates the estimated evolutionary patterns of<br />
average annual temperature <strong>and</strong> chlorophyll values. Estimated<br />
ancestral trait values are shown at the internal nodes <strong>and</strong> visualized<br />
using a colour gradient. An average annual temperature of<br />
27.4 °C (95% confidence interval, 25.6–29.2) is inferred at the<br />
basal split (Fig. 2a), indicating a tropical origin for the genus.<br />
The tree clearly shows that evolution along the SST niche<br />
dimension is not homogeneous throughout the tree. Whereas<br />
the sections Rhipsalis, Micronesicae, Pseudo-opuntia <strong>and</strong> Opuntia<br />
barely deviate from typical tropical temperatures, evolution along<br />
the temperature axis has been common in section Halimeda.<br />
More specifically, the lineages leading to H. tuna.med, Halimeda<br />
cuneata.africa.1, H. cuneata.africa.2 <strong>and</strong> H. cuneata.australia<br />
have evolved a preference for colder water. Chlorophyll values<br />
were mapped onto the phylogeny as a proxy for nutrient preferences<br />
(Fig. 2b). Deviations from the average (low) nutrient preference<br />
values are present in Halimeda section Halimeda (H. cuneata.brazil,<br />
H. cuneata.africa.1, H. cuneata.africa.2, H. cuneata.australia,<br />
H. cuneata.arabia <strong>and</strong> Halimeda magnicuneata) <strong>and</strong> in Halimeda<br />
section Rhipsalis (H. incrassata).<br />
Niche models at the global scale<br />
Niche models indicating the areas where macroecological<br />
conditions are suitable for species to occur were generated for all<br />
species (Figs 3 & S1). The average AUC across all models with<br />
20% test localities was 0.917 (SD = 0.046) for the training data<br />
<strong>and</strong> 0.906 (SD = 0.054) for the test data. The corresponding<br />
average AUC ratios were 1.576 (SD = 0.209) for the training data<br />
<strong>and</strong> 1.615 (SD = 0.234) for the test data. The high AUC values<br />
<strong>and</strong> ratios indicate that the most essential macroecological variables<br />
determining species distributions were accounted for in the<br />
<strong>Global</strong> <strong>Ecology</strong> <strong>and</strong> <strong>Biogeography</strong>, 18, 393–405, © 2009 Blackwell Publishing Ltd 397
H. Verbruggen et al.<br />
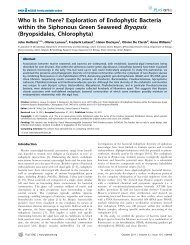
Figure 1 Phylogenetic tree of 52 Halimeda<br />
species inferred from six molecular loci using<br />
Bayesian techniques, rooted at the point where<br />
root-to-tip path length variance is minimal.<br />
Numbers at nodes indicate statistical support<br />
(Bayesian posterior probabilities,<br />
in percentages).<br />
dataset. The high scores for the test data indicate adequate model<br />
performance rather than overfitting of the model on the training<br />
data. The predicted distributions are clearly broader than the<br />
known species distributions. For example, the distribution<br />
model of the exclusively Indo-Pacific species H. borneensis<br />
(Fig. 3a) predicts habitat suitability in parts of the Atlantic<br />
Ocean. Similarly, the model of the Caribbean species Halimeda<br />
simulans (Fig. 3b) predicts habitat suitability in parts of the Indo-<br />
Pacific basin. In general, there was a stronger tendency of predicting<br />
Atlantic species into the Indo-Pacific than vice versa.<br />
Niche model at the regional scale<br />
The model predicting suitable habitat for a suite of six Caribbean<br />
species is shown in Fig. 3(c) (AUC ratio = 1.783). Potentially<br />
suitable habitats of these Caribbean species in the eastern Pacific<br />
398 <strong>Global</strong> <strong>Ecology</strong> <strong>and</strong> <strong>Biogeography</strong>, 18, 393–405, © 2009 Blackwell Publishing Ltd
Evolutionary niche dynamics in the seaweed Halimeda<br />
Figure 2 Inferred evolutionary history of niche features in Halimeda. Ancestral values for (a) mean sea surface temperature (SST mean ) <strong>and</strong><br />
(b) mean chlorophyll concentration (CHLO mean ) are plotted along the phylogeny. Numbers plotted at nodes indicate the inferred ancestral<br />
values. These values were obtained using a maximum likelihood approach as described in the text. Values are also drawn along a colour gradient<br />
to allow rapid visual assessment of evolutionary patterns. Green indicates low values, red st<strong>and</strong>s for high values <strong>and</strong> yellowish colours indicate<br />
intermediate values. The geographical origin of species is indicated with coloured taxon names.<br />
are mainly predicted along the southern coast of Panama,<br />
the western coast of Colombia <strong>and</strong> in the Galapagos Isl<strong>and</strong>s<br />
(Fig. 3c–e).<br />
DISCUSSION<br />
The obtained results invite discussion about several issues related<br />
to the macroecological niche of seaweeds, how it evolves <strong>and</strong> how<br />
it relates to patterns of biogeography.<br />
Modelling seaweed distributions<br />
Niche modelling versus previous approaches<br />
Our niche models indicate areas where the macroecological<br />
conditions are likely to be suitable for various Halimeda species<br />
to establish populations. They reflect the marked tropical nature<br />
of most species <strong>and</strong> show that many species occupy only part of<br />
the potentially suitable habitat (see below). Previous knowledge<br />
about the macroecological niche of seaweeds mainly stemmed<br />
from comparing distribution ranges with isotherms (isotherm<br />
fitting), studying survival <strong>and</strong> growth under various culture conditions<br />
or a combination of both approaches (e.g. van den Hoek,<br />
1982). These approaches <strong>and</strong> the niche modelling approach<br />
presented here differ from each other in a number of aspects.<br />
Whereas the fundamental niche is investigated with in vitro<br />
studies of survival <strong>and</strong> growth, the realized niche is central in<br />
modelling techniques <strong>and</strong> isotherm fitting. A fundamental<br />
difference between niche modelling <strong>and</strong> both the other<br />
approaches is that the former yields probabilistic output whereas<br />
the latter usually propose hard thresholds. The ease with which a<br />
niche modelling study can be carried out has benefits as well as<br />
<strong>Global</strong> <strong>Ecology</strong> <strong>and</strong> <strong>Biogeography</strong>, 18, 393–405, © 2009 Blackwell Publishing Ltd 399
H. Verbruggen et al.<br />
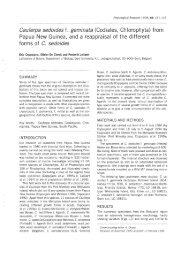
Figure 3 Predictive ecological niche models of Halimeda species inferred from environmental data <strong>and</strong> species occurrence records. (a) Niche<br />
model of the exclusively Indo-Pacific species Halimeda borneensis indicating habitat suitability in some Atlantic regions. (b) Niche model of the<br />
exclusively Caribbean species Halimeda simulans predicting habitat suitability in several Indo-Pacific regions. (c) Pooled niche model of six<br />
Caribbean Halimeda species predicting habitat suitability along parts of the Pacific coast of Central America. (d) Detailed view of the areas along<br />
the Pacific coastlines of Panama, Colombia <strong>and</strong> Ecuador predicted by the model from panel c. (e) Detailed view of the Galapagos Archipelago as<br />
predicted by the model from panel c. Predicted habitat suitability is indicated with colours along a gradient, warmer colours indicating areas with<br />
better predicted conditions. White squares indicate specimen localities used for model training. All maps are equidistant cylindrical projections.<br />
[Correction added after online publication 6 May 2009: the figure image was replaced to correct the colour gradient in the legend, which was<br />
previously inverted.]<br />
drawbacks. The advantage is obvious when targeting species that<br />
are difficult to grow in culture. A disadvantage of niche modelling<br />
is that the choice of a specific niche modelling algorithm <strong>and</strong> the<br />
parameter settings may influence niche predictions <strong>and</strong> predictive<br />
model performance (Elith et al., 2006; Peterson et al., 2008). The<br />
maximum entropy method with ROC modifications appeared to<br />
be the most suitable option for our goals. All methods share the<br />
drawback of being sensitive to specimen sampling. In this<br />
respect, the absolute number of samples is likely to be of inferior<br />
importance compared with the spread of samples across relevant<br />
macroecological dimensions (Pearson, 2007).<br />
Taxonomic caveat<br />
An additional concern about the application of niche models in<br />
seaweed research is the ease with which heterogeneous distribution<br />
400 <strong>Global</strong> <strong>Ecology</strong> <strong>and</strong> <strong>Biogeography</strong>, 18, 393–405, © 2009 Blackwell Publishing Ltd
Evolutionary niche dynamics in the seaweed Halimeda<br />
records can be used to generate models. As mentioned earlier,<br />
morphological species delimitation is troublesome in algae <strong>and</strong>,<br />
as a consequence, published species occurrence records based on<br />
morphological identifications are not always meaningful. We<br />
have taken great caution to avoid identification errors through<br />
DNA-guided species delimitation.<br />
Macroevolution of the macroecological niche<br />
Historical perspective<br />
Evolutionary processes are influenced by environmental variation<br />
in space <strong>and</strong> time (Kozak et al., 2008). Many studies taking a<br />
niche modelling approach to the study of environmental variation<br />
in a phylogenetic framework have shown strong heritability of<br />
macroecological preferences (e.g. Martínez-Meyer & Peterson,<br />
2006; Yesson & Culham, 2006). To our knowledge, these studies<br />
have all focused on terrestrial organisms. The evolutionary<br />
dynamics of the niche of seaweeds have hardly been studied in<br />
the past. Breeman et al. (2002) investigated the evolution of<br />
temperature responses in the seaweed genus Cladophora. Their<br />
approach consisted of measuring cold tolerance, heat tolerance<br />
<strong>and</strong> growth of various culture strains at different temperature<br />
regimes. The response variables (tissue damage <strong>and</strong> growth<br />
rates) were interpreted along a phylogenetic tree, leading to the<br />
conclusion that the two main lineages of the Cladophora<br />
vagabunda complex had divergent cold tolerances. Although the<br />
experimental data from this study differ from ours as discussed<br />
above, the approach taken to infer niche dynamics in both<br />
studies is not fundamentally different. However, thanks to the<br />
advances in models describing the evolution of continuous characters<br />
that have taken place since the publication of Breeman et al.<br />
(2002) <strong>and</strong> their implementation in user-friendly packages for<br />
the R statistical computing environment (Paradis et al., 2004; Harmon<br />
et al., 2008), much more detailed inferences can now be made.<br />
Niche conservatism<br />
Our study shows that the macroecological niche in the seaweed<br />
genus Halimeda has a strong phylogenetic imprint <strong>and</strong> that<br />
niches appear to change gradually with time. The results clearly<br />
indicate the phylogenetic heritability of macroecological preferences:<br />
four out of five sections (Rhipsalis, Micronesica, Opuntia <strong>and</strong><br />
Pseudo-opuntia) demonstrate conserved preference for high<br />
temperatures <strong>and</strong> low nutrient levels, confirming the association<br />
of these sections with tropical coral reefs <strong>and</strong> shallow lagoons<br />
(Fig. 2). Adaptation to colder <strong>and</strong> more nutrient-rich water only<br />
occurred in section Halimeda. Remarkably, the transition into<br />
colder water seems to have taken place four times independently<br />
(in H. tuna.med, H. cuneata.africa.1, H. cuneata.africa.2 <strong>and</strong><br />
H. cuneata.australia). The species H. tuna.med is the only one<br />
inhabiting the Mediterranean Sea <strong>and</strong> can maintain populations<br />
at sites with yearly sea surface temperature minima around 10 °C.<br />
The species H. cuneata.africa.1 <strong>and</strong> H. cuneata.africa.2 occur in<br />
south-east Africa. H. cuneata.australia is found along the shores<br />
of south-western Australia. Chlorophyll values, used as a proxy<br />
for the trophic status of the surface water (Duan et al., 2007), are<br />
above average for certain species in section Halimeda, often the<br />
subtropical species. It is known that nutrient levels increase with<br />
latitude in the latitudinal range studied here (Sasai et al., 2007).<br />
Halimeda cuneata.brazil occurred in waters with high average<br />
chlorophyll values due to an overall high concentration along the<br />
Brazilian coast. The high average chlorophyll value of waters in<br />
which H. incrassata was recorded is largely due to an outlier<br />
observation in Florida.<br />
Sources of uncertainty<br />
Our study of evolutionary niche dynamics involves several<br />
subsequent analyses, hence a discussion of the potential sources<br />
of uncertainty affecting the final result is in place. The first source<br />
of uncertainty is in the species phylogeny. A lack of support for<br />
phylogenetic relationships will have direct repercussions on the<br />
accuracy of downstream analyses. In our study, the use of a<br />
multilocus alignment yielded very high statistical support for the<br />
great majority of branches in the tree. Therefore we have used the<br />
tree resulting from the Bayesian analysis (Fig. 1) in subsequent<br />
analyses as if it were known without uncertainty. Second,<br />
inferences of trait evolution also depend on branch lengths,<br />
which are affected by two potential sources of uncertainty:<br />
branch length estimation error in the phylogenetic analysis <strong>and</strong><br />
error from the rate smoothing process that transforms the<br />
phylogram into a chronogram. Rate smoothing in particular can<br />
lead to variation in branch lengths if different settings are used.<br />
We followed the recommendations in the manual of the r8s program.<br />
Third, the values used as character states of the terminal<br />
taxon influence the results. We used distance-weighted averages<br />
as fixed character states for the terminal taxa, whereas in reality<br />
there is variation around the average. Taking this variation into<br />
account is expected to broaden confidence intervals on inferred<br />
ancestral states (Martins & Hansen, 1997). A fourth source of<br />
error could result from the inability of Brownian motion models<br />
to capture the complexity of historical forces affecting niche<br />
evolution, a source of error inherent in using simple models to<br />
describe a more complex reality. The last element of uncertainty<br />
lies in the ancestral character estimation, which infers values for<br />
ancestral taxa based on values of recent taxa. These analyses,<br />
however, report the 95% confidence intervals around the<br />
inferred value. If a character evolves fast, this will be reflected in<br />
broader confidence intervals on ancestral character states (Martins,<br />
1999). We have not attempted to quantify the accumulation of<br />
uncertainty throughout our sequence of analyses due to practical<br />
limitations, but the reader should be aware of the assumptions<br />
that were made.<br />
Palaeobiological perspective<br />
Despite the relatively high levels of uncertainty usually associated<br />
with ancestral state estimation of continuous characters<br />
(Schluter et al., 1997), the observed conservatism for environmental<br />
preferences yields a relatively narrow 95% confidence<br />
interval for the average SST characterizing the habitat of the most<br />
<strong>Global</strong> <strong>Ecology</strong> <strong>and</strong> <strong>Biogeography</strong>, 18, 393–405, © 2009 Blackwell Publishing Ltd 401
H. Verbruggen et al.<br />
recent common ancestor of extant Halimeda species (25.6–29.2 °C).<br />
The ML estimate of 27.4 °C appears to be in agreement with the<br />
tropical Tethyan origin of Halimeda that was previously derived<br />
from the fossil record. The earliest known fossil that is considered<br />
to belong to the genus is Halimeda soltanensis from the<br />
Upper Permian (± 250–270 Ma) of Djebel Tebaga in South<br />
Tunisia (Poncet, 1989), which was at that time located at a low<br />
latitude along the western shore of the Tethys Ocean (Smith et al.,<br />
1994). A more diverse assemblage of species with a markedly<br />
tropical distribution had evolved by the Upper Cretaceous<br />
(± 100–65 Ma) (Dragastan & Herbig, 2007). The invasion of<br />
Halimeda into higher latitudes has not been documented in the<br />
fossil record. Our chronogram suggests that the invasion<br />
occurred during late Palaeogene <strong>and</strong> Neogene times, a period<br />
characterized by global cooling (Zachos et al., 2001). This<br />
finding confirms earlier hypotheses that at least parts of the<br />
warm-temperate seaweed floras originated from tropical<br />
ancestry during this period of globally decreasing temperatures<br />
(van den Hoek, 1984; Lüning, 1990).<br />
<strong>Global</strong> biogeography<br />
Dispersal limitation<br />
Halimeda species have previously been shown to be geographically<br />
restricted to either the Atlantic Ocean or the Indo-Pacific basin<br />
(Kooistra et al., 2002; Verbruggen et al., 2005a,b). One could ask<br />
whether the absence of Atlantic species in the Indo-Pacific (<strong>and</strong><br />
vice versa) is a consequence of dispersal limitation or if habitat<br />
differences may be responsible for the limited distributions. The<br />
niche model of the Indo-Pacific species H. borneensis clearly<br />
indicates that some parts of the Caribbean Sea would be suitable<br />
habitat (Fig. 3a) <strong>and</strong> the niche model of the Atlantic species<br />
H. simulans suggests that it could survive in large parts of the<br />
Indo-Pacific tropics (Fig. 3b). Similar patterns were observed for<br />
other species (Fig. S1). So, unless Halimeda species are limited by<br />
habitat differences between the Atlantic <strong>and</strong> Indo-Pacific basins<br />
that are not represented in our macroecological data, it can be<br />
concluded that dispersal limitation is the most likely explanation<br />
for the strong separation of Atlantic <strong>and</strong> Indo-Pacific species.<br />
Dispersal limitation of benthic tropical marine organisms<br />
between oceans is not uncommon (Lessios et al., 2001; Teske<br />
et al., 2007) <strong>and</strong> can be explained by the north–south orientation<br />
of the African <strong>and</strong> American continents, prohibiting marine<br />
dispersal between the Atlantic <strong>and</strong> Indo-Pacific basins through<br />
tropical waters. Halimeda opuntia is the only species that occurs<br />
in both ocean basins. It is part of a clade of Indo-Pacific species,<br />
indicating that it originated in the Indo-Pacific basin <strong>and</strong> subsequently<br />
dispersed to the Atlantic Ocean <strong>and</strong> spread throughout<br />
its tropical regions. It was previously suggested that H. opuntia<br />
was introduced to the Atlantic Ocean by early inter-oceanic<br />
shipping (Kooistra & Verbruggen, 2005). If this scenario is<br />
correct, our model’s prediction that parts of the tropical Atlantic<br />
Ocean form suitable habitat for Indo-Pacific species <strong>and</strong> the<br />
conclusion of dispersal limitation between ocean basins would<br />
be confirmed.<br />
Vicariance patterns<br />
Geographical distribution patterns show a clear phylogenetic<br />
signal: each section separates largely into an Atlantic <strong>and</strong> an<br />
Indo-Pacific lineage (Fig. 1), confirming previous observations<br />
(Kooistra et al., 2002; Verbruggen et al., 2005b). This pattern<br />
indicates ancient lineage splitting through vicariance <strong>and</strong><br />
subsequent diversification within the Atlantic <strong>and</strong> Indo-Pacific<br />
basins. A number of geological events are commonly invoked to<br />
explain sister relationships between strictly Atlantic <strong>and</strong> strictly<br />
Indo-Pacific lineages. The first is the spreading of the Atlantic<br />
Ocean, which started during the Jurassic (± 170–160 Ma) (Smith<br />
et al., 1994). The second is the collision of the African <strong>and</strong><br />
Eurasian plates in the Middle East during the Miocene (± 15–12<br />
Ma) (Rögl & Steininger, 1984). The third event is the closure of<br />
the Central American Seaway in the Pliocene (± 3 Ma) (Coates &<br />
Ob<strong>and</strong>o, 1996). Different events have been hypothesized to be at<br />
the basis of the geographical splits in Halimeda but results have<br />
remained inconclusive (Kooistra et al., 2002; Verbruggen et al.,<br />
2005b). Our chronogram suggests that the splits between<br />
Atlantic <strong>and</strong> Indo-Pacific lineages originated at various times<br />
during the Palaeogene (65–25 Ma). In other words, the time<br />
frame of initial divergence does not correspond closely with<br />
either one of the geological events. During the Palaeogene,<br />
however, an important oceanographic event that may have<br />
limited dispersal between the Atlantic <strong>and</strong> Indo-Pacific ocean<br />
basins took place: the circum-equatorial current that homogenized<br />
the tropical marine biome during the Cretaceous was<br />
deflected to the south of Africa (Lawver & Gahagan, 2003). This<br />
result suggests that geological barriers may not be the initial<br />
cause of divergence between populations but instead act as<br />
barrier reinforcements after divergence has been initiated by<br />
oceanographic events. A similar conclusion was reached in<br />
molecular <strong>and</strong> paleontological studies of species across the<br />
Central American Isthmus (e.g. Collins et al., 1996; Knowlton &<br />
Weigt, 1998). The generality of this pattern requires additional<br />
study. For some organisms at least, divergence times between<br />
Atlantic <strong>and</strong> Indo-Pacific lineages obtained with a molecular clock<br />
match more closely with the timing of the collision of the African<br />
<strong>and</strong> Eurasian plates in the Middle East (e.g. Teske et al., 2007).<br />
Regional biogeography of tropical America<br />
As an alternative to the molecular clock, one would also be able<br />
to infer which geological events were involved in species<br />
partitioning between the Atlantic <strong>and</strong> Indo-Pacific through a<br />
thorough study of eastern Pacific Halimeda species. The<br />
Caribbean <strong>and</strong> eastern Pacific formed a single tropical marine<br />
biota that was separated by the shoaling of the Central American<br />
Isthmus during the Pliocene, resulting in the formation of many<br />
trans-isthmian sister species (Knowlton & Weigt, 1998). The<br />
emergence of a l<strong>and</strong> bridge has been dated at approximately 3 Ma<br />
(Coates & Ob<strong>and</strong>o, 1996). The presence of trans-isthmian<br />
species pairs with a distribution limited to the tropical Americas<br />
(i.e. not in the wider Indo-Pacific) can be taken as evidence for<br />
vicariance across the Central American Isthmus.<br />
402 <strong>Global</strong> <strong>Ecology</strong> <strong>and</strong> <strong>Biogeography</strong>, 18, 393–405, © 2009 Blackwell Publishing Ltd
Evolutionary niche dynamics in the seaweed Halimeda<br />
Only H. discoidea has been reported from the eastern Pacific<br />
<strong>and</strong>, curiously, molecular analyses have shown these populations<br />
not to be related to the Caribbean species H. discoidea.atl as one<br />
may expect but to the Indo-Pacific species H. discoidea.ip<br />
(Verbruggen et al., 2005b). So either Halimeda does not have<br />
trans-isthmian species pairs in the tropical Americas or they have<br />
not been discovered yet. The seaweed flora of the tropical East<br />
Pacific Ocean has not been studied in great detail in the past <strong>and</strong><br />
recent inventories have shown lots of new discoveries (Wysor,<br />
2004). We aimed to facilitate the discovery of trans-isthmian<br />
sister pairs by identifying geographical regions in the East Pacific<br />
Ocean that are hotspots of habitat suitability for Caribbean<br />
species. The niche model of pooled distribution data of six<br />
Caribbean species predicted parts of the East Pacific Ocean as<br />
suitable habitat (Fig. 3c) <strong>and</strong> identified three hotspots of habitat<br />
suitability: the western Galapagos Isl<strong>and</strong>s (Fig. 3e), the west coast<br />
of Colombia <strong>and</strong> parts of the south coast of Panama (Fig. 3d). We<br />
suggest that these areas should be targeted in future research<br />
expeditions aiming to discover trans-isthmian species pairs. The<br />
utility of ecological niche models to guide discovery has already<br />
been documented. Unexplored deep-water kelp forests were<br />
recently found in the Galapagos Archipelago based on predictions<br />
of a synthetic oceanographic <strong>and</strong> ecophysiological model<br />
(Graham et al., 2007). Similarly, expeditions directed by niche<br />
models of chameleons led to the discovery of additional populations<br />
of known species <strong>and</strong> several species new to science (Raxworthy<br />
et al., 2003). It should be noted that the niche model presented<br />
here predicts habitat suitability only as a function of the<br />
macroecological variables included in the dataset. It is beyond<br />
doubt that factors not included in our dataset (e.g. microhabitat<br />
characteristics, tidal amplitudes, grazing pressure <strong>and</strong> other<br />
biotic interactions) affect the actual distribution of species. If<br />
such data were available, they could be used to create a more<br />
specific model <strong>and</strong> would probably result in smaller hotspots,<br />
allowing even more targeted expeditions.<br />
ACKNOWLEDGEMENTS<br />
We thank W. Willems for providing the R script to calculate<br />
partial AUC values <strong>and</strong> for discussion of techniques. We are<br />
grateful to M. Accioly, K. Arano, M. B<strong>and</strong>eira-Pedrosa, C. Battelli,<br />
B. Brooks, K. Clifton, M. Coffroth, P. Colinvaux, R. Collin, E.<br />
Coppejans, O. Dargent, Y. de Jong, G. De Smedt, E. Demeulenare,<br />
R. Diaz, E. Drew, S. Fredericq, C. Galanza, S. Guimaraes,<br />
F. Gurgel, O. Gussmann, R. Haroun, I. Hendriks, J. Hern<strong>and</strong>ez,<br />
L. Hillis, J. Huisman, M. Kaufmann, L. Kirkendale, L. Liao,<br />
D. Littler, M. Littler, G. Llewellyn, P. Marshall, J. Maté, A. Maypo,<br />
A. N’Yeurt, D. Ol<strong>and</strong>esca, C. Ortuno, K. Page, F. Parrish, C. Payri,<br />
G. Procaccini, W. Prud’homme van Reine, L. Raymundo, T.<br />
Schils, E. Tronchin, M. Van Veghel, P. Vroom, S. Williams, S.<br />
Wilson, B. Wysor <strong>and</strong> J. Zuccarello for providing specimens.<br />
Funding was provided by the <strong>Research</strong> Foundation – Fl<strong>and</strong>ers<br />
(research grant G.0142.05 <strong>and</strong> post-doctoral fellowships to H.V.<br />
<strong>and</strong> F.L.) <strong>and</strong> IWT (doctoral fellowship to L.T.). We thank two<br />
anonymous referees for their constructive comments on a<br />
previous version of the manuscript.<br />
REFERENCES<br />
Beiko, R.G., Keith, J.M., Harlow, T.J. & Ragan, M.A. (2006)<br />
Searching for convergence in phylogenetic Markov chain<br />
Monte Carlo. Systematic Biology, 55, 553–565.<br />
Breeman, A.M., Oh, Y.S., Hwang, M.S. & van den Hoek, C.<br />
(2002) Evolution of temperature responses in the Cladophora<br />
vagabunda complex <strong>and</strong> the C. albida/sericea complex<br />
(Chlorophyta). European Journal of <strong>Phycology</strong>, 37, 45–58.<br />
Coates, A.G. & Ob<strong>and</strong>o, J.A. (1996) The geologic evidence of the<br />
Central American Isthmus. Evolution <strong>and</strong> environment in<br />
tropical America (ed. by B.C. Jackson, A.F. Budd & A.G.<br />
Coates), pp. 21–56. University of Chicago Press, Chicago.<br />
Collins, L.S., Budd, A.F. & Coates, A.G. (1996) Earliest evolution<br />
associated with closure of the Tropical American Seaway.<br />
Proceedings of the National Academy of Sciences USA, 93, 6069–<br />
6072.<br />
Dragastan, O.N. & Herbig, H.-G. (2007) Halimeda (green<br />
siphonous algae) from the Paleogene of Morocco south of the<br />
central High Atlas (Morocco) – taxonomy, phylogeny <strong>and</strong><br />
paleoenvironment. Micropaleontology, 53, 1–72.<br />
Drew, E.A. (1983) Halimeda biomass, growth rates <strong>and</strong> sediment<br />
generation on reefs in the central Great Barrier Reef province.<br />
Coral Reefs, 2, 101–110.<br />
Duan, H., Zhang, Y., Zhang, B., Song, K. & Wang, Z. (2007)<br />
Assessment of chlorophyll – a concentration <strong>and</strong> trophic state<br />
for lake Chagan using L<strong>and</strong>sat TM <strong>and</strong> field spectral data.<br />
Environmental Monitoring <strong>and</strong> Assessment, 129, 295–308.<br />
Elith, J., Graham, C.H., Anderson, R.P., Dudík, M., Ferrier, S.,<br />
Guisan, A., Hijmans, R.J., Huettmann, F., Leathwick, J.R.,<br />
Lehmann, A., Li, J., Lohmann, L.G., Loiselle, B.A., Manion, G.,<br />
Moritz, C., Nakamura, M., Nakazawa, Y., Overton, J.M.,<br />
Peterson, A.T., Phillips, S.J., Richardson, K., Scachetti-Pereira, R.,<br />
Schapire, R.E., Soberón, J., Williams, S., Wisz, M.S. &<br />
Zimmermann, N.E. (2006) Novel methods improve prediction<br />
of species’ distributions from occurrence data. Ecography, 29,<br />
129–151.<br />
Famà, P., Wysor, B., Kooistra, W. & Zuccarello, G.C. (2002)<br />
Molecular phylogeny of the genus Caulerpa (Caulerpales,<br />
Chlorophyta) inferred from chloroplast tufA gene. Journal of<br />
<strong>Phycology</strong>, 38, 1040–1050.<br />
Freile, D., Milliman, J.D. & Hillis, L. (1995) Leeward bank<br />
margin Halimeda meadows <strong>and</strong> draperies <strong>and</strong> their sedimentary<br />
importance on the western Great Bahama bank slope. Coral<br />
Reefs, 14, 27–33.<br />
Graham, C.H., Ron, S.R., Santos, J.C., Schneider, C.J. & Moritz,<br />
C. (2004) Integrating phylogenetics <strong>and</strong> environmental niche<br />
models to explore speciation mechanisms in dendrobatid<br />
frogs. Evolution, 58, 1781–1793.<br />
Graham, M.H., Kinlan, B.P., Druehl, L.D., Garske, L.E. & Banks,<br />
S. (2007) Deep-water kelp refugia as potential hotspots of<br />
tropical marine diversity <strong>and</strong> productivity. Proceedings of the<br />
National Academy of Sciences USA, 104, 16576–16580.<br />
Guisan, A. & Thuiller, W. (2005) Predicting species distribution:<br />
offering more than simple habitat models. <strong>Ecology</strong> Letters, 8,<br />
993–1009.<br />
<strong>Global</strong> <strong>Ecology</strong> <strong>and</strong> <strong>Biogeography</strong>, 18, 393–405, © 2009 Blackwell Publishing Ltd 403
H. Verbruggen et al.<br />
Harmon, L.J., Weir, J.T., Brock, C.D., Glor, R.E. & Challenger, W.<br />
(2008) GEIGER: investigating evolutionary radiations.<br />
Bioinformatics, 24, 129–131.<br />
Hebert, P.D.N., Penton, E.H., Burns, J.M., Janzen, D.H. &<br />
Hallwachs, W. (2004) Ten species in one: DNA barcoding<br />
reveals cryptic species in the neotropical skipper butterfly<br />
Astraptes fulgerator. Proceedings of the National Academy of<br />
Sciences USA, 101, 14812–14817.<br />
Hillis-Colinvaux, L. (1980) <strong>Ecology</strong> <strong>and</strong> taxonomy of Halimeda:<br />
primary producer of coral reefs. Advances in Marine Biology,<br />
17, 1–327.<br />
van den Hoek, C. (1982) The distribution of benthic marine<br />
algae in relation to the temperature regulation of their life<br />
histories. Biological Journal of the Linnean Society, 18, 81–144.<br />
van den Hoek, C. (1984) World-wide latitudinal <strong>and</strong> longitudinal<br />
seaweed distribution patterns <strong>and</strong> their possible causes, as<br />
illustrated by the distribution of rhodophytan genera.<br />
Helgoländer Meeresuntersuchungen, 38, 227–257.<br />
Holder, M. & Lewis, P.O. (2003) Phylogeny estimation: traditional<br />
<strong>and</strong> bayesian approaches. Nature Reviews Genetics, 4,<br />
275–284.<br />
Hutchinson, G.E. (1957) Concluding remarks. Cold Spring<br />
Harbor Symposia on Quantitative Biology, 22, 415–427.<br />
Jensen, P.R., Gibson, R.A., Littler, M.M. & Littler, D.S. (1985)<br />
Photosynthesis <strong>and</strong> calcification in four deep-water Halimeda<br />
species (Chlorophyceae, Caulerpales). Deep Sea <strong>Research</strong> Part<br />
I: Oceanographic <strong>Research</strong> Papers, 32, 451–464.<br />
Knouft, J.H., Losos, J.B., Glor, R.E. & Kolbe, J.J. (2006) Phylogenetic<br />
analysis of the evolution of the niche in lizards of the<br />
Anolis sagrei group. <strong>Ecology</strong>, 87, S29–S38.<br />
Knowlton, N. & Weigt, L.A. (1998) New dates <strong>and</strong> new rates for<br />
divergence across the Isthmus of Panama. Proceedings of the<br />
Royal Society B: Biological Sciences, 265, 2257–2263.<br />
Kooistra, W. & Verbruggen, H. (2005) Genetic patterns in the<br />
calcified tropical seaweeds Halimeda opuntia, H. distorta, H.<br />
hederacea <strong>and</strong> H. minima (Bryopsidales, Chlorophyta) provide<br />
insights in species boundaries <strong>and</strong> interoceanic dispersal.<br />
Journal of <strong>Phycology</strong>, 41, 177–187.<br />
Kooistra, W., Coppejans, E.G.G. & Payri, C. (2002) Molecular<br />
systematics, historical ecology, <strong>and</strong> phylogeography of<br />
Halimeda (Bryopsidales). Molecular Phylogenetics <strong>and</strong> Evolution,<br />
24, 121–138.<br />
Kozak, K.H., Graham, C.H. & Wiens, J.J. (2008) Integrating<br />
GIS-based environmental data into evolutionary biology.<br />
Trends in <strong>Ecology</strong> <strong>and</strong> Evolution, 23, 141–148.<br />
Lam, D.W. & Zechman, F.W. (2006) Phylogenetic analyses of the<br />
Bryopsidales (Ulvophyceae, Chlorophyta) based on Rubisco large<br />
subunit gene sequences. Journal of <strong>Phycology</strong>, 42, 669–678.<br />
Lawver, L.A. & Gahagan, L.M. (2003) Evolution of Cenozoic<br />
seaways in the circum-Antarctic region. Palaeogeography,<br />
Palaeoclimatology, Palaeoecology, 198, 11–37.<br />
Lessios, H.A., Kessing, B.D. & Pearse, J.S. (2001) Population<br />
structure <strong>and</strong> speciation in tropical seas: global phylogeography<br />
of the sea urchin Diadema. Evolution, 55, 955–975.<br />
Lüning, K. (1990) Seaweeds: their environment, biogeography, <strong>and</strong><br />
ecophysiology. Wiley & Sons, New York.<br />
Martínez-Meyer, E. & Peterson, A.T. (2006) Conservatism of<br />
ecological niche characteristics in North American plant<br />
species over the Pleistocene-to-Recent transition. Journal of<br />
<strong>Biogeography</strong>, 33, 1779–1789.<br />
Martins, E.P. (1999) Estimation of ancestral states of continuous<br />
characters: a computer simulation study. Systematic Biology,<br />
48, 642–650.<br />
Martins, E.P. & Hansen, T.F. (1997) Phylogenies <strong>and</strong> the comparative<br />
method: a general approach to incorporating<br />
phylogenetic information into the analysis of interspecific<br />
data. The American Naturalist, 149, 646–667.<br />
Naim, O. (1988) Distributional patterns of mobile fauna<br />
associated with Halimeda on the Tiahura coral-reef complex<br />
(Moorea, French Polynesia). Coral Reefs, 6, 237–250.<br />
Pagel, M. (1999) Inferring the historical patterns of biological<br />
evolution. Nature, 401, 877–884.<br />
Paradis, E., Claude, J. & Strimmer, K. (2004) APE: analyses of<br />
phylogenetics <strong>and</strong> evolution in R language. Bioinformatics, 20,<br />
289–290.<br />
Pearson, R.G. (2007) Species’ distribution modeling for conservation<br />
educators <strong>and</strong> practitioners – synthesis. American Museum of<br />
Natural History, New York. Available at: http://ncep.amnh.org/.<br />
Peterson, A.T., Papes, M. & Soberón, J. (2008) Rethinking<br />
receiver operating characteristic analysis applications in<br />
ecological niche modeling. Ecological Modelling, 213, 63 –<br />
72.<br />
Phillips, S.J. & Dudík, M. (2008) Modeling of species distributions<br />
with Maxent: new extensions <strong>and</strong> a comprehensive<br />
evaluation. Ecography, 31, 161–175.<br />
Phillips, S.J., Anderson, R.P. & Schapire, R.E. (2006) Maximum<br />
entropy modeling of species geographic distributions. Ecological<br />
Modelling, 190, 231–259.<br />
Poncet, J. (1989) Présence du genre Halimeda Lamouroux, 1812<br />
(algue verte calcaire) dans Ie Permien supérieur du sud<br />
Tunisien. Revue de Micropaléontologie, 32, 40–44.<br />
Provan, J., Murphy, S. & Maggs, C.A. (2004) Universal plastid<br />
primers for Chlorophyta <strong>and</strong> Rhodophyta. European Journal of<br />
<strong>Phycology</strong>, 39, 43–50.<br />
R Development Core Team (2008) R: a language <strong>and</strong> environment<br />
for statistical computing. Available at: http://www.rproject.org/.<br />
Rambaut, A. & Drummond, A.J. (2007) Tracer. Available at:<br />
http://beast.bio.ed.ac.uk/tracer.<br />
Raxworthy, C.J., Martínez-Meyer, E., Horning, N., Nussbaum,<br />
R.A., Schneider, G.E., Ortega-Huerta, M.A. & Peterson, A.T.<br />
(2003) Predicting distributions of known <strong>and</strong> unknown reptile<br />
species in Madagascar. Nature, 426, 837–841.<br />
Raxworthy, C.J., Ingram, C.M., Rabibisoa, N. & Pearson, R.G.<br />
(2007) Applications of ecological niche modeling for species<br />
delimitation: a review <strong>and</strong> empirical evaluation using day<br />
geckos (Phelsuma) from Madagascar. Systematic Biology, 56,<br />
907–923.<br />
Rissler, L.J. & Apodaca, J.J. (2007) Adding more ecology into<br />
species delimitation: ecological niche models <strong>and</strong> phylogeography<br />
help define cryptic species in the black salam<strong>and</strong>er<br />
(Aneides flavipunctatus). Systematic Biology, 56, 924–942.<br />
404 <strong>Global</strong> <strong>Ecology</strong> <strong>and</strong> <strong>Biogeography</strong>, 18, 393–405, © 2009 Blackwell Publishing Ltd
Evolutionary niche dynamics in the seaweed Halimeda<br />
Rissler, L.J., Hijmans, R.J., Graham, C.H., Moritz, C. & Wake, D.B.<br />
(2006) Phylogeographic lineages <strong>and</strong> species comparisons in<br />
conservation analyses: a case study of California herpetofauna.<br />
The American Naturalist, 167, 655–666.<br />
Rögl, F. & Steininger, F.F. (1984) Neogene Paratethys, Mediterranean<br />
<strong>and</strong> Indo-Pacific seaways. Fossils <strong>and</strong> climate (ed. by P.<br />
Brenchley), pp. 171–200. John Wiley & Sons, New York.<br />
Ronquist, F. & Huelsenbeck, J.P. (2003) MrBayes 3: Bayesian<br />
phylogenetic inference under mixed models. Bioinformatics,<br />
19, 1572–1574.<br />
S<strong>and</strong>erson, M.J. (2002) Estimating absolute rates of molecular<br />
evolution <strong>and</strong> divergence times: a penalized likelihood<br />
approach. Molecular Biology <strong>and</strong> Evolution, 19, 101–109.<br />
S<strong>and</strong>erson, M.J. (2003) r8s: inferring absolute rates of molecular<br />
evolution <strong>and</strong> divergence times in the absence of a molecular<br />
clock. Bioinformatics, 19, 301–302.<br />
Sasai, Y., Sasaoka, K., Sasaki, H. & Ishida, A. (2007) Seasonal <strong>and</strong><br />
intra-seasonal variability of chlorophyll-a in the North Pacific:<br />
model <strong>and</strong> satellite data. Journal of the Earth Simulator, 8, 3 –<br />
11.<br />
Saunders, G.W. & Lehmkuhl, K.V. (2005) Molecular divergence<br />
<strong>and</strong> morphological diversity among four cryptic species of<br />
Plocamium (Plocamiales, Florideophyceae) in northern Europe.<br />
European Journal of <strong>Phycology</strong>, 40, 293–312.<br />
Schluter, D., Price, T., Mooers, A.O. & Ludwig, D. (1997)<br />
Likelihood of ancestor states in adaptive radiation. Evolution,<br />
51, 1699–1711.<br />
Smith, A.G., Smith, D.G. & Funnell, B.M. (1994) Atlas of<br />
Mesozoic <strong>and</strong> Cenozoic coastlines. Cambridge University Press,<br />
Cambridge.<br />
Sullivan, J. (2005) Maximum-likelihood methods for phylogeny<br />
estimation. Molecular Evolution: Producing the Biochemical<br />
Data, Part B. Methods in Enzymology, 395, 757–779.<br />
Swofford, D.L., Waddell, P.J., Huelsenbeck, J.P., Foster, P.G.,<br />
Lewis, P.O. & Rogers, J.S. (2001) Bias in phylogenetic estimation<br />
<strong>and</strong> its relevance to the choice between parsimony <strong>and</strong><br />
likelihood methods. Systematic Biology, 50, 525–539.<br />
Teske, P., Hamilton, H., Matthee, C. & Barker, N. (2007)<br />
Signatures of seaway closures <strong>and</strong> founder dispersal in the<br />
phylogeny of a circumglobally distributed seahorse lineage.<br />
BMC Evolutionary Biology, 7, 138.<br />
Verbruggen, H. (2005) Resegmenting Halimeda. Molecular <strong>and</strong><br />
morphometric studies of species boundaries within a green algal<br />
genus. Ph.D. Thesis, Biology Department, Ghent University,<br />
Ghent.<br />
Verbruggen, H. (2008) TreeGradients. Available at: http://<br />
www.phycoweb.net/.<br />
Verbruggen, H., De Clerck, O., Kooistra, W. & Coppejans, E.<br />
(2005a) Molecular <strong>and</strong> morphometric data pinpoint species<br />
boundaries in Halimeda section Rhipsalis (Bryopsidales,<br />
Chlorophyta). Journal of <strong>Phycology</strong>, 41, 606–621.<br />
Verbruggen, H., De Clerck, O., Schils, T., Kooistra, W. &<br />
Coppejans, E. (2005b) Evolution <strong>and</strong> phylogeography of<br />
Halimeda section Halimeda (Bryopsidales, Chlorophyta).<br />
Molecular Phylogenetics <strong>and</strong> Evolution, 37, 789–803.<br />
Verbruggen, H., Ashworth, M., LoDuca, S.T., Vlaeminck, C.,<br />
Cocquyt, E., Sauvage, T., Zechman, F.W., Littler, D.S., Littler,<br />
M.M., Leliaert, F. & De Clerck, O. (2009) A multi-locus timecalibrated<br />
phylogeny of the siphonous green algae. Molecular<br />
Phylogenetics <strong>and</strong> Evolution, 50, 642–653.<br />
Wiens, J.J. & Graham, C.H. (2005) Niche conservatism: integrating<br />
evolution, ecology, <strong>and</strong> conservation biology. Annual Review<br />
of <strong>Ecology</strong>, Evolution, <strong>and</strong> Systematics, 36, 519–539.<br />
Wiens, J.J., Parra-Olea, G., Garcia-Paris, M. & Wake, D.B. (2007)<br />
Phylogenetic history underlies elevational biodiversity<br />
patterns in tropical salam<strong>and</strong>ers. Proceedings of the Royal Society<br />
B: Biological Sciences, 274, 919–928.<br />
Wysor, B. (2004) An annotated list of marine Chlorophyta from<br />
the Pacific Coast of the Republic of Panama with a comparison<br />
to Caribbean Panama species. Nova Hedwigia, 78, 209–241.<br />
Yesson, C. & Culham, A. (2006) Phyloclimatic modeling: combining<br />
phylogenetics <strong>and</strong> bioclimatic modeling. Systematic<br />
Biology, 55, 785–802.<br />
Zachos, J., Pagani, M., Sloan, L., Thomas, E. & Billups, K. (2001)<br />
Trends, rhythms, <strong>and</strong> aberrations in global climate 65 Ma to<br />
present. Science, 292, 686–693.<br />
SUPPORTING INFORMATION<br />
Additional Supporting Information may be found in the online<br />
version of this article:<br />
Figure S1 Model output for Halimeda species.<br />
Please note: Wiley-Blackwell is not responsible for the content<br />
or functionality of any supporting materials supplied by the<br />
authors. Any queries (other than missing material) should be<br />
directed to the corresponding author for the article.<br />
BIOSKETCH<br />
The <strong>Phycology</strong> <strong>Research</strong> <strong>Group</strong> at Ghent University<br />
(Belgium) has a broad interest in seaweed evolution.<br />
<strong>Research</strong> focuses on the exploration of patterns of algal<br />
diversification <strong>and</strong> answering specific questions about<br />
seaweed evolution through integrative research.<br />
Our research focus includes molecular phylogenetics,<br />
reproductive biology, bacterial–algal interactions, remote<br />
sensing, biogeographical inquiry <strong>and</strong> genomics. Through<br />
the integration of phylogenetic techniques <strong>and</strong> niche<br />
modelling in a GIS framework, the research group aims to<br />
study evolutionary dynamics of the macroecological niche<br />
of seaweeds. URL: http://www.phycology.ugent.be/.<br />
Editor: Brad Murray<br />
<strong>Global</strong> <strong>Ecology</strong> <strong>and</strong> <strong>Biogeography</strong>, 18, 393–405, © 2009 Blackwell Publishing Ltd 405