SAM PuttLab - Reports Manual - Science & Motion Golf
SAM PuttLab - Reports Manual - Science & Motion Golf
SAM PuttLab - Reports Manual - Science & Motion Golf

Create successful ePaper yourself
Turn your PDF publications into a flip-book with our unique Google optimized e-Paper software.
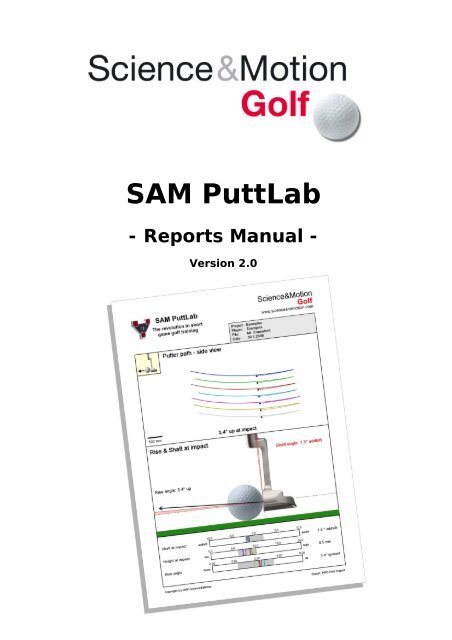
<strong>SAM</strong> <strong>PuttLab</strong><br />
- <strong>Reports</strong> <strong>Manual</strong> -<br />
Version 2.0
<strong>SAM</strong> <strong>PuttLab</strong> - <strong>Reports</strong> <strong>Manual</strong><br />
Reference<br />
The information contained in this document is subject to change without<br />
notice. The software described in this document is furnished under a license<br />
agreement. The software may be used or copied only in accordance with the<br />
terms of the agreement. It is against the law to copy the software on any<br />
medium except as specially allowed in the license. No part of this document<br />
may be reproduced or transmitted in any form or by any means,<br />
electronically or mechanical, for any purpose, without the express written<br />
permission of the authors.<br />
<strong>SAM</strong> <strong>PuttLab</strong> <strong>Reports</strong> <strong>Manual</strong>, Version 2.0 [04/2006]<br />
Web:<br />
Email:<br />
www.scienceandmotion.com<br />
info@scienceandmotion.com<br />
Copyright © 2006 <strong>Science</strong>&<strong>Motion</strong> GmbH<br />
All rights reserved<br />
Trademark Notices<br />
• All trademarks and registered trademarks appearing in this document<br />
are the property of their respective owners.<br />
Page 2
<strong>SAM</strong> <strong>PuttLab</strong> - <strong>Reports</strong> <strong>Manual</strong><br />
Table of Contents<br />
1 <strong>SAM</strong> PUTTLAB REPORTS OVERVIEW .....................................................................4<br />
1.1 What is a "Report"................................................................................................................ 4<br />
1.2 Print Report Screen.............................................................................................................. 5<br />
2 REPORT VIEW DESCRIPTION ...................................................................................6<br />
2.1 General .................................................................................................................................. 6<br />
2.2 Face at address .................................................................................................................... 9<br />
2.3 Face at impact .................................................................................................................... 10<br />
2.4 Alignment bar charts ......................................................................................................... 11<br />
2.5 Putter Path – Top View ...................................................................................................... 12<br />
2.6 Impact Spot......................................................................................................................... 13<br />
2.7 Top view bar charts............................................................................................................ 14<br />
2.8 Putter Path - Side View ...................................................................................................... 15<br />
2.9 Shaft angle at impact ......................................................................................................... 16<br />
2.10 Side View bar charts ........................................................................................................ 17<br />
2.11 Putter head rotation ......................................................................................................... 18<br />
2.12 Rotation Graphs ............................................................................................................... 20<br />
2.13 Rotation bar charts .......................................................................................................... 21<br />
2.14 Movement dynamics ........................................................................................................ 22<br />
2.15 Rhythm and Timing.......................................................................................................... 24<br />
2.16 Dynamic bar charts .......................................................................................................... 25<br />
2.17 Face On Path .................................................................................................................... 26<br />
Page 3
<strong>SAM</strong> <strong>PuttLab</strong> - <strong>Reports</strong> <strong>Manual</strong><br />
1 <strong>SAM</strong> <strong>PuttLab</strong> <strong>Reports</strong> overview<br />
1.1 What is a "Report"<br />
<strong>Reports</strong> consist of an arrangement of different views in which the results are<br />
presented in easy to read graphics. There are different types of <strong>Reports</strong><br />
available in <strong>SAM</strong> PuttWare:<br />
"Screen" reports are optimized for being displayed on your computer<br />
display.<br />
"Print" reports are optimized for being printed out and can be exported as a<br />
PDF file (multi page document) or as image files in jpg format.<br />
"Profile" are competence profiles, which also allow to directly compare<br />
different measurements, i.e. yourself to other players (PGA Pros) or different<br />
putters.<br />
You can also create a report by selecting a specific measurement via the<br />
"Data Selection" dialog bar in the main screen of the <strong>SAM</strong> PuttWare software<br />
and then choose a report from the "main menu" or the toolbar.<br />
After you selected a report and clicked the "OK" button, the report opens.<br />
Page 4
<strong>SAM</strong> <strong>PuttLab</strong> - <strong>Reports</strong> <strong>Manual</strong><br />
1.2 Print Report Screen<br />
Print Report Screen<br />
In the Print Report screen the results for the currently selected<br />
measurement will be displayed in a multi page document. You can scroll up<br />
and down via the cursor keys or use the scrollbar at the right side of the<br />
screen to examine different views of your stroke. With the page up / page<br />
down keys you can browse through the pages.<br />
All other possible functions like printing, zooming, etc. can be executed via<br />
the toolbar buttons and are described in the following section:<br />
Print the report<br />
Show a print preview<br />
Open an additional report – The actual report can be directly<br />
compared with another report. Simply select the other report and it<br />
will be also displayed in the same screen. By holding the [CTRL]-key<br />
you can scroll in both reports at the same time using the cursor keys.<br />
Save a report as PDF-file<br />
Zoom-in, Zoom-out<br />
Close all open reports<br />
Different zoom modes – full page, full side<br />
width, 33%, 50% and 100% of the report<br />
Page 5
<strong>SAM</strong> <strong>PuttLab</strong> - <strong>Reports</strong> <strong>Manual</strong><br />
2 Report view description<br />
2.1 General<br />
A Report consists of different views that present the <strong>SAM</strong> <strong>PuttLab</strong> result<br />
data. The reports use a combination of three main result display categories:<br />
See the following example Report:<br />
1. Graphical<br />
display of the<br />
results for the<br />
current parameter<br />
2. Detailed output of<br />
numerical result<br />
values in data<br />
graphs with a<br />
benchmark range<br />
3. Score and<br />
consistency rating<br />
for the current<br />
parameter<br />
Page 6
<strong>SAM</strong> <strong>PuttLab</strong> - <strong>Reports</strong> <strong>Manual</strong><br />
1. Graphical display of the results for the current parameter<br />
In this section of the Report view you will see graphical display of the<br />
results. This can be an image with additional results displayed (e.g. Impact<br />
Spot) or data curves (e.g. Putter Path). If results for multiple putts are<br />
displayed you will see them in different colors. The color for a single putt will<br />
be the same for all views in this report. This allows comparing of different<br />
parameters for the same putt.<br />
Some graphics only show an average value of multiple putts (Alignment,<br />
Rotation). In this case the consistency value is very important because it<br />
shows the variability in your putting. Good performance in the currently<br />
shown parameter is indicated by high ratings in Score and Consistency.<br />
2. Detailed output of numerical result values in data graphs with a<br />
benchmark range<br />
The bar charts provide detailed information on each single putt. The<br />
numbers on top of the bars correspond to the data scale. The colored<br />
vertical stripes within the bars represent the different putts. The grey areas<br />
indicate the optimum data ranges as derived from the PGA Tour data<br />
sample.<br />
The number printed on the right side of the graph represents the average<br />
value for this parameter, but the single lines show the value of each stroke.<br />
So you can inspect in detail both the average performance and the<br />
variability of your putts. The average is the basis of calculating the<br />
corresponding Score rating.<br />
The spread of the single data values indicates the distribution for the single<br />
putts. The distribution of the data is the basis of calculating the<br />
corresponding Consistency rating. For high consistency of movement<br />
execution the stripes should be grouped very close together.<br />
The grey area inside of the bar graphs represents the benchmark range and<br />
represents about 68% of the Tour players performance. For a topperformance<br />
your stroke results should be inside of this range. The<br />
benchmark range data has been collected over the last three years from<br />
over 100 European PGA Tour Players and shows their average performance<br />
and variability.<br />
Page 7
<strong>SAM</strong> <strong>PuttLab</strong> - <strong>Reports</strong> <strong>Manual</strong><br />
3. Score and consistency rating<br />
The Score rating shows the deviation from the optimum data value on a<br />
uniform scale. The raw data value is compared with a tour data sample and<br />
then the score rating is calculated. This allows to directly compare the<br />
performance in all parameters directly with each other. A Score of 100 %<br />
means that the performance is optimal. A Score rating of 75 % means that<br />
the performance is as good as for about 32% of the tour players<br />
performance. The bars are green for ratings above 75%, yellow between 50<br />
and 75%, and are red for ratings below 50%.<br />
The Consistency rating shows the distribution of the data values of the<br />
single putts on a uniform scale. The raw data values are compared with the<br />
distribution of the tour data sample and then the consistency rating is<br />
calculated. This allows to directly compare the consistencies in all<br />
parameters directly with each other. A Consistency rating of 75 % means<br />
that the performance is as good as for about 50% of the tour players<br />
consistency.<br />
The rating and consistency bars have 3 ranges indicated by different colors:<br />
a) Green: 75% to 100%<br />
This indicates a very good performance inside the Tour Pros<br />
benchmark range. High consistency shows that you execute the<br />
movement all the time the same and that your technique is well<br />
established.<br />
b) Yellow: 50% to 75%<br />
This indicates a performance slightly below the Tour Pros benchmark<br />
range, which is still good performance for an amateur player.<br />
c) Red: 0% to 50%<br />
This indicates a performance below the Tour Pros benchmark range.<br />
Low Score ratings indicate that your technique reflected by this<br />
parameter is very much different from a Tour player’s technique. Low<br />
Consistency ratings indicate that this aspect of your putting stroke is<br />
different all the time. High consistency shows the skill level and is the<br />
most important factor for skilled players.<br />
The following pages will describe the Report views for all parameters in<br />
detail.<br />
Not all of the result categories are used in every Report view. In the<br />
Training mode there will be no Consistency rating, because only one<br />
stroke will be displayed at a time.<br />
Page 8
<strong>SAM</strong> <strong>PuttLab</strong> - <strong>Reports</strong> <strong>Manual</strong><br />
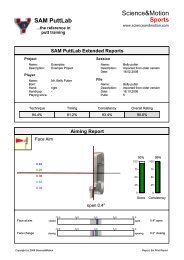
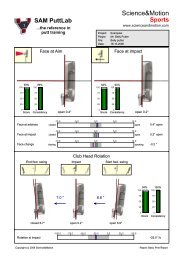
2.2 Face at address<br />
The first graph shows the alignment of the putter face at address. The<br />
dotted line exactly represents the calibrated target direction. A putter face<br />
100% square to the target exactly results in 0 degrees. The average<br />
direction of the putter face alignment is represented by the thick red line.<br />
The area between the average alignment and the optimum target direction<br />
is filled in red color to indicate the amount of deviation.<br />
The average numerical value for the putter face angle at address is shown at<br />
the left side of the putter head in degrees. In this example, the putter head<br />
is 0.4 degrees open at address which means the face is slightly pointing to<br />
the right.<br />
The two bars on the right side of the graph show the Score rating for<br />
average alignment as well as the Consistency over the different putts. The<br />
bars are green for ratings above 75%, yellow for ratings between 50% and<br />
75% and red for ratings below 50%. In this case the Score for 0.4 degrees<br />
open results in 93% performance. The Consistency rating is 99 percent<br />
which is absolutely reference performance (see also chapter 2.4). This<br />
means the putter is exactly aimed the same for the different putts.<br />
Page 9
<strong>SAM</strong> <strong>PuttLab</strong> - <strong>Reports</strong> <strong>Manual</strong><br />
2.3 Face at impact<br />
This graph shows the alignment of the putter face at impact. The structure<br />
of the graph is similar to the "face at address" graph as described in chapter<br />
2.2.<br />
The average numerical value for the putter face angle at address is shown at<br />
the left side of the putter head in degrees. In this example, the putter head<br />
is almost square at impact with only 0.2 degrees open which means the face<br />
is slightly pointing to the right.<br />
This is excellent performance, please note that a putter face which is more<br />
open / closed than 1 degree at impact results in missing a 4 meters putt to<br />
the right / left.<br />
The two bars on the right side of the graph show the Score rating for<br />
average alignment as well as the Consistency over the different putts. In this<br />
case the Score for 0.2 degrees open results in 93% performance. The<br />
Consistency rating is 93 percent which is also a very high performance (see<br />
also chapter 2.4). This means the putter face at impact is very much the<br />
same for the different putts.<br />
Page 10
<strong>SAM</strong> <strong>PuttLab</strong> - <strong>Reports</strong> <strong>Manual</strong><br />
2.4 Alignment bar charts<br />
The bar charts below the graphs provide information on each single putt.<br />
The colored stripes within the bars represent the different putts. These<br />
graphs do not only show the average performance but also the distribution<br />
of the single data values. For high consistency of movement execution the<br />
stripes should be grouped very closely together or should even overlap.<br />
The numbers above the bars correspond to the data scale. In this case the<br />
numbers represent degrees for the alignment. At the left side of the bar the<br />
name of the displayed parameter is shown. The number on the right side of<br />
the bar represents the average data value for this parameter.<br />
The upper two bars show the data for face at address and face at impact.<br />
For this player the data are grouped very closely together which indicates<br />
high consistency of movement execution (see also chapters 2.2 and 0).<br />
The parameter "Face change" shows the change of putter face angle<br />
between address position and impact. For this player the face is closed from<br />
address to impact -0.2 degrees in average which is only a very small<br />
compensation. Even more important, the face change from address to<br />
impact is also very consistent.<br />
This parameter provides additional information on putter face action inside<br />
of the backswing and on sources of inconsistencies at impact. If the face at<br />
impact is inconsistent and face change is inconsistent you should work on a<br />
more smooth and regular putter face during the backswing. On the other<br />
hand, if face at impact is inconsistent but face change is consistent, then the<br />
inconsistencies do more result from inconsistent addressing. Consequently,<br />
you should then work on a more consistent addressing.<br />
Page 11
<strong>SAM</strong> <strong>PuttLab</strong> - <strong>Reports</strong> <strong>Manual</strong><br />
2.5 Putter Path – Top View<br />
This graph displays the path of the putter viewed from above during back<br />
swing (dotted lines) and forward swing (solid lines). The different putts are<br />
indicated by different colors, with the first putt at the top.<br />
The graph shows the bird's-eye view. The small black spot represents the<br />
starting point of the movement. The backswing is going to the right. The<br />
forward swing starts at the end of the backswing, runs through the ball and<br />
then ends up at the left side where the putter stops moving.<br />
For this player you find a little loop in the back swing going outside in the<br />
backswing. The consistency of the length of the backswing is high, this<br />
guarantees consistent speed control. The consistency of the forward swing is<br />
also very high. The putter path is very straight, and putter path direction at<br />
impact points 0.6 degrees to the right of the target line. Deviations in putter<br />
path very often correlate to a misaimed body line.<br />
The most common compensation found in PGA Tour players is a putter path<br />
pointing to the left and a putter face slightly open at impact. Many Tour<br />
players tend to aim the face to the right edge of the hole because they know<br />
that they tend to pull the putt under pressure. In addition to pulling many<br />
players also manipulate the putter face through impact under pressure.<br />
Consequently the players are more concerned about a closed putter face at<br />
impact with a putter path pointing to the right.<br />
Please note that the effect of errors in putter path direction on ball direction is<br />
about 4 times less than errors in putter face alignment at impact. This<br />
means that a 1 degree open putter face at impact has the same effect on<br />
ball direction as a putter path pointing 4 degrees to the right.<br />
Page 12
<strong>SAM</strong> <strong>PuttLab</strong> - <strong>Reports</strong> <strong>Manual</strong><br />
2.6 Impact Spot<br />
This graph exactly shows where you hit the balls on your putter face. The<br />
different impact spots are indicated by crosses in different colors. The<br />
horizontal and vertical lines in the middle of the putter face represent the<br />
geometrical centre of the putter which normally represents the sweet spot.<br />
The two bars on the right side of the graph show the Score rating for the<br />
horizontal impact spot as well as Consistency over the different putts. This<br />
player shows an extremely consistent impact spot slightly left on the putter<br />
face with 0.8 mm at the toe. The corresponding score is 95% of the<br />
optimum. Consistency level is very high with 98%<br />
Please note that the horizontal hit distance as measured on the putter face<br />
directly refers to the calibration. In this case the horizontal distance of about<br />
0.8 mm indicates that the ball is hit in average 0.8 mm to the toe as<br />
compared with the calibration position (which should be exactly at the centre<br />
of the putter).<br />
PLEASE NOTE:<br />
• It is assumed that the ball lies exactly on the same spot for all putts<br />
(i.e. by using a spot or a small ring). If you use different spots while<br />
putting you will get results for hit spot which will deviate from the true<br />
hit spots.<br />
Page 13
<strong>SAM</strong> <strong>PuttLab</strong> - <strong>Reports</strong> <strong>Manual</strong><br />
2.7 Top view bar charts<br />
The top view bar charts provide information on each single putt. The colored<br />
stripes within the bars represent the different putts. For high consistency of<br />
movement execution the stripes should be grouped closely together. The<br />
structure of the graph is identical to the "Alignment bar chart" in chapter<br />
2.4.<br />
The "Putter path direction" parameter examines the direction of the putter<br />
path exactly at the point of hitting the ball. The putter direction at impact<br />
path is almost perfectly straight pointing only 0.6 degrees to the right.<br />
The "Face at putter path" parameter shows the face angle at impact in<br />
relation to the putter path direction at impact. The average value of 0.4<br />
degrees closed corresponds to the face angle at impact (in this case 0.2<br />
degrees open) added to the putter path direction of 0.6 degrees to the right.<br />
The distribution of the “Face at putter path” direction values provides<br />
separate information on the source of inconsistencies in the strokes. In this<br />
case also face on putter path is very consistent.<br />
The "Impact spot" parameter shows the horizontal hit distance on the putter<br />
face relative to the centre of the putter. Especially on heel mounted putters<br />
off-centre hits at the toe are more vulnerable to a loss of energy which is<br />
transferred to the ball.<br />
Page 14
<strong>SAM</strong> <strong>PuttLab</strong> - <strong>Reports</strong> <strong>Manual</strong><br />
2.8 Putter Path - Side View<br />
This graph shows a horizontal side view of the putter path during back<br />
swing (dotted lines) and forward swing (solid lines). The different putts are<br />
indicated by different colors, with the first putt at the top.<br />
The small black point/ball represents the starting point of the movement.<br />
The putter is slightly lifted at the beginning of the backswing and is then<br />
moving to the right. Backswing in Tour players is generally flat which allows<br />
the forward swing to come up through impact.<br />
For this player the forward swing path is leading 2.2 degrees upwards<br />
through the ball. The putter path curves run very parallel. The third putt is a<br />
little bit pulled up at end of forward swing. Again a shorter backswing and a<br />
longer follow through can be seen. More explanations on consistency of the<br />
putter path length are found in chapter 2.5.<br />
Page 15
<strong>SAM</strong> <strong>PuttLab</strong> - <strong>Reports</strong> <strong>Manual</strong><br />
2.9 Shaft angle at impact<br />
This graph shows the putter face at impact in a side view.<br />
First, the graph provides information on the shaft angle at impact. The<br />
average shaft angle is represented by a thick red line. The space between<br />
the average shaft angle and the vertical is also filled in red to indicate the<br />
degree of deviation.<br />
When the shaft is pushed forward or leaning back, the loft of the putter face<br />
is changed accordingly. In this case the hands slightly behind of the ball and<br />
as consequence the net loft applied to the ball is the static loft (normally 3-4<br />
degrees) and added loft of 0.1 degrees.<br />
Second, the "Rise angle" shows the angle of attack of the putter path at<br />
impact to the ball in relation to the ground. For this player the rise angle is<br />
2.2 degrees upward, which is little less then the perfect range of 3 to 4<br />
degrees. A positive rise angle will give the ball some forward spin and a<br />
better roll. The skidding phase will also be reduced.<br />
The graph also shows the average putter height at impact above ground.<br />
The height above ground directly corresponds to the vertical hit distance on<br />
the putter face (see chapter 2.6).<br />
ATTENTION: The loft and rise measurement is very much depending on<br />
exact horizontal alignment of the measurement unit. For this purpose a<br />
spirit-level is attached to the backside of the unit. If the putting green has a<br />
slope then the measurement unit should be placed parallel to the surface.<br />
TIP: The slope can be measured by placing the suitcase on the ground and<br />
then positioning the measurement unit upside down on the suitcase and<br />
remember the spirit-level. After installing the unit adjust the spirit level to<br />
the same position.<br />
Page 16
<strong>SAM</strong> <strong>PuttLab</strong> - <strong>Reports</strong> <strong>Manual</strong><br />
2.10 Side View bar charts<br />
The side view bar charts provide information on each single putt. The<br />
colored stripes within the bars represent the different putts. The more<br />
closely grouped the stripes are, the more consistent the performance is. The<br />
structure of the graph is identical to the "Alignment bar chart" in chapter<br />
2.4.<br />
The parameter "Shaft at impact" provides information on the shaft angle at<br />
impact. This parameter directly corresponds to adding loft or delofting the<br />
putter face at impact. For this player the shaft is almost neutral at impact.<br />
As consequence the net loft if the putter to the ball is the static loft plus 0.1<br />
degrees. If the putter has about 3 degrees loft on the face, then the<br />
resulting net loft at impact will be 3.1 degrees.<br />
The "Height at impact" parameter indicates the height of the putter above<br />
ground while hitting the ball. This player hits the ball with a height of 8.1<br />
mm above the ground. For hitting the ball in the vertical sweet spot a height<br />
of about 8-10 mm is perfect. The hit distance on the putter face is shown in<br />
the Impact spot graph in chapter 2.6.<br />
The "Rise angle" parameter shows the angle of the putter path against the<br />
horizontal ground at impact. For this player the rise angle is 2.2 degrees<br />
upwards, which is little less than the perfect range of 3 to 4 degrees. A<br />
positive rise angle will give the ball some forward spin and a better roll. The<br />
skidding phase will also be reduced.<br />
There is an inter-dependence between rise angle and loft at impact. The<br />
more rise angle at impact is found the less loft at impact is needed to<br />
properly lift the ball from the ground. High speed video suggests that you<br />
should avoid backspin and skidding of the ball for proper roll. On a stimp 9-<br />
10 we recommend only 1 degree net loft but a rise angle of 3-4 degrees<br />
upwards, which will properly launch the ball and will impart immediate<br />
topspin to the ball.<br />
Page 17
<strong>SAM</strong> <strong>PuttLab</strong> - <strong>Reports</strong> <strong>Manual</strong><br />
2.11 Putter head rotation<br />
This graph shows the putter face angle at different positions in the forward<br />
swing: At the start of the forward swing (right), at impact (middle) and at<br />
the end (left) of forward swing. The red lines indicate the deviation of the<br />
putter angles from the square alignment.<br />
Under the putter face pictures the corresponding angles are shown. In this<br />
case the putter face is open 6.8 degrees at start of forward swing. (Because<br />
the putter face was open 0.6 degrees at address, it was opened 6.2 degrees<br />
during the back swing.)<br />
At impact the putter face is still slightly open 0.2 degrees. The value above<br />
the blue arrow shows the corresponding closing of the putter face to impact<br />
of 6.6 degrees. From impact to end the club face is closed another 7.0<br />
degrees and is then 6.7 degrees closed at the end of forward swing.<br />
In the middle of the graph the face rotation for a fixed area of +/- 10 cm<br />
before and after impact is shown. The rotation inside of this fixed area is<br />
independent of the length of the putter path and allows to directly compare<br />
the rotation of putts with different path lengths. In this case the rotation<br />
inside of 10 cm before impact amounts to 1.6 degrees and the rotation<br />
inside of 10 cm after impact amounts to 1.2 degrees.<br />
Page 18
<strong>SAM</strong> <strong>PuttLab</strong> - <strong>Reports</strong> <strong>Manual</strong><br />
The two bars on the right side of the graph show the Score rating for the<br />
rotation at impact as well as the Consistency over the different putts. This<br />
player shows a rotation of 2.8 degrees inside of an area of +/- 10 cm around<br />
impact. The preferred amount of rotation as measured on the Tour inside of<br />
this range is about 1 to 3 degrees. The score level of 84% is very high and<br />
corresponds to a rate of rotation at impact of 26.0 °/s (see 2.13). The<br />
consistency of rotation around impact is extremely high with 99% rating<br />
(see also next paragraph).<br />
Page 19
<strong>SAM</strong> <strong>PuttLab</strong> - <strong>Reports</strong> <strong>Manual</strong><br />
2.12 Rotation Graphs<br />
Rotation graph: The graph on the left shows the rotation over time for<br />
each forward swing. The rotation graph also corresponds to the putter face<br />
angles as shown in 2.11.<br />
• At the beginning of the forward swing (beginning of the curve at the left<br />
side) the putter face is about 6.8 degrees open.<br />
• The impact is indicated by the small vertical stripes. The horizontal axis<br />
corresponds exactly to the putting line. The graph shows that the ball is<br />
hit with a slightly open putter face.<br />
• At the end of the forward swing the putter face is about 6.7 degrees<br />
closed (right end of graphs).<br />
For this player the course of rotation is smoothly running from open face at<br />
impact to a closed face at end of forward swing. For natural and smooth<br />
rotation the rotation will always be symmetric to impact (stripes).<br />
Rate of rotation graph: On the right side the corresponding rate of<br />
rotation change (velocity of rotation) over time is displayed. The rate of<br />
rotation graph displays the change of putter face angle over time.<br />
Irregularities in putter face change are magnified in the velocity data and<br />
correspond to peaks in the putter face velocity curve. For this player you can<br />
identify a minimum re-opening of the face directly after impact through a<br />
positive peak in the velocity curve. This "re-opening" can either be a<br />
consequence of hitting the ball off-center at the toe (see 2.6) or can show<br />
the tendency of the player to interrupt the natural rotation of the face and to<br />
keep the face more square through impact.<br />
A natural and continuous putter face rotation always shows a smooth and<br />
flat rate of rotation curve and corresponds to high consistency ratings.<br />
Inconsistencies of the putter face around impact correspond to the lower<br />
consistency ratings in 2.11.<br />
Page 20
<strong>SAM</strong> <strong>PuttLab</strong> - <strong>Reports</strong> <strong>Manual</strong><br />
2.13 Rotation bar charts<br />
The rotation bar charts provide information on each single putt. The colored<br />
stripes within the bars represent the different putts. The more closely<br />
grouped the stripes are, the more consistent the performance is. The<br />
structure of the graph is identical to the "Alignment bar chart" in 2.4.<br />
The "Before impact" bar shows the change of the putter face angle from 10<br />
cm before impact until impact. 1.6 degrees rotation before impact are<br />
slightly more than the average of the European PGA Tour players sample.<br />
The consistency of rotation is high.<br />
The "After impact" bar shows the change of putter face angle from impact<br />
to 10 cm after impact. 1.2 degrees after impact match to the average value<br />
European PGA Tour players. The consistency of rotation after impact is high.<br />
If rotation before impact and after impact are in the same range then<br />
rotation is changing smoothly through impact. If rotation after impact id<br />
considerably less then rotation before then the rotation through impact is<br />
interrupted to keep the face square through impact.<br />
The "Rate of rotation" bar shows the putter face change at impact. 26.0<br />
degrees per second is in the normal range of European PGA Tour players. If<br />
the rate of rotation at impact is high then the timing of the putting stroke<br />
becomes more important. If 50 degrees face change per second are<br />
assumed, then a timing error of 20 ms late would close the putter face 1<br />
degree (20 x 50 / 1000). This would mean you would miss a 4-meter putt<br />
to the left. As mentioned above, the consistency of rate of rotation is<br />
extremely high for this payer which means reference performance.<br />
Page 21
<strong>SAM</strong> <strong>PuttLab</strong> - <strong>Reports</strong> <strong>Manual</strong><br />
2.14 Movement dynamics<br />
The description of movement dynamics includes speed (velocity) and<br />
acceleration within backswing and forward swing. Movement dynamics are<br />
not directly related to putting technique. Movement dynamics rather show<br />
the motor skill level and the movement strategies underlying movement<br />
planning and execution. Backswing and forward swing curves are separated<br />
and displayed in two graphs only for educational purposes.<br />
Speed<br />
Movement speed is always zero at the beginning and the end of a swing. The<br />
maximum speed lies approximately in the middle of the movement (bell<br />
shaped profile). The speed curves should be smooth and regular for<br />
automated movement execution.<br />
Acceleration<br />
The acceleration signal directly corresponds to the speed signal: Acceleration<br />
is change of speed over time. High acceleration means fast increase of<br />
speed. Zero acceleration means constant speed. Negative acceleration<br />
means decreasing speed.<br />
Impact<br />
The moment of impact is indicated with a vertical stripe in the speed data.<br />
In the acceleration curve the impact with the ball can be identified by a<br />
steep cusp because the impact decelerates the putter face for a short<br />
moment.<br />
Page 22
<strong>SAM</strong> <strong>PuttLab</strong> - <strong>Reports</strong> <strong>Manual</strong><br />
The characteristic of speed and acceleration signals provide important<br />
information on the movement strategy of the player.<br />
Backswing<br />
Backswing duration is generally shorter than forward swing duration. The<br />
backswing starts smoothly. At the end of the backswing there is a sharp<br />
change from back to forward swing in the acceleration signal. Backswing and<br />
forward swing should not be two separate movements. These are the typical<br />
characteristics of a committed putting technique. Backswing duration of 600-<br />
700 ms is in the optimal range.<br />
Transition<br />
The transition from backswing to forward swing is done with out a<br />
movement pause. This means that there is a steep change from backswing<br />
to forward swing with a little release of the putter at the top of the<br />
backswing. Hands are a little in front of the putter head at this point. Hands<br />
and arms should be stable and firm but not stiff. Stiff limbs do not provide<br />
proper feedback from the movement.<br />
Forward swing<br />
Forward swing starts approximately at the level where backswing ended. So<br />
a committed begin of forward swing already starts with a committed end of<br />
backswing and a steep transition.<br />
The acceleration profile allows to identify the putting technique of the player.<br />
For a swing putting technique acceleration starts at a high level and is then<br />
constant until impact. For a hit putting technique acceleration increases<br />
steeply just before impact (to more than double), and after impact<br />
acceleration decreases steeply. For this player shown in the graph,<br />
acceleration increases slightly, but it is still a swing type stroke. Forward<br />
swing duration of 800-900 ms is in the optimal range.<br />
Consistency<br />
Automated movements should be executed each time in exactly the same<br />
way. The acceleration signal in particular is extremely sensitive and shows<br />
all details of movement execution. This refers to the form of the signals, to<br />
height and position of the peaks, and to duration of the movements. For this<br />
player the accuracy of the movement repetitions is very high, which<br />
indicates a high degree of automation.<br />
Page 23
<strong>SAM</strong> <strong>PuttLab</strong> - <strong>Reports</strong> <strong>Manual</strong><br />
2.15 Rhythm and Timing<br />
Rhythm and timing are generally guiding human movements. Consistent<br />
rhythm and timing are crucial for high consistency of the complete stroke.<br />
Proper rhythm and timing are the basic principles in skilled movement<br />
performance.<br />
The graph shows the time of backswing, the time from beginning of forward<br />
swing to impact, and the time of the complete forward swing in bar charts.<br />
Time to impact is also marked with a horizontal line inside of the forward<br />
swing bar. The grey areas indicate the preferred range of the timings of the<br />
PGA Tour sample. The average time values are shown below the bars.<br />
Backswing time<br />
Backswing duration is short. Backswing time should be generally about 100-<br />
200 ms shorter than forward swing time. Backswing duration of 600-700 ms<br />
is in the preferred range of PGA Tour Pros.<br />
Time to impact<br />
Time from beginning of forward swing to impact is approximately half time<br />
of backswing time (see 2.16) which would mean 300-350 ms. If you would<br />
count then backswing would be “1”,”2” and time to impact “3”.<br />
Forward swing time<br />
Forward swing time should be generally about 100-200 ms longer than<br />
backswing time. The putter swinging on its own would have a swing time of<br />
about 950 ms. Forward swing time is approximately in this range. Forward<br />
swing duration of 800-900 ms is in the preferred range of PGA Tour Pros.<br />
The absolute times can differ between different stroke types, more<br />
aggressive (committed) players show smaller times in all sections and more<br />
cautious (anxious) players show higher times. However, rhythm and timing<br />
(the relation of the components) should then still be in a preferred range<br />
(see 2.16). This means, rhythm and timing are always the same but the<br />
complete stroke can be somewhat slower or faster.<br />
Page 24
<strong>SAM</strong> <strong>PuttLab</strong> - <strong>Reports</strong> <strong>Manual</strong><br />
2.16 Dynamic bar charts<br />
The dynamics bar charts provide information on each single putt. The<br />
colored stripes within the bars represent the different putts. The more<br />
closely grouped the stripes are, the more consistent the performance is. The<br />
structure of the graph is identical to the "Alignment bar chart" in 4.5.<br />
Backswing Rhythm<br />
Backswing rhythm describes the ratio of backswing time to impact time.<br />
Backswing time should be approximately double as compared with impact<br />
time (Tour average 2.1).<br />
• Fast Rhythm: For this player the Rhythm is slightly smaller which means<br />
that he is more aggressive in the backswing. Generally players with a<br />
faster Rhythm tend to less monitor details of their putting stroke.<br />
• Slow Rhythm: High numbers for backswing rhythm identify players with a<br />
cautious backswing who tend to more control the technique during the<br />
stroke.<br />
Impact timing<br />
The "Impact timing" parameter indicates at which point during the entire<br />
forward swing you hit the ball. Impact timing describes the ratio of impact<br />
time to forward swing time. Hitting the ball early in the stroke ensures<br />
impact before maximum speed, and hitting before maximum speed per<br />
definition means accelerating through impact.<br />
For beginners impact timing is about 0.5 or even higher because the ball is<br />
in the center of their stroke. For professional players the timing comes down<br />
to about 0.35-0.4. This timing guarantees a positive acceleration through<br />
the ball because the maximum speed is reached after impact. Average<br />
impact timing of the Tour Pros is about 0.39 which means the hit the ball<br />
after 39% of forward swing time.<br />
Speed at impact<br />
The "Speed at impact" parameter shows the speed of the putter face exactly<br />
at impact. High consistency of impact speed is most important for distance<br />
control of the putt. Inconsistent impact speed can also be a consequence of<br />
poor timing. In addition, speed at impact very often correlates directly with<br />
the length of the backswing.<br />
Page 25
<strong>SAM</strong> <strong>PuttLab</strong> - <strong>Reports</strong> <strong>Manual</strong><br />
2.17 Face On Path<br />
Only available in Training and Screen <strong>Reports</strong><br />
This report exactly indicates how the putter face is aligned on the putter<br />
path around impact and shows the deviation from square alignment. For a<br />
natural stroke the path can be slightly arced, but the putter face will be<br />
always square on the path.<br />
The graph shows the putter path in top view in a range of 30 cm or 12<br />
inches around impact. The vertical lines represent the putter face angle<br />
along the path in the displayed area.<br />
The different colors of the lines show how the putter face is aligned relatively<br />
to the direction of the path (NOT TO THE TARGET!).<br />
• Red line: The Putter face is open more than 1 degree on the path<br />
• Blue line: The putter face is closed more than 1 degree on the path<br />
• Black line: The putter face is aligned in between +/- 1 degrees on the<br />
path (this means it is nearly perfectly square).<br />
The Score bar on the right side gives an overall rating of the Face on Path<br />
parameter. This will include also areas of the swing that are not visible in the<br />
path graphics.<br />
The FaceOnPath angle is measured against the path direction for every<br />
displayed line, NOT against the target alignment. If the face is square<br />
on path at impact, then the ball is going exactly into the direction<br />
where face and path are pointing to. If the putt still misses the target,<br />
then the complete body alignment is off.<br />
Page 26