Silica thin layer chromatographic separation of cetylpyridinium ...
Silica thin layer chromatographic separation of cetylpyridinium ...
Silica thin layer chromatographic separation of cetylpyridinium ...

You also want an ePaper? Increase the reach of your titles
YUMPU automatically turns print PDFs into web optimized ePapers that Google loves.
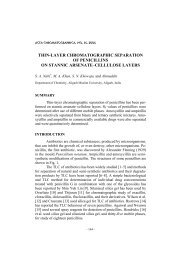
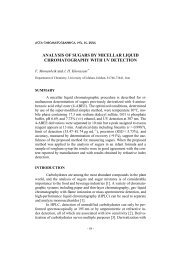
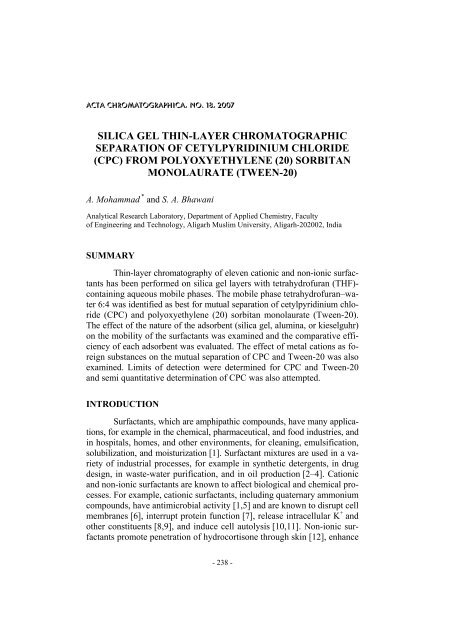
ACTA CHROMATOGRAPHICA, NO. 18, 2007<br />
SILICA GEL THIN-LAYER CHROMATOGRAPHIC<br />
SEPARATION OF CETYLPYRIDINIUM CHLORIDE<br />
(CPC) FROM POLYOXYETHYLENE (20) SORBITAN<br />
MONOLAURATE (TWEEN-20)<br />
A. Mohammad * and S. A. Bhawani<br />
Analytical Research Laboratory, Department <strong>of</strong> Applied Chemistry, Faculty<br />
<strong>of</strong> Engineering and Technology, Aligarh Muslim University, Aligarh-202002, India<br />
SUMMARY<br />
Thin-<strong>layer</strong> chromatography <strong>of</strong> eleven cationic and non-ionic surfactants<br />
has been performed on silica gel <strong>layer</strong>s with tetrahydr<strong>of</strong>uran (THF)-<br />
containing aqueous mobile phases. The mobile phase tetrahydr<strong>of</strong>uran–water<br />
6:4 was identified as best for mutual <strong>separation</strong> <strong>of</strong> <strong>cetylpyridinium</strong> chloride<br />
(CPC) and polyoxyethylene (20) sorbitan monolaurate (Tween-20).<br />
The effect <strong>of</strong> the nature <strong>of</strong> the adsorbent (silica gel, alumina, or kieselguhr)<br />
on the mobility <strong>of</strong> the surfactants was examined and the comparative efficiency<br />
<strong>of</strong> each adsorbent was evaluated. The effect <strong>of</strong> metal cations as foreign<br />
substances on the mutual <strong>separation</strong> <strong>of</strong> CPC and Tween-20 was also<br />
examined. Limits <strong>of</strong> detection were determined for CPC and Tween-20<br />
and semi quantitative determination <strong>of</strong> CPC was also attempted.<br />
INTRODUCTION<br />
Surfactants, which are amphipathic compounds, have many applications,<br />
for example in the chemical, pharmaceutical, and food industries, and<br />
in hospitals, homes, and other environments, for cleaning, emulsification,<br />
solubilization, and moisturization [1]. Surfactant mixtures are used in a variety<br />
<strong>of</strong> industrial processes, for example in synthetic detergents, in drug<br />
design, in waste-water purification, and in oil production [2–4]. Cationic<br />
and non-ionic surfactants are known to affect biological and chemical processes.<br />
For example, cationic surfactants, including quaternary ammonium<br />
compounds, have antimicrobial activity [1,5] and are known to disrupt cell<br />
membranes [6], interrupt protein function [7], release intracellular K + and<br />
other constituents [8,9], and induce cell autolysis [10,11]. Non-ionic surfactants<br />
promote penetration <strong>of</strong> hydrocortisone through skin [12], enhance<br />
- 238 -
the fluorescence <strong>of</strong> metal chelates [13], prevent adsorption <strong>of</strong> bacteria by<br />
hydrophobic surfaces [14,15], and interact with phospholipids [16]. The<br />
biological activity <strong>of</strong> non-ionic surfactants depends on the physicochemical<br />
character <strong>of</strong> the hydrophobic moiety and on the number <strong>of</strong> hydrophilic<br />
ethylene oxide groups [17,18].<br />
Numerous chemical and physicochemical methods have been developed<br />
for qualitative and quantitative analysis <strong>of</strong> surfactants; the most<br />
widespread are use <strong>of</strong> microbial sensors [19] and amperometric biosensors<br />
[20], ion-pair formation with in-situ flow-injection analysis using dynamic<br />
surface tension detection [21], use <strong>of</strong> ion-selective electrodes [22], ionpair<br />
chromatography with suppressed conductivity detection [23], spectrophotometry<br />
[24–31], capillary electrophoresis [32,33], solid-phase extraction<br />
with surface-assisted laser desorption/ionization spectrometry [34], electrospray<br />
ionization mass spectrometry with flow-injection analysis [35], liquid<br />
chromatography combined with atmospheric-pressure ionization mass spectrometry<br />
[36], and flow-injection analysis combined with atmosphericpressure<br />
ionization-mass spectrometry [37]. All these methods require use<br />
<strong>of</strong> sophisticated instruments and expertise, and development <strong>of</strong> simple, rapid,<br />
and selective methods for identification, <strong>separation</strong> and determination<br />
<strong>of</strong> surfactants is still a challenge to chemists.<br />
In this paper a simple and rapid <strong>thin</strong>-<strong>layer</strong> <strong>chromatographic</strong> (TLC)<br />
method for analysis <strong>of</strong> cationic and non-ionic surfactants is reported. The<br />
method can be used to identify the types <strong>of</strong> surfactant present in different<br />
aqueous systems. We have successfully separated CPC (a cationic surfactant)<br />
from non-ionic surfactants, including Tween-20. Mutual <strong>separation</strong><br />
<strong>of</strong> CPC and Tween-20 is important because <strong>of</strong> their wide applicability in<br />
many environmentally benign systems [38–41].<br />
EXPERIMENTAL<br />
All experiments were performed at room temperature (30 ± 2°C).<br />
Chemicals and Reagents<br />
All chemicals were analytical reagent grade. Sodium chloride, methanol,<br />
and tetrahydr<strong>of</strong>uran (THF, 0.89 kg L −1 ) were from Merck, India.<br />
The surfactants studied were Triton-X (Tx-100), Brij-35 (Bj-35),<br />
Tween-20 (Tw-20), Cween-20 (Cw-20), Cween-40 (Cw-40), Cween-60<br />
(Cw-60), <strong>cetylpyridinium</strong> chloride (CPC), cetyltrimethylammonium bromide<br />
(CTAB), tetradecyltrimethylammonium bromide (TTAB), hexadecyl-<br />
- 239 -
trimethylammonium chloride (HDTAC), and dodecyltrimethylammonium<br />
bromide (DTAB). Solutions (1%, i.e. 1 g/100 mL) <strong>of</strong> the surfactants were<br />
prepared in methanol.<br />
The metal ion solutions studied, as their 1.0% aqueous solutions,<br />
were the nitrates <strong>of</strong> Zn 2+ , Al 3+ , Pb 2+ , Tl 3+ , and UO 2 2+ , the chlorides <strong>of</strong> Ni 2+ ,<br />
Hg 2+ , and Co 2+ , the sulphates <strong>of</strong> Cu 2+ and Fe 2+ , and K 2 Cr 2 O 7 .<br />
Chromatography<br />
Thin <strong>layer</strong> chromatography was performed on plates coated with<br />
silica gel G (Merck, India; code S 1 ), alumina (CDH, India; S 2 ), and kieselguhr<br />
(CDH; S 3 ).<br />
Preparation <strong>of</strong> TLC Plates<br />
TLC plates were prepared by mixing the adsorbent with doubledistilled<br />
water in the ratio 1:3. The resulting slurry was mechanically shaken<br />
for 5 min then coated on 20 cm × 3.5 cm glass plates to give <strong>layer</strong>s<br />
0.25 mm thick, by means <strong>of</strong> a TLC applicator. The plates were first dried<br />
in air at room temperature then activated by heating at 100°C for 1 h.<br />
After activation, the plates were kept in an air-tight chamber until used.<br />
Procedure<br />
The surfactant solutions (10 µL) were spotted on TLC plates by<br />
means <strong>of</strong> a micropipette and the spots were left to dry at room temperature.<br />
Chromatography was performed in 24 cm × 6 cm glass jars, with lids,<br />
previously equilibrated with mobile phase for 10 min. The plates were developed<br />
to a distance <strong>of</strong> 10 cm from the origin with the mobile phases<br />
listed in Table I. The development time was 25–30 min.<br />
After development, all surfactant spots were detected by use <strong>of</strong> modified<br />
Drangendorff’s reagent, which was prepared from two solutions, A<br />
and B. Solution A was prepared from two solutions, a solution <strong>of</strong> bismuth<br />
subnitrate (BiONO 3·H 2 O, 1.7 g) in acetic acid (20 mL) diluted to 100 mL<br />
with water, and a solution <strong>of</strong> potassium iodide (65 g in 200 mL water). These<br />
solutions were transferred to a 1-L volumetric flask, acetic acid (200<br />
mL) was added, and the contents were diluted to one litre with water. Solution<br />
B was prepared by dissolving barium chloride dihydrate (BaCl 2·2H 2 O,<br />
290 g) in 1 L water. Solutions A and B were mixed in the volume ratio 2:1<br />
and the resulting mixture was applied to the plates by means <strong>of</strong> a glass<br />
sprayer.<br />
- 240 -
Table I<br />
The mobile phases used<br />
Code Components a Composition<br />
M 1 THF<br />
M 2 THF–DDW 1 : 9<br />
M 3 THF–DDW 2 : 8<br />
M 4 THF–DDW 3 : 7<br />
M 5 THF–DDW 4 : 6<br />
M 6 THF–DDW 5 : 5<br />
M 7 THF–DDW 6 : 4<br />
M 8 THF–DDW 7 : 3<br />
M 9 THF–DDW 8 : 2<br />
M 10 THF–DDW 9 : 1<br />
a<br />
THF, tetrahydr<strong>of</strong>uran; DDW, double distilled water<br />
For <strong>separation</strong> <strong>of</strong> mixtures <strong>of</strong> surfactants, equal volumes <strong>of</strong> the surfactant<br />
solutions were mixed and 10 µL <strong>of</strong> the resulting mixture was applied<br />
to a TLC plate (S 1 ). The plate was developed with mobile phase M 7 ,<br />
the spots were detected, and R F values <strong>of</strong> the surfactant spots were calculated.<br />
To study <strong>of</strong> effect <strong>of</strong> nature <strong>of</strong> the adsorbent <strong>layer</strong> (silica gel G,<br />
alumina, or kieselguhr) on mobility, the surfactants were chromatographed<br />
by use <strong>of</strong> mobile phase M 7 and the plates were compared.<br />
For <strong>separation</strong> <strong>of</strong> microgram quantities <strong>of</strong> Tween-20 from milligram<br />
quantities <strong>of</strong> CPC, a TLC plate was first spotted several times with 10 µL<br />
Tween-20 solution (100 µg). After complete drying <strong>of</strong> the spots CPC standard<br />
solutions (10 µL containing 0.1–0.77 mg) were spotted at the same positions<br />
on the plate. Similarly, for <strong>separation</strong> <strong>of</strong> microgram quantities <strong>of</strong><br />
CPC from milligram quantities <strong>of</strong> Tween-20, a TLC plate was first spotted<br />
several times with 10 µL CPC solution (100 µg). Tween-20 standard solutions<br />
(10 µL containing 0.1–1.0 mg) were spotted at the same positions on<br />
the plate. The spots were dried and the plates were developed with M 7 .<br />
The separated spots were visualized with Drangendorff’s reagent, and the<br />
R F values <strong>of</strong> the separated surfactants were calculated.<br />
To study the effect <strong>of</strong> the presence <strong>of</strong> metal cations, as impurities,<br />
on the <strong>separation</strong> <strong>of</strong> the surfactants, standard solutions <strong>of</strong> CPC and Tween-<br />
20 (10 µL) were spotted several times on the same TLC plate (S 1 ) followed<br />
by spotting, at the same positions, <strong>of</strong> 10 µL <strong>of</strong> the cation being consi-<br />
- 241 -
dered as impurity. The plates were developed with M 7 , the spots were detected,<br />
and the R F values <strong>of</strong> the separated surfactants were calculated.<br />
Limits <strong>of</strong> detection for CPC and Tween-20 were determined by spotting<br />
different amounts <strong>of</strong> the surfactants on the TLC plates, developing the<br />
plates, and detecting the spots. The method was repeated with successive<br />
reduction <strong>of</strong> the amounts <strong>of</strong> CPC and Tween-20 applied until no spot was<br />
detected. The minimum amount <strong>of</strong> surfactant detectable on the TLC plate<br />
was taken as the limit <strong>of</strong> detection.<br />
For semi-quantitative analysis by measurement <strong>of</strong> spot-area, a series<br />
<strong>of</strong> standard solutions (1–5%, 10 µL) <strong>of</strong> CPC was spotted on silica gel<br />
<strong>layer</strong>s. The plates were developed with M 7 . After detection, the spots were<br />
copied on to tracing paper from the plates and the area <strong>of</strong> each spot was<br />
calculated.<br />
RESULTS AND DISCUSSION<br />
Chromatography <strong>of</strong> the surfactants was tested with ten mobile phases.<br />
With 100% THF almost all the surfactants migrated as badly tailing<br />
spots (R L − R T ≥ 0.3, where R L is the R F value <strong>of</strong> the leading edge <strong>of</strong> the<br />
spot and R T is the R F value <strong>of</strong> the trailing edge <strong>of</strong> the spot). HDTAC was<br />
an exception; a well formed compact spot was obtained near the point <strong>of</strong><br />
application (R F = 0.11). With mobile phases prepared from THF–water mix-<br />
Table II<br />
R F values <strong>of</strong> surfactants on silica gel <strong>layer</strong>s developed with different mobile phases<br />
Surfactant<br />
Mobile phase<br />
M 1 M 2 M 3 M 4 M 5 M 6 M 7 M 8 M 9 M 10<br />
Triton-X 100 0.45T 0.15T 0.42 0.58 0.72 0.76 0.87 0.87 0.88 0.84<br />
Brij-35 0.43T 0.36T 0.61T 0.57T 0.77 0.80 0.81 0.85T 0.68T 0.30T<br />
Tween-20 0.45T 0.12 0.40T 0.65T 0.76 0.80 0.86 0.82 0.75T 0.32T<br />
Cween-20 0.50T 0.32T 0.40T 0.40T 0.57T 0.67T 0.77T 0.79T 0.77T 0.50T<br />
Cween-40 0.45T 0.31T 0.40T 0.41T 0.42T 0.60T 0.77T 0.68T 0.65T 0.50T<br />
Cween-60 0.23T 0.12 0.37T 0.60T 0.72 0.81 0.81 0.81 0.81 0.30<br />
CPC 0.20T 0.00 0.00 0.03 0.05 0.06 0.07 0.10 0.12 0.07<br />
CTAB 0.45T 0.00 0.00 0.03 0.05 0.08 0.07 0.12 0.14 0.08<br />
TTAB 0.12T 0.00 0.00 0.05 0.05 0.07 0.12 0.10 0.11 0.08<br />
HDTAC 0.11 0.00 0.00 0.05 0.05 0.12 0.11 0.17 0.16 0.10<br />
DTAB 0.25T 0.07 0.07 0.12 0.06 0.08 0.08 0.12 0.12 0.10<br />
T indicates a tailing spot for which R L − R T ≥ 0.3, where R L is the R F value <strong>of</strong> the leading<br />
edge <strong>of</strong> the spot and R T is the R F value <strong>of</strong> the trailing edge <strong>of</strong> the spot<br />
- 242 -
tures in different volume ratios (M 2 –M 10 ) differential migration <strong>of</strong> the surfactants<br />
was observed. The results are presented in Table II.<br />
From the data presented in Table II it is evident that for low concentrations<br />
<strong>of</strong> THF (up to 30%) almost all the cationic surfactants except<br />
DTAB remained at the point <strong>of</strong> application and all the non-ionic surfactants<br />
except Triton-X 100 migrated as tailing spots (R L − R T ≥ 0.3). When<br />
mobile phases containing 40–70% THF were used (i.e. M 7 –M 10 ) most <strong>of</strong><br />
the surfactants (cationic and non-ionic) migrated as compact spots; this range<br />
<strong>of</strong> concentrations <strong>of</strong> THF is therefore useful for <strong>separation</strong> <strong>of</strong> cationic<br />
from non-ionic surfactants.<br />
The low mobility <strong>of</strong> cationic surfactants may be attributed to their<br />
strong electrostatic attraction to negative silanol groups on the silica gel<br />
surface whereas the non-ionic surfactants are adsorbed on the silica surface<br />
by hydrogen bonding [42,43]. A plot <strong>of</strong> R F against volume fraction <strong>of</strong><br />
THF in the mobile phase (Fig. 1) shows that the best <strong>separation</strong> <strong>of</strong> CPC<br />
from Tween-20 is achieved by use <strong>of</strong> the mobile phase containing 0.06<br />
mole fraction <strong>of</strong> THF (0.94 mole fraction <strong>of</strong> water). Mobile phase M 7<br />
(THF–DDW, 6:4) was therefore selected for detailed study.<br />
1<br />
0.8<br />
Rf CPC<br />
Rf Tw 20<br />
0.6<br />
0.4<br />
0.2<br />
0<br />
-0.2<br />
0 0.2 0.4 0.6 0.8 1<br />
Volume fraction <strong>of</strong> THF<br />
Fig. 1<br />
Plot <strong>of</strong> R F against volume fraction <strong>of</strong> THF for mutual <strong>separation</strong> <strong>of</strong> CPC from Tween-20<br />
- 243 -
The effect <strong>of</strong> the nature <strong>of</strong> different adsorbents (silica gel, alumina,<br />
and kieselguhr) on the mobility <strong>of</strong> the surfactants was examined using M 7<br />
as mobile phase. From the results presented in Fig. 2 three trends are apparent:<br />
1. The mobility <strong>of</strong> the surfactants decreased in the order alumina > kieselguhr<br />
> silica gel<br />
2. The best <strong>separation</strong> <strong>of</strong> each cationic surfactant from all the non-ionic<br />
surfactants was obtained on silica <strong>layer</strong>s. Because silica is a weakly acidic<br />
cation exchanger (Si–O–H Si–O − H + ) exchange <strong>of</strong> the cationic<br />
surfactants on its surface is possible and they are strongly retained near<br />
the point <strong>of</strong> application. The uncharged non-ionic surfactants, however,<br />
migrate with the solvent front. This enables <strong>separation</strong> <strong>of</strong> the cationic<br />
surfactants from the non-ionic compounds.<br />
3. Separation efficiency decreases in the order: silica gel > kieselguhr > alumina.<br />
As expected, worse <strong>separation</strong>s were obtained on both alumina<br />
and kieselguhr because they are not cation exchangers.<br />
1.2<br />
1.0<br />
0.8<br />
R F<br />
0.6<br />
0.4<br />
0.2<br />
<strong>Silica</strong> Gel S 1<br />
Alumina S 2<br />
Kieselguhr S 3<br />
0.0<br />
1 2 3 4 5 6 7 8 9 10 11<br />
Fig. 2<br />
Surfactants<br />
Effect <strong>of</strong> the nature <strong>of</strong> the stationary phase on the mobility <strong>of</strong> surfactants using M 7 as mobile<br />
phase. 1. Triton-X100, 2. Brij-35, 3. Tween-20, 4. Cween-20, 5. Cween-40, 6. Cween-<br />
60 (non-ionic surfactants), 7. CPC, 8. CTAB, 9. TTAB, 10. HDTAC, 11. DTAB (cationic<br />
surfactants)<br />
It was observed that on silica gel 100 µg Tween-20 could easily be<br />
separated from 0.7 mg CPC and that 100 µg CPC could easily be separated<br />
from 1.0 mg Tween-20, i.e. this TLC system is capable <strong>of</strong> separating<br />
- 244 -
microgram quantities <strong>of</strong> cationic surfactants from milligram quantities <strong>of</strong><br />
non-ionic surfactants and vice versa.<br />
Results showing the effect <strong>of</strong> different metal cations as impurities<br />
on the <strong>separation</strong> efficiency <strong>of</strong> CPC from Tween-20 are presented in<br />
Fig. 3.<br />
R F<br />
1.0<br />
0.8<br />
CPC<br />
Tw-20<br />
0.6<br />
Rf<br />
0.4<br />
0.2<br />
0.0<br />
Cu 2+ Zn 2+ Ni 2+ Hg 2+ Co 2+ Pb 2+ Uo UO 2+ Tl 2+ 2 Tl 3+ Al 3+ Fe 2+ Cr 6+ Without without<br />
impurity<br />
Fig. 3<br />
Metal ions<br />
Separation <strong>of</strong> CPC from Tween-20 on silica <strong>layer</strong>s, with M 7 as mobile phase, in the presence<br />
<strong>of</strong> metal cations as impurities<br />
It is clear from this figure that <strong>separation</strong> <strong>of</strong> CPC from Tween-20<br />
is hampered by the presence <strong>of</strong> Co 2+ , UO 2 2+ , and Al 3+ , because <strong>of</strong> comigration<br />
<strong>of</strong> the surfactants in the presence <strong>of</strong> these cations. Conversely,<br />
<strong>separation</strong> <strong>of</strong> CPC from Tween-20 is improved by the presence <strong>of</strong> Cr 6+ ,<br />
Fe 2+ , and Tl 3+ , because <strong>of</strong> reduction <strong>of</strong> the mobility <strong>of</strong> CPC. In the presence<br />
<strong>of</strong> the other metal cations (Cu 2+ , Zn 2+ , Ni 2+ , Hg 2+ , and Pb 2+ ), <strong>separation</strong><br />
<strong>of</strong> CPC from Tween-20 was always possible. Thus some metallic impurities<br />
in the surfactants have a detrimental effect on <strong>chromatographic</strong> performance.<br />
The lowest concentration detected after successive dilution was<br />
3 µg/10 µL for both CPC and Tween-20. This amount was taken as the<br />
detection limit, and indicates the method is a highly sensitive means <strong>of</strong><br />
detection <strong>of</strong> cationic and non-ionic surfactants.<br />
- 245 -
In addition to qualitative analysis, quantitative analysis <strong>of</strong> surfactants<br />
is <strong>of</strong>ten required. We attempted semi-quantitative determination <strong>of</strong><br />
the surfactants by measurement <strong>of</strong> spot area. A linear relationship was obtained<br />
between amount <strong>of</strong> CPC spotted (in the range 100–500 µg) and the<br />
area <strong>of</strong> the spot. The correlation coefficient, r, was 0.980, indicative <strong>of</strong> high<br />
positive correlation. At higher concentrations, a negative deviation from<br />
linearity was observed.<br />
Application<br />
To widen the applicability <strong>of</strong> the method, <strong>separation</strong> <strong>of</strong> CPC and<br />
Tween-20 from a variety <strong>of</strong> water samples was investigated. The results<br />
presented in Table III show that CPC and Tween-20 can be easily identified<br />
in a variety <strong>of</strong> water samples after <strong>separation</strong> on S 1 with M 7 as mobile<br />
phase.<br />
Table III<br />
Identification and <strong>separation</strong> <strong>of</strong> CPC and Tween-20 in water samples<br />
Sample<br />
Separation<br />
CPC Tween-20<br />
DDW 0.14 0.89<br />
Tap water 0.20 0.88<br />
Saline water 0.21 0.81<br />
River water 0.15 0.87<br />
ACKNOWLEDGMENT<br />
The authors are grateful to the Chairman, Department <strong>of</strong> Applied<br />
Chemistry, Aligarh Muslim University, Aligarh, India, for providing the necessary<br />
research facilities. The University Grants Commission, New Delhi,<br />
India, is thanked for financial assistance.<br />
REFERENCES<br />
[1] A.M. Schwartz and J.W. Perry (Eds) Surface Active Agents: Their<br />
Chemistry and Technology, Krieger, Huntington, 1979<br />
- 246 -
[2] M.J. Rosen, Phenomena in Mixed Surfactant Systems. In:<br />
J.F. Scamehorn (Ed.) ACS Symp. Ser. 311, Washington, DC, 1986,<br />
pp. 144-162<br />
[3] H.F. Eicke, W. Meier, and H. Hammerich, Colloids Surf. A,<br />
118, 141 (1996)<br />
[4] S.G. Dixit, A.R. Mahadeshwar, and S.K. Haram, Colloids Surf. A,<br />
133, 69 (1998)<br />
[5] W.B. Hugo and A.D. Russel, Factors Influencing the Efficacy<br />
<strong>of</strong> Antimicrobial Agents. In: A.D. Russel, W.B. Hugo,<br />
and G.A.J. Ayliffe (Eds.) Principles and Practice <strong>of</strong> Disinfection,<br />
Preservation and Sterilization, 2nd edn, Blackwell. Scientific<br />
Publications, Oxford, 1992, pp. 90–92<br />
[6] T.G. Scharff and W.C. Maupin, Biochem. Pharmacol., 5, 79 (1960)<br />
[7] F.W. Putnam, Adv. Protein Chem., 4, 79 (1948)<br />
[8] Y. Sakagami, H. Yokoyama, H. Nishimura, Y. Ose, and T. Tashima,<br />
Appl. Environ. Microbiol., 55, 2036 (1989)<br />
[9] J.P. Cabral, J. Basic Microbiol., 33, 219 (1993)<br />
[10] H.-Y. Cho, T. Tsuchido, H. Ono, and M. Takano, J. Ferment.<br />
Bioeng., 70, 11 (1990)<br />
[11] T. Tsuchido, A. Svarachern, H. Soga, and M. Takano, Antimicrob.<br />
Agents Chemother., 34, 781 (1990)<br />
[12] P.P. Sarpotdar and J.L. Latz, Drug, Dev. Ind. Pharm., 12, 1625 (1986)<br />
[13] A. Sanz-Medel, R.F. de la Campa, and J.I.G. Alonso, Analyst,<br />
112, 493 (1987)<br />
[14] M. Humphries, J.F. Jaworzyn, and J.B. Cantwell, FEMS Microbiol.<br />
Ecol., 38, 299 (1986)<br />
[15] M. Humphries, J.F. Jaworzyn, J.B. Cantwell, and A. Eakin, FEMS<br />
Microbiol. Lett., 42, 91 (1987)<br />
[16] T. Inoue, K. Miyakawa, and R. Shimozawa, Chem. Phys. Lipids,<br />
42, 261 (1986)<br />
[17] M. Djimbo and A.J. Moes, J. Pharm. Bdg., 41, 393 (1986)<br />
[18] J.C. Blake-Haskins, D. Scala, C.D. Rhein, and C.R. Robbins, J. Soc.<br />
Cosmet. Chem., 37, 199 (1986)<br />
[19] Y. Nomura, K. Ikebukuro, K. Yokoyama, T. Takeuchi, Y. Arikawa,<br />
S. Ohno, and I. Karube, Anal Lett., 27, 3095 (1994)<br />
[20] A.N. Reshetilov, I.N. Semenchuk, P.V. Iliasov, and L.A. Taranova,<br />
Anal. Chim. Acta, 19, 347 (1997)<br />
[21] T.E. Young and R.E. Synovec, Talanta, 43, 889 (1996)<br />
- 247 -
[22] S. Alegret, J. Alonso, J. Bartroli, J. Baro-Roma, J. Sanchez,<br />
and M. Delvalle, Analyst, 119, 2319 (1994)<br />
[23] M.Y. Ye, R.G. Walkup, and K.D. Hill, J. Liq. Chromatogr.,<br />
17, 4087 (1994)<br />
[24] E. Nakamura and S. Mukai, Anal. Sci., 17, 947 (2001)<br />
[25] T.V. Vladimirova and E.E. Morgunova, Russ. J. Appl. Chem.,<br />
74, 2095 (2001)<br />
[26] S. Hui-Feng, T. Nase, M. Takamori, N. Hata, I. Kasahara,<br />
and S. Taguchi, Anal. Sci., 17, 1291 (2001)<br />
[27] S. Hui-Feng, M. Takamori, N. Hata, I. Kasahara, and S. Taguchi,<br />
J. AOAC Int., 84, 1781 (2001)<br />
[28] K. Yammamoto, M. Oka, and H. Murakami, Anal. Chim. Acta,<br />
455, 83 (2002)<br />
[29] S. Mukai and E. Nakamura, Bunseki Kagaku, 50, 709 (2001)<br />
[30] K. Yammanoto, K. Nakashima, and T. Kimura, Bunseki Kagaku,<br />
51, 175 (2002)<br />
[31] Z. Shu-Lin, L. Shu-Ting, and B. Tan, Fenxi Kexne Xuebao,<br />
19, 240 (2003)<br />
[32] C. Vogt, GIT Labor-Fachzeits Chrit, 47, 551 (2003)<br />
[33] L. Hsuch-Ying and D. Wang-Hsion, J. Chromatogr. A,<br />
1025, 303 (2004)<br />
[34] C. Yu-Chei and S. Mei-Chuan, Rapid Commun. Mass Spectrom.,<br />
15, 2221 (2001)<br />
[35] M. Petrovic and D. Barcelo, J. Mass Spectrom., 36, 1173 (2001)<br />
[36] M. Barco, C. Planus, O. Palacios, F. Ventura, J. Rivera,<br />
and J. Caixach, Anal. Chem., 75, 5129 (2003)<br />
[37] J. Efer, W. Engewald, V. Ceglarck, and A. Schrieber, GIT Lab. J.,<br />
3, 192, 194-196 (1999)<br />
[38] C. Qing-Xi, H. Huang, and K. Isao, J. Protein Chem., 22, 481 (2003)<br />
[39] K. Lim and A. Mustapha, J. Food Prot., 67, 310 (2004)<br />
[40] M. Singh, V.S. Gill, H. Thippareddi, R.K. Phebus, J.L. Marsden,<br />
T.J. Herald, and A.L. Nutsch, Foodborne Pathog. Dis.,<br />
2, 233 (2003)<br />
[41] W.R. Jennifer and K.A. Kinney, J. Environ. Eng., 130, 292 (2004)<br />
[42] H. Rupprecht and H. Liebl, Kolloid Z.Z. Polym., 250, 719 (1972)<br />
[43] J.R. Aston, D.N. Furlong, F. Grieser, P.J. Scales, and G.G. Warr. In:<br />
J. Rouquerol and K.S.W. Sing (Eds) Adsorption at the Gas/Solid<br />
and Liquid/Solid Interface, Elsevier, Amsterdam, 1982, pp. 97–102<br />
- 248 -