Analyze Investments
Analyze Investments
Analyze Investments

You also want an ePaper? Increase the reach of your titles
YUMPU automatically turns print PDFs into web optimized ePapers that Google loves.
Speculative influence is reflected in the ratio of activity<br />
between Nasdaq and American Stock Exchange (AMEX)<br />
stocks to New York Stock Exchange (NYSE) volume. The<br />
theory is that when activity and prices of Nasdaq and AMEX<br />
stocks begin to move more rapidly than the blue chip issues,<br />
speculation is multiplying. That’s the time for conservative,<br />
rational investors to move to the sidelines.<br />
The Odd-Lot Index reveals how smaller investors<br />
view the market. The smaller investor is presumably less<br />
informed and so tends to follow established and predictable<br />
patterns. Concentrating on trades of fewer than 100 shares,<br />
the index alerts its followers when fry investors deviate<br />
from regular actions.<br />
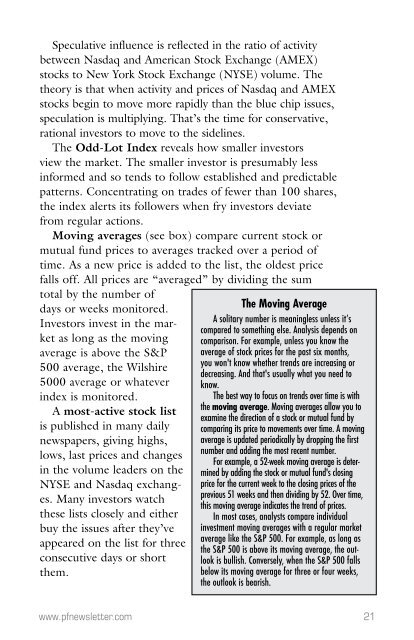
Moving averages (see box) compare current stock or<br />
mutual fund prices to averages tracked over a period of<br />
time. As a new price is added to the list, the oldest price<br />
falls off. All prices are “averaged” by dividing the sum<br />
total by the number of<br />
days or weeks monitored.<br />
Investors invest in the market<br />
as long as the moving<br />
average is above the S&P<br />
500 average, the Wilshire<br />
5000 average or whatever<br />
index is monitored.<br />
A most-active stock list<br />
is published in many daily<br />
newspapers, giving highs,<br />
lows, last prices and changes<br />
in the volume leaders on the<br />
NYSE and Nasdaq exchanges.<br />
Many investors watch<br />
these lists closely and either<br />
buy the issues after they’ve<br />
appeared on the list for three<br />
consecutive days or short<br />
them.<br />
The Moving Average<br />
A solitary number is meaningless unless it’s<br />
compared to something else. Analysis depends on<br />
comparison. For example, unless you know the<br />
average of stock prices for the past six months,<br />
you won't know whether trends are increasing or<br />
decreasing. And that's usually what you need to<br />
know.<br />
The best way to focus on trends over time is with<br />
the moving average. Moving averages allow you to<br />
examine the direction of a stock or mutual fund by<br />
comparing its price to movements over time. A moving<br />
average is updated periodically by dropping the first<br />
number and adding the most recent number.<br />
For example, a 52-week moving average is determined<br />
by adding the stock or mutual fund's closing<br />
price for the current week to the closing prices of the<br />
previous 51 weeks and then dividing by 52. Over time,<br />
this moving average indicates the trend of prices.<br />
In most cases, analysts compare individual<br />
investment moving averages with a regular market<br />
average like the S&P 500. For example, as long as<br />
the S&P 500 is above its moving average, the outlook<br />
is bullish. Conversely, when the S&P 500 falls<br />
below its moving average for three or four weeks,<br />
the outlook is bearish.<br />
www.pfnewsletter.com<br />
21