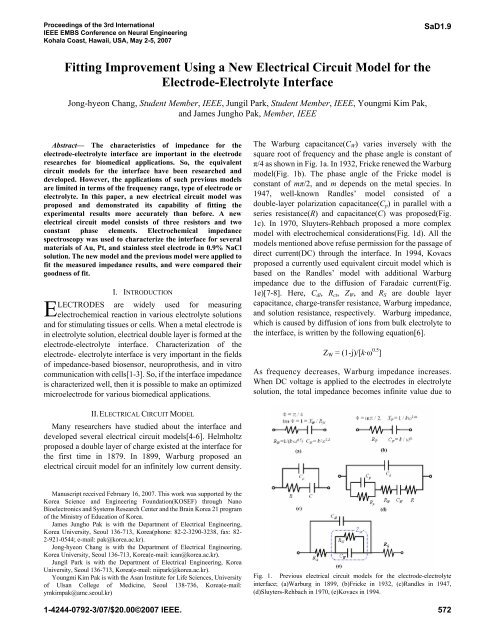
Fitting Improvement Using a New Electrical Circuit Model for the ...
Fitting Improvement Using a New Electrical Circuit Model for the ...
Fitting Improvement Using a New Electrical Circuit Model for the ...

You also want an ePaper? Increase the reach of your titles
YUMPU automatically turns print PDFs into web optimized ePapers that Google loves.
Proceedings of <strong>the</strong> 3rd International<br />
IEEE EMBS Conference on Neural Engineering<br />
Kohala Coast, Hawaii, USA, May 2-5, 2007<br />
SaD1.9<br />
<strong>Fitting</strong> <strong>Improvement</strong> <strong>Using</strong> a <strong>New</strong> <strong>Electrical</strong> <strong>Circuit</strong> <strong>Model</strong> <strong>for</strong> <strong>the</strong><br />
Electrode-Electrolyte Interface<br />
Jong-hyeon Chang, Student Member, IEEE, Jungil Park, Student Member, IEEE, Youngmi Kim Pak,<br />
and James Jungho Pak, Member, IEEE<br />
Abstract— The characteristics of impedance <strong>for</strong> <strong>the</strong><br />
electrode-electrolyte interface are important in <strong>the</strong> electrode<br />
researches <strong>for</strong> biomedical applications. So, <strong>the</strong> equivalent<br />
circuit models <strong>for</strong> <strong>the</strong> interface have been researched and<br />
developed. However, <strong>the</strong> applications of such previous models<br />
are limited in terms of <strong>the</strong> frequency range, type of electrode or<br />
electrolyte. In this paper, a new electrical circuit model was<br />
proposed and demonstrated its capability of fitting <strong>the</strong><br />
experimental results more accurately than be<strong>for</strong>e. A new<br />
electrical circuit model consists of three resistors and two<br />
constant phase elements. Electrochemical impedance<br />
spectroscopy was used to characterize <strong>the</strong> interface <strong>for</strong> several<br />
materials of Au, Pt, and stainless steel electrode in 0.9% NaCl<br />
solution. The new model and <strong>the</strong> previous model were applied to<br />
fit <strong>the</strong> measured impedance results, and were compared <strong>the</strong>ir<br />
goodness of fit.<br />
E<br />
I. INTRODUCTION<br />
LECTRODES are widely used <strong>for</strong> measuring<br />
electrochemical reaction in various electrolyte solutions<br />
and <strong>for</strong> stimulating tissues or cells. When a metal electrode is<br />
in electrolyte solution, electrical double layer is <strong>for</strong>med at <strong>the</strong><br />
electrode-electrolyte interface. Characterization of <strong>the</strong><br />
electrode- electrolyte interface is very important in <strong>the</strong> fields<br />
of impedance-based biosensor, neuropro<strong>the</strong>sis, and in vitro<br />
communication with cells[1-3]. So, if <strong>the</strong> interface impedance<br />
is characterized well, <strong>the</strong>n it is possible to make an optimized<br />
microelectrode <strong>for</strong> various biomedical applications.<br />
The Warburg capacitance(C W ) varies inversely with <strong>the</strong><br />
square root of frequency and <strong>the</strong> phase angle is constant of<br />
π/4 as shown in Fig. 1a. In 1932, Fricke renewed <strong>the</strong> Warburg<br />
model(Fig. 1b). The phase angle of <strong>the</strong> Fricke model is<br />
constant of mπ/2, and m depends on <strong>the</strong> metal species. In<br />
1947, well-known Randles’ model consisted of a<br />
double-layer polarization capacitance(C p ) in parallel with a<br />
series resistance(R) and capacitance(C) was proposed(Fig.<br />
1c). In 1970, Sluyters-Rehbach proposed a more complex<br />
model with electrochemical considerations(Fig. 1d). All <strong>the</strong><br />
models mentioned above refuse permission <strong>for</strong> <strong>the</strong> passage of<br />
direct current(DC) through <strong>the</strong> interface. In 1994, Kovacs<br />
proposed a currently used equivalent circuit model which is<br />
based on <strong>the</strong> Randles’ model with additional Warburg<br />
impedance due to <strong>the</strong> diffusion of Faradaic current(Fig.<br />
1e)[7-8]. Here, C dl , R ct , Z W , and R S are double layer<br />
capacitance, charge-transfer resistance, Warburg impedance,<br />
and solution resistance, respectively. Warburg impedance,<br />
which is caused by diffusion of ions from bulk electrolyte to<br />
<strong>the</strong> interface, is written by <strong>the</strong> following equation[6].<br />
Z W = (1-j)/[k·ω 0.5 ]<br />
As frequency decreases, Warburg impedance increases.<br />
When DC voltage is applied to <strong>the</strong> electrodes in electrolyte<br />
solution, <strong>the</strong> total impedance becomes infinite value due to<br />
II. ELECTRICAL CIRCUIT MODEL<br />
Many researchers have studied about <strong>the</strong> interface and<br />
developed several electrical circuit models[4-6]. Helmholtz<br />
proposed a double layer of charge existed at <strong>the</strong> interface <strong>for</strong><br />
<strong>the</strong> first time in 1879. In 1899, Warburg proposed an<br />
electrical circuit model <strong>for</strong> an infinitely low current density.<br />
Manuscript received February 16, 2007. This work was supported by <strong>the</strong><br />
Korea Science and Engineering Foundation(KOSEF) through Nano<br />
Bioelectronics and Systems Research Center and <strong>the</strong> Brain Korea 21 program<br />
of <strong>the</strong> Ministry of Education of Korea.<br />
James Jungho Pak is with <strong>the</strong> Department of <strong>Electrical</strong> Engineering,<br />
Korea University, Seoul 136-713, Korea(phone: 82-2-3290-3238, fax: 82-<br />
2-921-0544; e-mail: pak@korea.ac.kr).<br />
Jong-hyeon Chang is with <strong>the</strong> Department of <strong>Electrical</strong> Engineering,<br />
Korea University, Seoul 136-713, Korea(e-mail: ican@korea.ac.kr).<br />
Jungil Park is with <strong>the</strong> Department of <strong>Electrical</strong> Engineering, Korea<br />
University, Seoul 136-713, Korea(e-mail: niipark@korea.ac.kr).<br />
Youngmi Kim Pak is with <strong>the</strong> Asan Institute <strong>for</strong> Life Sciences, University<br />
of Ulsan College of Medicine, Seoul 138-736, Korea(e-mail:<br />
ymkimpak@amc.seoul.kr)<br />
Fig. 1. Previous electrical circuit models <strong>for</strong> <strong>the</strong> electrode-electrolyte<br />
interface; (a)Warburg in 1899, (b)Fricke in 1932, (c)Randles in 1947,<br />
(d)Sluyters-Rehbach in 1970, (e)Kovacs in 1994.<br />
1-4244-0792-3/07/$20.00©2007 IEEE. 572
<strong>the</strong> frequency dependence of <strong>the</strong> Warburg impedance.<br />
However, <strong>the</strong> Kovacs’ model, omitting <strong>the</strong> circuit element R ct<br />
or Z W , in accordance with experimental conditions is often<br />
used[6, 9-12]. In Fig. 1e, constant phase element(CPE) was<br />
used instead of C dl , because a capacitor in electrochemical<br />
impedance spectroscopy(EIS) normally does not behave<br />
ideally and act like a CPE[6].<br />
Z CPE = 1/[A·(jω) a ]<br />
When this equation describes a capacitor, <strong>the</strong> exponent a is 1.<br />
For a CPE, <strong>the</strong> exponent a is less than 1.<br />
To overcome <strong>the</strong> problem of <strong>the</strong> previous model, we make<br />
a new electrical circuit model <strong>for</strong> <strong>the</strong> electrode-electrolyte<br />
interface as shown in Fig. 2. In this model, Warburg<br />
impedance was replaced by CPE b and R b paralleled <strong>for</strong> <strong>the</strong><br />
passage of DC through <strong>the</strong> interface. With this model, total<br />
impedance becomes a finite value even at 0 Hz due to R b . <strong>the</strong>n<br />
<strong>the</strong> total impedance is given by<br />
Z(0) = R a +R b +R S<br />
<strong>the</strong> Kovacs’ model. So, <strong>the</strong> applicable range of this model is<br />
broader than Kovacs’ model at least.<br />
III. EXPERIMENTS<br />
To measure and analyze <strong>the</strong> impedance characteristics<br />
according to <strong>the</strong> frequency, EIS was used. Fig 3 shows<br />
3-electrode system consisted of a working electrode(WE), a<br />
reference electrode(RE) and a counter electrode(CE) <strong>for</strong><br />
stable EIS. Each of Au, Pt and stainless steel(SUS) wire with<br />
5.0 mm 2 in <strong>the</strong> surface area was used as a WE. Where, <strong>the</strong><br />
diameter of each wire electrode was 0.4mm, and <strong>the</strong> length<br />
was 4mm. A commercial Ag/AgCl electrode(RE-5B,<br />
Bioanalytical Systems Inc.) was used as a RE, and Pt coil with<br />
about 400 mm 2 in <strong>the</strong> surface area was used as a CE. The<br />
electrolyte solution was physiological saline, 0.9% NaCl,<br />
with <strong>the</strong> volume of 15mL.<br />
AC voltage of 10mV rms with respect to <strong>the</strong> open-circuit<br />
potential was applied typically and impedance according to<br />
<strong>the</strong> frequency was measured by Potentiostatic EIS(PCI4/750,<br />
Gamry Instruments Inc.). As <strong>the</strong> frequency is lower, <strong>the</strong><br />
If R b has infinite value and <strong>the</strong> parameter of CPE b , b has a<br />
certain value of 0.5, <strong>the</strong>n <strong>the</strong> new model can be converted to<br />
Fig. 2. A <strong>New</strong> electrical circuit model <strong>for</strong> <strong>the</strong> electrode-electrolyte<br />
interface.<br />
Fig. 3. 3-electrode system <strong>for</strong> electrochemical impedance spectroscopy.<br />
Impedance Magnitude [Ω]<br />
10 10 10 8<br />
10 7<br />
10 6<br />
10 5<br />
10 4<br />
10 3<br />
10 2<br />
Frequency [Hz]<br />
10 9<br />
0<br />
10 1<br />
-90<br />
10 -6 10 -5 10 -4 10 -3 10 -2 10 -1 10 0 10 1 10 2 10 3 10 4 10 5 10 6<br />
10<br />
-10<br />
-20<br />
-30<br />
-40<br />
-50<br />
-60<br />
-70<br />
-80<br />
Impedance Phase [degrees]<br />
-imag Z [Ω]<br />
20.0M<br />
15.0M<br />
10.0M<br />
5.0M<br />
0.0<br />
0.0 5.0M 10.0M 15.0M 20.0M 25.0M<br />
real Z [Ω]<br />
-imag Z [Ω]<br />
2.0M<br />
1.5M<br />
1.0M<br />
500.0k<br />
0.0<br />
0.0 500.0k 1.0M 1.5M 2.0M 2.5M 3.0M<br />
real Z [Ω]<br />
-imag Z [Ω]<br />
120.0k<br />
100.0k<br />
80.0k<br />
60.0k<br />
40.0k<br />
20.0k<br />
0.0<br />
0.0 20.0k 40.0k 60.0k 80.0k 100.0k 120.0k 140.0k<br />
real Z [Ω]<br />
(a) (b) (c)<br />
Fig. 4. Impedance magnitude and phase experimental results, and Nyquist diagram <strong>for</strong> (a)Au, (b)Pt, and (c)SUS wire electrodes in 0.9% NaCl with fitting by<br />
Kovacs’ model(dashed line) and new model(solid line).<br />
573
TABLE I<br />
FITTING PARAMETER RESULTS FOR THE ELECTRODE-ELECTROLYTE INTERFACE<br />
Parameter<br />
Au/0.9% NaCl Pt/0.9% NaCl SUS/0.9% NaCl<br />
Kovacs’ model <strong>New</strong> model Kovacs’ model <strong>New</strong> model Kovacs’ model <strong>New</strong> model<br />
R S [Ω] 88 87.3 83.7 83.8 90.6 91.1<br />
Deviation 1.59 1.13 0.807 0.926 1.23 1.43<br />
R b [Ω] ∞ 1.62e7 ∞ 1.27e6 ∞ 8.45e4<br />
Deviation - 2.07e7 - 1.00e6 - 4.18e4<br />
R ct or R a [Ω] 3.52e3 7.54e6 1.55e6 1.34e6 5.24e4 4.93e4<br />
Deviation 1.56e6 3.19e6 1.14e5 4.46e5 8.71e2 3.03e3<br />
k or B [S·s b ] 3.36e-7 1.09e-6 5.53e-6 4.80e-6 1.12e-4 8.06e-5<br />
Deviation 4.10e-8 1.61e-6 9.77e-7 7.49e-6 5.76e-6 1.99e-5<br />
b 0.5 0.888 0.5 0.767 0.5 0.543<br />
Deviation - 5.14e-1 - 4.43e-1 - 1.25e-1<br />
A [S·s a ] 2.22e-6 2.42e-6 5.54e-6 5.49e-6 3.68e-6 3.57e-6<br />
Deviation 1.51e-7 3.74e-8 6.40e-8 1.01e-7 7.78e-8 1.14e-7<br />
a 0.876 0.865 0.893 0.895 0.772 0.776<br />
Deviation 1.55e-2 2.65e-3 2.23e-3 3.43e-3 3.08e-3 4.40e-3<br />
Goodness of fit 6.67e-4 1.96e-4 1.11e-3 1.06e-3 6.92e-4 1.64e-4<br />
impedance magnitude is higher, and <strong>the</strong> current approaches<br />
<strong>the</strong> system measurement limit. So, <strong>the</strong> frequency range was<br />
set between 10 -2 ~ 10 5 Hz. To obtain <strong>the</strong> appropriate electrical<br />
circuit model from <strong>the</strong> measured result, <strong>the</strong> analysis was<br />
per<strong>for</strong>med by using Echem Analyst(Gamry Instruments Inc.).<br />
Both of <strong>the</strong> Kovacs’ model and new model were applied to fit,<br />
and <strong>the</strong> fitting parameters are obtained.<br />
Fig. 4 shows <strong>the</strong> EIS measurements and model results <strong>for</strong><br />
5.0mm 2 Au, Pt, and SUS wire electrodes with fitting by<br />
Kovacs’ model and new model, and Table I shows <strong>the</strong> fitting<br />
parameter results <strong>for</strong> <strong>the</strong> Au/0.9% NaCl, Pt/0.9% NaCl, and<br />
SUS/0.9% NaCl interface.<br />
In <strong>the</strong> fitted results by <strong>the</strong> Kovacs’ model, <strong>the</strong> impedance<br />
magnitude goes up with <strong>the</strong> frequency goes down at <strong>the</strong> very<br />
low frequency. However, in <strong>the</strong> results by <strong>the</strong> new model, <strong>the</strong><br />
impedance goes to a finite value. Both of <strong>the</strong> two models<br />
seem to be fitted well, but <strong>the</strong> new model was fitted more<br />
precisely. Small goodness of fit in Table 1 presents high<br />
accuracy.<br />
V. CONCLUSIONS<br />
A new electrical circuit model <strong>for</strong> <strong>the</strong> electrode-electrolyte<br />
interface was proposed and used to analyze <strong>the</strong> EIS<br />
experimental results comparing with a previous model. Au, Pt<br />
and SUS wire electrode and 0.9% NaCl solution were used to<br />
measure <strong>the</strong> impedance characteristics according to <strong>the</strong><br />
frequency range of 10 -2 ~ 10 5 Hz. The new model was fitted<br />
better than Kovacs’s model at <strong>the</strong> low frequency range, and it<br />
was possible to predict <strong>the</strong> impedance at very low frequency<br />
inclusive of DC using <strong>the</strong> new model. This model will be<br />
applicable to various biomedical applications instead of<br />
previous models <strong>for</strong> accurate analysis.<br />
REFERENCES<br />
[1] L. Yang, et al., “Detection of viable Salmonella typhimurium by<br />
impedance measurement of electrode capacitance and medium<br />
resistance,” Biosensors and Bioelectronics, Vol. 19, pp. 495-502, 2003.<br />
[2] C. Q. Huang, et al., “<strong>Electrical</strong> stimulation of <strong>the</strong> auditory nerve: direct<br />
current measurement in vivo,” IEEE Transactions on Biomedical<br />
Engineering, Vol. 46, pp. 461-469, 1999.<br />
[3] P. Thiebaud, et al., “An array of Pt-tip microelectrodes <strong>for</strong> extracellular<br />
monitoring of activity of brain slices,” Biosensors and Bioelectronics,<br />
Vol. 14, pp. 61–65, 1999.<br />
[4] L. A. Geddes, “Historical evolution of circuit models <strong>for</strong> <strong>the</strong><br />
electrode-electrolyte interface,” Annals of Biomedical Engineering,<br />
Vol. 25, pp. 1-14, 1997.<br />
[5] B. Onaral, et al., “Linear and nonlinear properties of platinum electrode<br />
polarization. Part 1: Frequency dependence at very low frequencies,”<br />
Medical and Biological Engineering and Computing, Vol. 20, pp.<br />
299–306, 1982.<br />
[6] W. Franks, et al., “Impedance characterization and modeling of<br />
electrodes <strong>for</strong> biomedical applications,” IEEE Transactions on<br />
Biomedical Engineering, Vol. 52, No. 7, 2005.<br />
[7] G. T. A. Kovacs, “Introduction to <strong>the</strong> <strong>the</strong>ory, design, and modeling of<br />
thin-film microelectrodes <strong>for</strong> neural interfaces,” in Enabling<br />
Technologies <strong>for</strong> Cultured Neural Networks, D.A. Stenger and T.M.<br />
McKenna, Eds. <strong>New</strong> York: Academic, 1994, Chap. 7, pp. 121-165.<br />
[8] K. Mathieson, et al., “Large-area microelectrode arrays <strong>for</strong> recording of<br />
Neural signals,” IEEE Transactions on Nuclear Science, Vol. 51, No. 5,<br />
pp. 2027-2031, 2004.<br />
[9] D. R. Merrill, et al., “<strong>Electrical</strong> stimulation of excitable tissue: design of<br />
efficacious and safe protocols,” Journal of Neuroscience Methods, Vol.<br />
141, pp. 171-198, 2005.<br />
[10] X. Huang, et al., “Simulation of microelectrode impedance changes due<br />
to cell growth,” IEEE Sensors Journal, Vol. 4, No. 5, pp. 576-583,<br />
2004.<br />
[11] A. Richardot, et al., “Harmonic analysis of low-frequency bioelectrode<br />
behavior,” IEEE Transactions on Medical Imaging, Vol. 21, No. 6, pp.<br />
604-612, 2002.<br />
[12] E. T. McAdams, et al., “Nonlinear transient response of electrodeelectrolyte<br />
interfaces,” Medical and Biological Engineering and<br />
Computing, Vol. 38, pp. 427-432, 2000.<br />
574