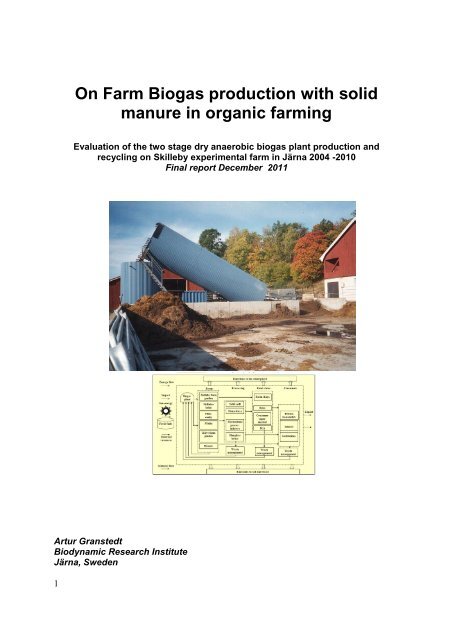
On Farm Biogas production with solid manure in organic farming
On Farm Biogas production with solid manure in organic farming
On Farm Biogas production with solid manure in organic farming

You also want an ePaper? Increase the reach of your titles
YUMPU automatically turns print PDFs into web optimized ePapers that Google loves.
<strong>On</strong> <strong>Farm</strong> <strong>Biogas</strong> <strong>production</strong> <strong>with</strong> <strong>solid</strong><br />
<strong>manure</strong> <strong>in</strong> <strong>organic</strong> farm<strong>in</strong>g<br />
Evaluation of the two stage dry anaerobic biogas plant <strong>production</strong> and<br />
recycl<strong>in</strong>g on Skilleby experimental farm <strong>in</strong> Järna 2004 -2010<br />
F<strong>in</strong>al report December 2011<br />
Artur Granstedt<br />
Biodynamic Research Institute<br />
Järna, Sweden<br />
1
Evaluation of the two stage dry anaerobic biogas plant and the<br />
<strong>in</strong>fluence on <strong>production</strong> and recycl<strong>in</strong>g on Skilleby experimental<br />
farm <strong>in</strong> Järna 2004 -2010<br />
Background<br />
European countries are committed to reduce CO 2 emissions orig<strong>in</strong>at<strong>in</strong>g from fossil fuels.<br />
Additional changes <strong>in</strong> policy priorities as well as the development of agricultural technology<br />
are important driv<strong>in</strong>g forces. Organic farm<strong>in</strong>g pr<strong>in</strong>ciples for their part <strong>in</strong>clude the use of<br />
renewable energy resources and the m<strong>in</strong>imisation of nutrient losses on-farm as far as possible.<br />
<strong>On</strong>-farm produced biogas may replace fossil fuels and thereby contribute to achieve the target<br />
of reduced green house gas emissions. Losses of nitrogen are also reduced by dry anaerobic<br />
digestion of <strong>organic</strong> material. In accordance <strong>with</strong> the EU-regulation (EU 1774/2002) animal<br />
by-products can also be used for biogas <strong>production</strong>.<br />
Most on-farm biogas plants <strong>in</strong> Europe use slurry and co-substrate for biogas <strong>production</strong>. This<br />
technology is reasonable only on farms, where slurry technology is already <strong>in</strong> use. Slurry<br />
based biogas plants are well developed <strong>in</strong> those European countries where <strong>in</strong>vestment<br />
subsidies for biogas plants are granted and prices for electric power <strong>production</strong> are low. Such<br />
favourable conditions prevail ma<strong>in</strong>ly <strong>in</strong> Germany. <strong>Farm</strong>s, which use a dry <strong>manure</strong> cha<strong>in</strong><br />
technology, and farms <strong>with</strong>out livestock are not able to use the prevail<strong>in</strong>g on-farm biogas<br />
technology.<br />
The top 10 benefits of dry anaerobic-digestion biogas plants are clearly <strong>in</strong> l<strong>in</strong>e <strong>with</strong> <strong>organic</strong><br />
farm<strong>in</strong>g pr<strong>in</strong>ciples and strengthen susta<strong>in</strong>able agriculture (Hoffmann, 2002, quote from<br />
Schäfer, Lehto and Teye, 2006):<br />
1. Dry anaerobic digestion is suitable for nearly all farm residues like <strong>manure</strong>, plant<br />
residues, and household <strong>organic</strong> wastes. Higher energy density compared to slurry<br />
digestion requires reduced reactor capacity and reduces construction costs.<br />
2. High dry matter content reduces transport costs due to reduced mass transfer <strong>in</strong><br />
respect of the produced biogas quantity per mass unit.<br />
3. Mobile digester modules allow batch <strong>production</strong> and cont<strong>in</strong>uous, easily controllable<br />
gas <strong>production</strong>.<br />
4. Dry anaerobic digestion residues can be composted and <strong>in</strong> this way fertilisers, also suitable<br />
for off-farm use, are produced. Composted <strong>manure</strong> may also be better for food quality<br />
compared to liquid <strong>manure</strong>.<br />
5. Dry anaerobic batch digestion does not need special techniques like slurry pumps,<br />
mixers, shredders, and liquid <strong>manure</strong> <strong>in</strong>jectors for distribution. Most of the mach<strong>in</strong>ery<br />
needed for fill<strong>in</strong>g and discharg<strong>in</strong>g the digester like front loaders and <strong>manure</strong><br />
spreaders are often already available on-farm.<br />
6. The amount of energy required for heat<strong>in</strong>g the process is lower than <strong>in</strong> slurry reactors<br />
because of<br />
reduced reactor size. Process energy of dry anaerobic batch digestion is not<br />
required because cont<strong>in</strong>uous homogenisation is not needed.<br />
7. There is improved process stability and reliability. There occur no problems like foam or<br />
sedimentation. Possible digestion breakdowns are easily dealt <strong>with</strong> <strong>in</strong> batch<br />
2
digesters by exchang<strong>in</strong>g the module.<br />
8.There are reduced odour emissions because there is no slurry <strong>in</strong>volved.<br />
9. There is reduced nutrient run-off dur<strong>in</strong>g storage and distribution of digester residues<br />
because there is no liquid mass transfer.<br />
10. The process is suitable for farms <strong>with</strong>out slurry technology, especially farms us<strong>in</strong>g deep<br />
litter<br />
systems e.g. chicken <strong>production</strong>. 50% of Swedish <strong>manure</strong> orig<strong>in</strong>ates from farms<br />
handl<strong>in</strong>g <strong>solid</strong> dung.<br />
The <strong>Biogas</strong> plant on the Biodynamic experimental farm Skilleby - Yttereneby <strong>in</strong><br />
Järna and the aim of this study.<br />
Figure 1. The two stage dry anaerobic-digestion biogas plant <strong>in</strong> Järna build on the biodynamic<br />
farm Yttereneby Järna by the Biodynamic Research Institute (Photo 2003, Wienfried<br />
Schäfer).<br />
<strong>On</strong>e of the world's first large scale on-farm dry anaerobic-digestion biogas plants has been<br />
built on the ma<strong>in</strong>ly self-support<strong>in</strong>g farm organism, Skilleby-Yttereneby by the Biodynamic<br />
Research Institute <strong>in</strong> Järna. This on-farm biogas plant is <strong>in</strong>tegrated <strong>in</strong>to the farm<strong>in</strong>g system<br />
and employs a new process technique: Dairy cattle <strong>manure</strong> and <strong>organic</strong> residues orig<strong>in</strong>at<strong>in</strong>g<br />
from the farm and nearby food process<strong>in</strong>g units are digested <strong>in</strong> two different reactors.<br />
3
The first reactor is cont<strong>in</strong>uously filled <strong>with</strong> <strong>solid</strong> <strong>manure</strong> from a stanchion barn. The <strong>organic</strong><br />
matter conta<strong>in</strong>s 17.7 to 19.6 % total <strong>solid</strong>s. After digestion the residue is discharged and<br />
separated <strong>in</strong>to a liquid and a <strong>solid</strong> fraction. The liquid fraction is further digested <strong>in</strong> a methane<br />
reactor and the effluent is used as liquid fertiliser. The <strong>solid</strong> fraction is composted and used as<br />
<strong>manure</strong> on the w<strong>in</strong>ter wheat <strong>in</strong> the five year crop rotation. The use of the composted <strong>manure</strong><br />
has been evaluated as part of the long term study dur<strong>in</strong>g 2006 – 2010.<br />
The <strong>Biogas</strong> plant is build on the farm YtterEneby which functions as a unit <strong>with</strong> Skilleby<br />
experimental farm. The purpose of the plant is to evaluate and demonstrate the possibility to<br />
achieve ecological recycl<strong>in</strong>g agriculture which is fully based on the local renewable resources,<br />
is environmentally susta<strong>in</strong>able and <strong>with</strong> the best possible productivity and food quality.<br />
The follow<strong>in</strong>g goals were formulated:<br />
1. To make agriculture <strong>production</strong> self sufficient <strong>in</strong> energy<br />
2. To reduce the negative impact on the environment compared to traditional <strong>manure</strong><br />
management <strong>with</strong> respect to green house gas emissions , leach<strong>in</strong>g of plant nutrients,<br />
and ammoniac emissions.<br />
3. To <strong>in</strong>crease the efficiency <strong>in</strong> agriculture <strong>production</strong> through effective <strong>in</strong>ternal<br />
recycl<strong>in</strong>g of plant nutrients <strong>in</strong> <strong>manure</strong> and liquid <strong>manure</strong> and <strong>with</strong> reduced losses<br />
from the farm<strong>in</strong>g system accord<strong>in</strong>g <strong>in</strong> l<strong>in</strong>e <strong>with</strong> ecological recycl<strong>in</strong>g agriculture<br />
(ERA) pr<strong>in</strong>ciples (Granstedt, et al 2008).<br />
The objectives of this study is to evaluate the extent to which these goals have been reached<br />
and identify possible improvements. In addition this study will evaluate:<br />
4. the capacity of <strong>manure</strong> to improve the fertility of and humus content <strong>in</strong> soil thereby<br />
improv<strong>in</strong>g yields and food quality .<br />
The evaluation <strong>in</strong>cludes the technical evaluation of the biogas plant, the material and nutrient<br />
flows on the whole Skilleby/Yttereneby farm unit and field studies over many years.<br />
The two-stage fermentation process results <strong>in</strong> the <strong>production</strong> of two fractions of <strong>manure</strong> , one<br />
<strong>solid</strong> fraction and one liquid fraction. The <strong>solid</strong> fraction has been composted and compared<br />
<strong>with</strong> non-fermented <strong>manure</strong>. The liquid <strong>manure</strong> has been used like ur<strong>in</strong>e. The evaluation<br />
has been done as an <strong>in</strong>tegrated part of the long-term on-farm study of <strong>manure</strong> recycl<strong>in</strong>g and<br />
utilisation on Skilleby- Yttereneby .<br />
The the technical evaluation of the biogas plant covers the period between 2003 -2005, the<br />
biological evaluation of the fermentation and on farm studies <strong>in</strong>clud<strong>in</strong>g comparative field<br />
trials were carried out between 2006 and 2008.. The future of the biogas plant at Yttereneby<br />
has not yet been decided. To cover the costs for manag<strong>in</strong>g the biogas plant it would be<br />
necessary to <strong>in</strong>crease <strong>production</strong> and the price of the biogas <strong>in</strong> order to cover <strong>production</strong><br />
costs. This would be possible if the application to the Swedish Board of Agriculture to use<br />
slaughter wastes from the local wild meat slaughterhouse close to the farm is approved and<br />
the subsides for <strong>in</strong>vestments to produce electric power from the gas produced <strong>in</strong> the biogas<br />
plant are granted.<br />
4
Material and methods<br />
Technical description of Skilleby – Yttereneby biogas plant<br />
The first reactor is cont<strong>in</strong>uously filled <strong>with</strong> <strong>solid</strong> <strong>manure</strong> from a stanchion barn. The <strong>organic</strong><br />
matter conta<strong>in</strong>s 17.7 to 19.6 % total <strong>solid</strong>s. After discharge the digestion residue is separated<br />
<strong>in</strong>to a liquid and a <strong>solid</strong> fraction. The liquid fraction is further digested <strong>in</strong> a methane reactor<br />
and the effluent is used as liquid fertiliser. A complete technical description of the biogas<br />
plant has published (Schäfer, Lehto and Teye, 2006).<br />
5
Figure 2. The Material flow chart of the biogas plant at Yttereneby, Järna, Sweden (<br />
Schäfer, Lehto and Teye, 2006)<br />
Figure 3. Material flow diagram <strong>with</strong> <strong>manure</strong>, feed<strong>in</strong>g and mix<strong>in</strong>g marked.<br />
(Schäfer, Lehto and Teye, 2006)<br />
6
Figure 4. Pictures illustrat<strong>in</strong>g <strong>manure</strong> from the cow, feed<strong>in</strong>g and mix<strong>in</strong>g<br />
Feed<strong>in</strong>g and mix<strong>in</strong>g 1 (Figure 3 and 4)<br />
A hydraulic powered scraper shifts <strong>manure</strong> <strong>in</strong>to feeder channel (1 <strong>in</strong> figure 2)). The <strong>manure</strong> of 65<br />
livestock units kept <strong>in</strong> a dairy stanchion is a mixture of faeces , straw and oat husks. A part of the<br />
output of the hydrolysis is conveyed back to the feeder channel and <strong>in</strong>oculated <strong>in</strong>to the fresh <strong>manure</strong>.<br />
The ur<strong>in</strong>e is separated <strong>in</strong> the stall via a perforated scraper floor.<br />
Figure 4. Pictures illustrat<strong>in</strong>g <strong>manure</strong> from the cow, feed<strong>in</strong>g and mix<strong>in</strong>g<br />
Hydrolysis reactor (figure 5)<br />
The <strong>manure</strong> is pressed to the top of the 30 o <strong>in</strong>cl<strong>in</strong>ed hydrolysis reactor <strong>with</strong> a 53 m 3 capacity. The<br />
bottom of the hydrolysis reactor on both sides of the feeder pipe is provided <strong>with</strong> hot water channels.<br />
The 400 mm wide feeder pipe is made of PVC. The substrate is discharged through a bottomless<br />
drawer <strong>in</strong> the lower part of the reactor. The drawer is guided <strong>with</strong><strong>in</strong> a regular channel and powered<br />
by a hydraulic cyl<strong>in</strong>der.<br />
.<br />
7
Figure 5. Outside and <strong>in</strong>side of the hydrolysis reactor<br />
Separation <strong>in</strong> liquid and <strong>solid</strong> fractions (Figure 6)<br />
From the transport screw the major part of the substrate partly drops <strong>in</strong>to a down cross<strong>in</strong>g extruder<br />
screw where it is separated <strong>in</strong>to liquid and <strong>solid</strong> fractions. The liquid fraction is collected <strong>in</strong> a buffer<br />
conta<strong>in</strong>er of 2 m3 capacity (8 <strong>in</strong> figure 2) and from there pumped <strong>in</strong> methane reactor (10 <strong>in</strong> figure 2).<br />
The <strong>solid</strong> fraction from the extruder screw is stored on the dung yard for compost<strong>in</strong>g. Liquid from<br />
the buffer conta<strong>in</strong>er returns <strong>in</strong>to the feeder pipe of the hydrolysis reactor to improve the flow ability.<br />
Figure 6. Separation <strong>in</strong>to liquid and <strong>solid</strong> fractions.<br />
Methane generation (figures 7 and 8)<br />
The methane reactor is 4 m high <strong>with</strong> a total capacity of 17,6 m3 and filled <strong>with</strong> elements offer<strong>in</strong>g a<br />
large surface area for methane bacteria settlements. After a reaction time of 15 to 16 days at 38oC<br />
the effluent <strong>in</strong> the methane reactor is pumped <strong>in</strong>to the slurry store (11 <strong>in</strong> figure 2). The gas generated<br />
<strong>in</strong> both reactors is collected and stored <strong>in</strong> a sack <strong>in</strong> a conta<strong>in</strong>er. A compressor generates 170 mbar<br />
pressure to supply the burners of the process and estate boiler <strong>with</strong> biogas for heat<strong>in</strong>g purposes.<br />
The first biogas <strong>production</strong> started <strong>in</strong> 15 th of November 2003. The biogas <strong>production</strong> until beg<strong>in</strong>n<strong>in</strong>g<br />
of the pasture period 8 th of May is shown <strong>in</strong> figure 9. A frozen gas pipe blased the gas yield of the<br />
hydrolysis reactor impeded correct measurement of the gas yield <strong>in</strong> April. The potential cumulative<br />
8
gas yield capacity was therefore assumed to be higher than this first test year which later on was<br />
confirmed.<br />
In contrast to the design calculations, the methane reactor produced less gas than the hydrolysis<br />
reactor. The methane reactor generated <strong>in</strong> average the first period 34 vol % and <strong>in</strong> the second period<br />
11 vol % of the methane. This <strong>in</strong>dicates that the process management has to be improved <strong>in</strong> such a<br />
way that the load rate of the second reactor is <strong>in</strong>creased (Schäfer, Lehto and Teye 2006).<br />
Figure 7. Material flow diagram the methan gas generation, methan gas compressor store, and<br />
effluent store marked.<br />
Figure 8. Picture <strong>with</strong> the <strong>in</strong>side of the biogas reactor, elements for the bacteria, store sack and the<br />
slurry store.<br />
9
Figure 9. Observed biogas yield, mean day temperature, total observed cumulative methane yield<br />
and divided <strong>in</strong> the <strong>production</strong> from the methane reactor and from the hydrolysis reactor (Schäfer,<br />
Lehto and Teye 2006.<br />
The farm<br />
Geographic localisation and climatic conditions<br />
The Skilleby-Ytterenby <strong>Farm</strong> is recently two farms, Skilleby and Yttereneby but nowadays<br />
runn<strong>in</strong>g as one unit. The field experiment is from 1991 established on the Skilleby but the<br />
biogas plant is connected to the common cow born. The farm is situated 50 km south of<br />
Stockholm, on a clay soil <strong>in</strong> eastern Sörmland (Figure 10) <strong>with</strong> a north latitude 59 o 30´ , height<br />
above the sea level 30-40 metres, annual average precipitation 590 mm, yearly average<br />
temperature 6,2 o C and 6-8 snow free months (Figure 2). The topsoil is generally frozen 3-4<br />
months <strong>in</strong> the year (December – March). The weather condition is presented <strong>in</strong> more detail for<br />
the experiment period <strong>in</strong> Supplement 1. The Skilleby experimental farm <strong>in</strong>clude 42 ha arable<br />
land which are collected together on each side of a small water way which after some<br />
kilometres south east of the farm are end<strong>in</strong>g <strong>in</strong> the Stafbofjärden <strong>in</strong> the Baltic Sea. From the<br />
year 2002 is the farm work<strong>in</strong>g as a part of Yttereneby farm and together is Skilleby work<strong>in</strong>g<br />
as one unit on 137 ha <strong>with</strong> the same five years crop rotation on each of the two farms and<br />
distribut<strong>in</strong>g the <strong>manure</strong> on each of the farms until 2010.<br />
10
The Biodynamic Research Institute<br />
A<br />
B<br />
Figure 10. Localisation of the Skilleby long term trial <strong>in</strong> east Central Sweden, at latitude 59 o<br />
North and longitude 18 o East, 30 – 40 m above sea level.<br />
Soil conditions<br />
The soils are composed ma<strong>in</strong>ly of clay loam <strong>with</strong> a humus content between 2,8 and 4,2 %, a<br />
large proportion of silt predisposes them to crust formation. The soil under topsoil depth is<br />
stratified, <strong>with</strong> glacial clay at the bottom. The natural history for this soil formation is given <strong>in</strong><br />
figure 11 where we can recognise that the top soil <strong>with</strong> the secondary sort<strong>in</strong>g of the soil<br />
texture fractions (post glacial clay, loam and silt. The glacial clay is near to the topsoil <strong>in</strong><br />
elevated areas whereas <strong>in</strong> the more low-ly<strong>in</strong>g areas the clay content is lower and the soils dry<br />
out more quickly dur<strong>in</strong>g spr<strong>in</strong>g. This geological background where most of younger fossil<br />
sediments was erode dur<strong>in</strong>g ice time, and the sediment clay is based on ma<strong>in</strong>ly primary rocks<br />
that the soil is good <strong>in</strong> potassium, low <strong>in</strong> phosphorus.<br />
Samples from the soils were taken and analysed concern<strong>in</strong>g their chemical and biological<br />
properties C tot, N tot, pH, P-Al, K-AL, Ca-Al, Mg.AL on each plot <strong>in</strong> the experimental field<br />
blocks <strong>in</strong> top soil (0 – 20 cm) and additional samples on 30 – 60 cm and 60-90 cm <strong>in</strong><br />
underground from the start of the long term field experiment 1991 and then each five year<br />
crop rotation period and of special <strong>in</strong>terest for the evaluation of the biogas <strong>manure</strong> effects on<br />
soil on HV1 (2006), HV2 (2007), HV 5 (2008), HV 3 (2009) and HV 4 (2010). The P-Al<br />
values <strong>in</strong> top soil are ma<strong>in</strong>ly between 2 – 3 and the K-Al between the values between 10 – 15<br />
mg <strong>in</strong> 100 g soil and pH values between 5,5 -6,0 accord<strong>in</strong>g the figures presented from HV1<br />
and HV2 <strong>in</strong> Supplement 2.<br />
11
The Biodynamic Research Institute<br />
Natural history<br />
In Sweden most arable land is found<br />
where there are sedimentary soil types<br />
below the high coast- l<strong>in</strong>e after last ice<br />
time 10 000 years ago..<br />
Map <strong>with</strong> simplified high coastl<strong>in</strong>e<br />
(HK), Area above the HK<br />
and under the HK.<br />
Figure 11. The soils are postglacial sedimentary clay and loam <strong>with</strong> low humus content <strong>in</strong> the<br />
lower parts mixed <strong>with</strong> some mud clay<br />
The Biodynamic Research Institute<br />
Granstedt, A., L-Baeckström, G.( 2000): Studies of<br />
the preced<strong>in</strong>g crop effect of ley <strong>in</strong> ecological<br />
agriculture. American Journal of Alternative<br />
Agriculture, vol. 15, no. 2, pages 68–78. Wash<strong>in</strong>gton<br />
University.<br />
Figure 12. The focus <strong>with</strong><strong>in</strong> the Skilleby long term trial is to study how soil fertility and food<br />
quality is effected by <strong>manure</strong> managements regimes and soil treatments. Between 1991 and<br />
12
1996 a special study compar<strong>in</strong>g the effects on different durations of ley and the effects of the<br />
preced<strong>in</strong>g crop (Granstedt and Baeckström, 2000)<br />
Crops, fodder <strong>production</strong>, animal husbandry, <strong>manure</strong> and plant nutrient recycl<strong>in</strong>g<br />
The distribution of crops and animal husbandry is exemplified for 1997 is presented <strong>in</strong> figure<br />
13. The animal husbandry consist of milk and meat <strong>production</strong> adapted to the own fodder<br />
<strong>production</strong> on 84 % of the total area (Granstedt, 2000). Total 16 % of the area is used for<br />
human food crops. The <strong>in</strong>put of nitrogen is based on the biological nitrogen fixation ma<strong>in</strong>ly <strong>in</strong><br />
the first and second year clover grass crops. The proceed<strong>in</strong>g crops effect and long term crop<br />
rotation effect of clover grass on Skilleby farm was studied dur<strong>in</strong>g 1991 to 1995 and<br />
published of Granstedt and L-Baeckström (2000). The plant nutrients <strong>in</strong> the harvested field<br />
crops are ma<strong>in</strong>ly recycled trough the <strong>manure</strong> and liquid <strong>manure</strong>. The total animal density is 0,<br />
7 animal unit per ha produc<strong>in</strong>g average 250 tonnes of stable <strong>manure</strong> and 180 tonnes of liquid<br />
<strong>manure</strong>. The plant nutrient recycl<strong>in</strong>g is presented <strong>in</strong> figure 7 (Granstedt et al 2008).<br />
Example of Ecological Recycl<strong>in</strong>g Agriculture / ERA<br />
The prototype farm<br />
Yttereneby –<br />
Skilleby <strong>in</strong> Järna)<br />
•The animal density is<br />
adjusted to the farm’s<br />
feed <strong>production</strong><br />
capacity. In this case<br />
fodder crops on 84 %<br />
and crops for sale on<br />
16 % of the farm area<br />
and <strong>with</strong> a animal<br />
density of 0,6 AU/ha<br />
(= average for Sweden<br />
and European food<br />
consumption)<br />
7/8/2011 AG<br />
Yttereneby and Skilleby 2003<br />
Import---> Recycl<strong>in</strong>g Export<br />
Feed Herd: Milk<br />
Seed 47 cows Meat products<br />
39 heifers<br />
10 calves<br />
29 sheep<br />
0,6 AU / ha<br />
Own feed>84% of the area{<br />
450 m 3 ur<strong>in</strong>e + 600 m 3 <strong>manure</strong><br />
+dung/ur<strong>in</strong>e pasture<br />
Ley (grass<br />
land)<br />
47%<br />
Bred gra<strong>in</strong><br />
15%<br />
Pasture<br />
21%<br />
Feed gra<strong>in</strong><br />
15<br />
%<br />
<strong>Biogas</strong><br />
Veget.<br />
Root crops<br />
1,5%<br />
0,5%<br />
Bread<br />
gra<strong>in</strong><br />
Arable land ha Crop rotation<br />
Crop rotation 106 Year 1 Spr<strong>in</strong>g cerals + <strong>in</strong>sow<strong>in</strong>g<br />
Pasture 29 2 Ley I<br />
Vegetable -<br />
3 Ley II<br />
root croops 2 4 Ley III<br />
Total 137 5 W<strong>in</strong>ter cerals<br />
Natural pasture 25<br />
Figure 13. Fodder food crops, and animal <strong>production</strong> and recycl<strong>in</strong>g of <strong>solid</strong> and liquid<br />
<strong>manure</strong> (ur<strong>in</strong>e) on Skilleby - Yttereneby farm. .<br />
13
.<br />
Crop rotation<br />
When it started <strong>in</strong> 1967 this biodynamic farm had a seven year crop rotation <strong>with</strong> two and<br />
sometimes three years of clover grass leys followed by bread gra<strong>in</strong>, oats, green fodder and<br />
bread gra<strong>in</strong> <strong>with</strong> oats or barley sown <strong>in</strong>. The nutrient management on Skilleby <strong>with</strong> special<br />
focus on nitrogen is well documented <strong>in</strong> a doctor's thesis by Granstedt (1990 and 1992).<br />
From 1991, when the long-term field experiment was <strong>in</strong>itiated, a new five year crop rotation<br />
was established and followed until today:<br />
1) oats <strong>with</strong> under sow<strong>in</strong>g of clover grass<br />
2) clover grass ley I<br />
3) clover grass ley II (support of liquid <strong>manure</strong>)<br />
4) Clover grass ley III (only one cut before cultivation, application of farm yard<br />
<strong>manure</strong> and sow<strong>in</strong>g of w<strong>in</strong>ter wheat.)<br />
5) w<strong>in</strong>ter wheat (<strong>with</strong> additional support of liquid <strong>manure</strong> some years).<br />
This crop rotation was designed to improve the humus content and soil fertility.<br />
The effects of applications of non-composted and composted <strong>manure</strong> were studied, <strong>with</strong> and<br />
<strong>with</strong>out biodynamic preparation treatments, at three levels of application (12.5, 25 and 50 tons<br />
per ha 1991-1995 and 0, 25 and 50 tons per ha 1996-2008). This resulted <strong>in</strong> 12 treatments all<br />
together and <strong>with</strong> 2 – 4 replications of each treatment. The trial was established on each of<br />
the five fields <strong>in</strong> the crop rotation on Skilleby farm. From 2003 – 2010 <strong>manure</strong> from the<br />
biogas plant was used as stable <strong>manure</strong> and special studies to compare the <strong>manure</strong> from the<br />
biogas plant and <strong>manure</strong> direct from Nibble farm <strong>with</strong> no biogas treatment but both<br />
composted and non-composted were carried out between 2006 – 2010. The results of nutrient<br />
content analysis <strong>in</strong> the <strong>manure</strong> for the years 2006 and 2007 area presented <strong>in</strong> Table 1 and<br />
Table 2.<br />
14
Design of field trial<br />
The Biodynamic Research Institute<br />
Rotation Skilleby experimental<br />
farm<br />
1. Summer crop + <strong>in</strong>s<br />
2. Ley I<br />
3. Ley II<br />
4. Ley III<br />
5. W. wheat<br />
<strong>Farm</strong> own <strong>manure</strong> (0.6 au/ha)<br />
<strong>On</strong> farm long term experiment from<br />
1991<br />
- non-composted and composted<br />
<strong>manure</strong><br />
- <strong>with</strong> and <strong>with</strong>out biodynamic<br />
preparation (split plot design)<br />
- three levels: 12.5 (0), 25 (normal)<br />
and 50 tons per ha)<br />
- 2 – 4 replicates on the five rotation<br />
fields<br />
Figure 14. The field trials are located on representative spots <strong>in</strong> each field start<strong>in</strong>g <strong>with</strong> w<strong>in</strong>ter<br />
wheat <strong>in</strong> the autumn 1991 on field number one. The follow<strong>in</strong>g year w<strong>in</strong>ter wheat was sown on<br />
field number 2 and so on until 1995 when the trial plots were established on the last field,<br />
number 5.<br />
The Biodynamic Research Institute<br />
Skilleby long-term trial started <strong>in</strong> 1991 and still cont<strong>in</strong>u<strong>in</strong>g<br />
Experimental plan from 1991<br />
Treatments w<strong>in</strong>ter wheat<br />
Ma<strong>in</strong> plot<br />
F1<br />
Not composted <strong>manure</strong> 12.5 ton ( 0 from 1995)<br />
F2<br />
F3<br />
K1<br />
K2<br />
K3<br />
Subplots +<br />
25 ton<br />
50 ton<br />
Composted <strong>manure</strong> 12.5 ton ( 0 from 1995)<br />
25 ton<br />
50 ton<br />
BD preparation each plot each year<br />
-<br />
Without BD preparation<br />
Figure 15. Field trial implementation and the experiment design.<br />
15
Manure<br />
Table 1. Nutrient content analysis of fresh, stored (not composted) and composted <strong>manure</strong><br />
2006.<br />
Table 2. Nutrient content analysis of fresh, stored (not composted) and composted <strong>manure</strong><br />
2007<br />
Manure Skilleby field experiment 2007<br />
<strong>Farm</strong>treatment Yttereneby BG Nibble Nibble<br />
Manure tetment Comp. +BDP Comp. -BDP Comp +BD Comp -BD Not comp.<br />
Dry matter % 24,0 24,2 31,7 27,9 21,7<br />
Tot N, kg ton -1 6,9 6,5 8,1 7,8 6,3<br />
Organic Nton -1 6,0 6,3 7,3 7,4 5,4<br />
NH 4 Nton -1 0,89 0,18 0,84 0,36 0,85<br />
Tot P, kg ton -1 1,19 1,38 1,64 1,93 1,43<br />
Tot K, kg ton -1 7,19 9,64 7,85 12,89 9,79<br />
Tot Mg, kg ton -1 1,42 1,61 1,86 2,10 1,55<br />
Tot Ca, kg ton -1 4,8 4,2 5,5 5,3 3,9<br />
Tot Na, kg ton -1 0,5 0,4 0,5 0,6 0,5<br />
Tot C, kg ton -1 71 61 116 61 59<br />
C/N 11,8 9,3 14,3 7,9 9,4<br />
Tot S, kg ton -1 0,89 0,99 1,00 1,20 0,96<br />
This field experiment compares <strong>manure</strong> from the biogas plant on Yttereneby and <strong>manure</strong> from<br />
the reference farm Nibble. The neighbour<strong>in</strong>g Nibble farm has the same crop rotation and<br />
animal <strong>production</strong>, the same type of <strong>solid</strong> <strong>manure</strong> <strong>production</strong> similar soil conditions and<br />
productivity as the experimental farm. Fresh and composted <strong>manure</strong> from Nibble reference<br />
farm (NM) was used and compared <strong>with</strong> THE FRESH AND COMPOSTED <strong>manure</strong> from<br />
the Yttereneby fermented biogas plant (BGM). The nutrient content of the different <strong>manure</strong><br />
16
fractions from 2006 and 2007 are presented <strong>in</strong> Table 1 and Table 2. The pr<strong>in</strong>cipal differences<br />
<strong>in</strong> the compost<strong>in</strong>g process between the two types of <strong>manure</strong> (BGM and NM) is reflected <strong>in</strong><br />
the temperatures reached dur<strong>in</strong>g the compost process. See Figure 16. The temperature<br />
<strong>in</strong>creased only 10 degrees <strong>in</strong> the processed <strong>manure</strong> from the <strong>Biogas</strong> plant but <strong>in</strong> the <strong>manure</strong><br />
from Nibble farm the temperature <strong>in</strong>creased <strong>with</strong> 25 o C <strong>in</strong> the treatment <strong>with</strong>out the<br />
biodynamic preparation (No BD) and <strong>with</strong> 35 o C <strong>in</strong> the treatment <strong>with</strong> the biodynamic<br />
preparation (BD).<br />
o C<br />
70<br />
60<br />
50<br />
40<br />
30<br />
20<br />
10<br />
0<br />
2007-05-15<br />
2007-05-17<br />
2007-05-19<br />
2007-05-21<br />
2007-05-23<br />
2007-05-25<br />
2007-05-27<br />
2007-05-29<br />
2007-05-31<br />
2007-06-02<br />
<strong>Biogas</strong> <strong>manure</strong><br />
BD<br />
<strong>Biogas</strong> Manure<br />
No BD<br />
Nibble <strong>manure</strong><br />
BD<br />
Nibble <strong>manure</strong><br />
No BD<br />
Figure 16. Temperature 30 cm deep <strong>in</strong> the <strong>manure</strong> compost heaps from Nibble farm (NM) and<br />
from the biogas plant (BGM) between 15 th May and 2 nd June 2007. The picture shows over<br />
the four covered heaps on the experimental field : biogas <strong>manure</strong> <strong>with</strong> and <strong>with</strong>out<br />
biodynamic preparations BGM/BP and BGM/no BDP, and Nibble <strong>manure</strong> <strong>with</strong> and <strong>with</strong>out<br />
biodynamic preparations NM/ BD and NM/ no BD.<br />
Nutrient flow through the biogas plant<br />
Dur<strong>in</strong>g 2006 and 2007 fractions of <strong>solid</strong> and liquid <strong>manure</strong> samples from 4 stages <strong>in</strong> the the<br />
biogas plant process and two from the compost<strong>in</strong>g process were collected and analysed (Table<br />
3). These were compared <strong>with</strong> comparable <strong>manure</strong> fractions from the biodynamic reference<br />
farm Nibble (Table 1 and 2) before and after the compost<strong>in</strong>g process end<strong>in</strong>g <strong>in</strong> 2006. The<br />
effects of these differences, <strong>in</strong>clud<strong>in</strong>g the different levels of available nutrients and <strong>organic</strong><br />
biomass were studied <strong>in</strong> field trials 2007 and then also 2009 and 2010.<br />
17
Table 3. Biomass and nutrient contents <strong>in</strong> <strong>manure</strong> fractions at different stages: <strong>in</strong>put (faeces<br />
+ straw) to hydrolysis reactor , the separated <strong>solid</strong> fraction output from the hydrolysis reactor,<br />
the separated liquid fraction from the hydrolysis reactor = <strong>in</strong>put to methane reactor, output<br />
from the methane reactor for use as liquid <strong>manure</strong>, 5 - <strong>solid</strong> <strong>manure</strong> discharge after stor<strong>in</strong>g<br />
and before compost<strong>in</strong>g, and 6 the <strong>solid</strong> <strong>manure</strong> discharge after compost<strong>in</strong>g.<br />
Stage 1-4 <strong>in</strong> Yttereneby biogas plant<br />
Stage 5 - 6 field treatment<br />
<strong>Farm</strong> treatmentStable <strong>manure</strong> Liquid fraction Yttereneby stable BG FYM 2006<br />
Manure tetment Input Output Input Output BG plant 26 May CM BG 26 sept<br />
Dry matter % 29,0 17,7 5,9 6,9 23,5 28,4<br />
C tot , kg ton -1 141 84 2,6 3,2 93,6 95,9<br />
N tot , kg ton -1 5,0 5,6 3,9 3,5 6,2 8,2<br />
C/N 28,2 15,0 0,7 0,9 15,0 11,7<br />
Organic N ton -1 2,1 2,9 0,9 1,0 5,8 8,1<br />
NO 3 N ton -1 1,90 1,70 1,30 1,70<br />
NH 4 N ton -1 0,97 1,00 1,70 0,84 0,4 0,1<br />
P tot , kg ton -1 0,94 1,15 0,60 0,82 1,0 1,5<br />
Rest Tot C 68,66 2,34 Rest Tot C 64,01<br />
C gas prod. 69,74 0,26 C CO2 losses 29,63<br />
Gas prod % 49,46 9,94 Loss % 31,64<br />
Rest N tot 4,58 2,56 Rest N tot 5,47<br />
N tot loss 0,42 1,34 N tot loss 0,77<br />
Loss % 8,45 34,33 Loss % 12,35<br />
Quanties t d -1 2,2 1,05 1,1 1,1 1,05 0,72<br />
Quanties t y -1 660 315 330 330 315 215<br />
Analysis<br />
The analysis have been done by the agricultural laboratory, Agrilab, Ullsväg 33, 756 51<br />
Uppsala.<br />
Calculation<br />
The change and possible <strong>in</strong>crease or reduction of carbon and humus content (C % units? What<br />
are these – they are not shown on the chart) is <strong>in</strong> this study evaluated through<br />
calculation of the differences <strong>in</strong> total carbon content between the study years.<br />
18
Mass balance calculations for losses of nitrogen and carbon and the theoretically calculated<br />
<strong>production</strong> of biogas are based on Ptot content assum<strong>in</strong>g no losses of P <strong>in</strong> the aerobic<br />
and anaerobic treatments of the <strong>manure</strong> and on homogeny and representative samples<br />
of <strong>manure</strong>.<br />
Results<br />
Production of biogas and net <strong>production</strong> of renewable energy<br />
The observed <strong>production</strong> of biogas dur<strong>in</strong>g the first test period between November 2003 and<br />
May 2004 is shown <strong>in</strong> Figure 9 and dur<strong>in</strong>g the period April 2005 – May 2006 <strong>in</strong> Figure 17.<br />
The latter show an average gas <strong>production</strong> of 50 m 3 (500 kWh) and a potential of 70 - 90 m 3<br />
d -1 ( 700 – 900 kWh). The potential exchange also confirmed dur<strong>in</strong>g laboratory conditions<br />
was about50 % of total carbon <strong>in</strong> the <strong>manure</strong> (Figure 18). The accumulated <strong>production</strong> dur<strong>in</strong>g<br />
one year was 18 644 m 3 but <strong>with</strong> a documented potential to produce 29 000 m 3 . The overall<br />
energy use for the biogas plant was documented at 238 kWh d -1 accord<strong>in</strong>g the observed data<br />
the first year (Schäfer, Lehto and Teye, 2006). The energy <strong>in</strong>put demand depends on the<br />
temperature and the mass of <strong>in</strong>put material, the environmental daily mean temperature , the<br />
w<strong>in</strong>d speed and the amount of heat energy for heat<strong>in</strong>g the <strong>in</strong>put material. The daily <strong>manure</strong><br />
dur<strong>in</strong>g w<strong>in</strong>ter time (200 daysyear -1 ) was 2 m 3 d -1 . With an additional 0,5 m 3 d -1 food residues<br />
from the kitchen at the ecological hospital Widarkl<strong>in</strong>iken and an improvement of the<br />
hydrolysis reactor's isolation the <strong>production</strong> of biogas was stabilised at 70 m 3 d -1 <strong>with</strong> a net<br />
<strong>production</strong> capacity of 500 kWhd -1 . The average use of vehicle fuels on the ecological<br />
recycl<strong>in</strong>g farms has been calculated by the BERAS project to be app. 554 kWhd -1<br />
(Granstedt, et al 2006).<br />
Figure 17. The gas <strong>production</strong> per day dur<strong>in</strong>g April 2005 – May 2006<br />
19
Figure 18. a) Exchange of carbon kg d -1 <strong>in</strong> biogas (figures <strong>in</strong> the diagram) from the output<br />
from cow barn to <strong>manure</strong> application <strong>in</strong> field <strong>in</strong> two stages. <strong>Biogas</strong> hydrolysis for the stable<br />
<strong>manure</strong> is observed to be 50 % of total carbon <strong>in</strong> 1 m 3 <strong>with</strong> a dry matter of 29 % and the<br />
observed f<strong>in</strong>al losses of 22 kg carbon from <strong>in</strong> the follow<strong>in</strong>g compost<strong>in</strong>g process (Skilleby-<br />
Ytterenby. b) Losses (estimated) dur<strong>in</strong>g stor<strong>in</strong>g of <strong>manure</strong> and measured losses dur<strong>in</strong>g the<br />
stor<strong>in</strong>g and f<strong>in</strong>al the compost<strong>in</strong>g process <strong>in</strong> the <strong>manure</strong> system <strong>with</strong>out biogas (Nibble farm).<br />
Nutrient flow through the biogas plant, the farm and the whole farm balance<br />
Dur<strong>in</strong>g 2006 and 2007 samples was collected and analysed from the four stages of biogas<br />
plant process and before and after compost<strong>in</strong>g. The Carbon ( C) and Nitrogen (N) flows were<br />
calculated and compared <strong>with</strong> comparable data from the Nibble farm <strong>manure</strong> fractions<br />
which have not been fermented <strong>in</strong> a biogas plant but are otherwise comparable. (Table 3??)<br />
Figure 19 describes the material and flow on the normal situation <strong>with</strong>out biogas<br />
fermentation based on the <strong>manure</strong> from Nibble farm. (Check Figure 19 – it shows biogas<br />
<strong>manure</strong> not Nibble <strong>manure</strong>!) Figure 20 describes the material and nutrient flow <strong>in</strong> the twostags<br />
dry anaerobic fermentation process on the Yttereneby farm.<br />
The quality and quantity of the <strong>in</strong>itial <strong>manure</strong> <strong>in</strong>put is comparable from both system but the<br />
follow<strong>in</strong>g the differences <strong>manure</strong> treatment systems result <strong>in</strong> differences <strong>in</strong> nutrient losses<br />
that impact crop <strong>production</strong>. Traditional <strong>solid</strong> <strong>manure</strong> management is stored over w<strong>in</strong>ter on a<br />
dung plate dur<strong>in</strong>g which time it is assumed that 15 % of the nitrogen is lost to the<br />
atmosphere (Malgeryd, et al 2002) before the measured nitrogen losses of 29 % (m<strong>in</strong>imum<br />
26% and maximum31%) dur<strong>in</strong>g the aerobic fermentation <strong>in</strong> the compost heap (24 % loss of N<br />
content after w<strong>in</strong>ter storage). This calculated total nitrogen loss of 9 N kg -1 y -1 (39 %) can be<br />
compared <strong>with</strong> the calculated total loss of 4,5 N kg -1 y -1 (19 %). from the two fractions of<br />
<strong>manure</strong> from the biogas plant <strong>manure</strong> system on Yttereneby farm.<br />
20
Manure material and nitrogen flow from cow barn to field <strong>in</strong> dry digestation system<br />
N kg 495 N kg 802 Tot losses of <strong>in</strong>put<br />
N kg ha 4 N kg ha 6 N kg ha 9<br />
% 15 % 24 % of <strong>in</strong>put 39<br />
Input of<br />
<strong>manure</strong> to<br />
hydrolys<br />
reactor 1<br />
Input compost<br />
Output compost<br />
<strong>organic</strong> matter BG <strong>manure</strong> BG <strong>manure</strong><br />
t t t<br />
660 561 312<br />
N kg N kg N kg<br />
3 300 2 805 2 003 Tot <strong>manure</strong><br />
N kg N kg N kg N kg ha 15<br />
24 20 15 % of <strong>in</strong>put 61<br />
Figure 19. Manure and nutrient flow from cow barn via one stage biogas hydrolysis reactor,<br />
w<strong>in</strong>ter storage on dung plate and aerobic compost<strong>in</strong>g from May – September before field<br />
application on w<strong>in</strong>ter wheat <strong>in</strong> the five year crop rotation.<br />
Manure material and nitrogen flow from cow barn to field biogas plant system<br />
N kg 308 N kg 132<br />
N kg ha -1 2 N kg ha -1 1<br />
% 9 % 4 T o t lo sse s<br />
N kg ha -1 5<br />
Inp ut. re a ct. 2 O utp ut re a ct. 2 % 19<br />
liq uid fra ctio n<br />
t<br />
liq uid fra ctio n<br />
330 330<br />
Inp ut o f O utp ut o f N to t kg N to t kg<br />
ma nure to p ro ce sse d 1 287 1 155<br />
hyd ro lys ma nure N t o t kg h a -1 N t o t kg h a -1<br />
re a cto r 1 fro m re a cto r 1 9 8<br />
<strong>organic</strong> matter<br />
<strong>organic</strong> matter<br />
t t N kg 180<br />
660 645 N kg ha -1 1 T o t ma nure<br />
N to t kg N to t kg % 5 N kg ha -1 20<br />
3 300 2993 % 81<br />
N t o t kg h a -1 N t o t kg h a -1 Inp ut co mp o st O utp ut co mp o st<br />
24 22 BG ma nure BG ma nure<br />
t<br />
t<br />
315 215<br />
N to t kg N to t kg<br />
1 763 1 584<br />
N t o t kg h a -1 N t o t kg h a -1<br />
13 12<br />
Figure 20. Manure and nutrient flow from cow barn via two-stage anaerobic process <strong>in</strong><br />
hydrolysis and methane reactor, separate storage of <strong>solid</strong> and liquid fractions dur<strong>in</strong>g w<strong>in</strong>ter<br />
and aerobic compost<strong>in</strong>g of <strong>solid</strong> fraction from May – September before field application on<br />
w<strong>in</strong>ter wheat <strong>in</strong> the five year crop rotation.<br />
The losses of nitrogen from the fresh <strong>manure</strong> is 50 % lower <strong>in</strong> this two-stage process than <strong>in</strong><br />
the traditional system. This has consequences for the whole farm<strong>in</strong>g system due to a lower<br />
total surplus and lower potential emissions of nitrogen accord<strong>in</strong>g to the two nutrient balances.<br />
Figure 21 and Figur 22 show the differences <strong>in</strong> the calculated nutrient balance and flows <strong>in</strong><br />
the system <strong>with</strong> and <strong>with</strong>out the biogas plant on Yttereneby calculated for the same year.<br />
t<br />
21
Flow of N/P/K kg ha -1 <strong>in</strong> the agricultural-ecosystem Yttereneby-Skilleby<br />
Dagf<strong>in</strong>n Reder (0,6 animal unit/ha) farm 2002-2003<br />
Total<br />
Total<br />
<strong>in</strong>put<br />
sale<br />
58 2 3 22 4 5<br />
Agricultural system<br />
Purchase<br />
Vegetable<br />
of feed Sale of cash crops 6 1 1 products<br />
stuffs<br />
3 2 3<br />
Animal<br />
foods<br />
Own feed 72 8 37 16 3 4<br />
Purchase<br />
of seeds Removed Harvest Animal<br />
1 0 0 harvest rema<strong>in</strong>s product.<br />
77 9 38 29 3 15 75 10 40<br />
Crop<br />
106 12 53<br />
Biol N-<br />
Release from<br />
fixation<br />
the animals<br />
45 59 7 36<br />
Manure<br />
Atmosph. Soil<br />
deposition <strong>in</strong><strong>organic</strong> 36 7 36<br />
8 68 10 47 Soil<br />
<strong>organic</strong><br />
Artificial<br />
fertilizer<br />
0 0 0<br />
9 -2 -6 4 0 4 23<br />
Surplus/defecit Field losses Gas<br />
losses from soil<br />
from <strong>manure</strong> losses<br />
Total<br />
surplus/deficit<br />
36 -2 -2<br />
Calculation factors N P K Given figures N P K<br />
Store losses from <strong>manure</strong> 0,4 Purchace to anim. prod. 3 2 3<br />
Field losses from <strong>manure</strong> 0,1 0,05 0,1 Purch. seeds 1 0 0<br />
Fodder/animal <strong>production</strong> 4,6 3,0 10 Biol. N-fix 45<br />
Atmosph. dep. 8<br />
Artificial fertilizer 0<br />
Crop export 5,5 1 1<br />
Export of animal prod. 16 3 4<br />
Calculated values<br />
Own feed 72 8 37<br />
Harvest rema<strong>in</strong> 29 3 15<br />
22
Figure 21. Flow of N/P/K kg ha -1 year -1 <strong>in</strong> the agricultural-ecosystem Yttereneby-Skilleby<br />
farm (137 ha and 0,6 animal unit/ha) 2002-2003 <strong>with</strong>out biogas plant.<br />
23
Flow of N/P/K kg ha -1 <strong>in</strong> the agricultural-ecosystem Yttereneby-Skilleby<br />
Dagf<strong>in</strong>n Reder (137 ha, 0,6 animal unit/ha) farm 2002-2003<br />
after <strong>in</strong>troduction of biogas <strong>production</strong><br />
Total<br />
Total<br />
<strong>in</strong>put<br />
sale<br />
58 2 3 23 4 5<br />
Agricultural system<br />
Purchase<br />
Vegetable<br />
of feed Sale of cash crops 7 1 1 products<br />
stuffs<br />
3 2 3<br />
Animal<br />
foods<br />
Own feed 72 8 37 16 3 4<br />
Purchase<br />
of seeds Removed Harvest Animal<br />
1 0 0 harvest rema<strong>in</strong>s product.<br />
78 9 38 31 3,6 15 75 10 40<br />
Crop<br />
110 13 54<br />
Biol N-<br />
Release from<br />
fixation<br />
the animals<br />
45 59 7 36<br />
Manure<br />
Atmosph. Soil<br />
deposition <strong>in</strong><strong>organic</strong> 40 7 36<br />
8 75 10 47 Soil<br />
<strong>organic</strong><br />
Artificial<br />
fertilizer<br />
0 0 0<br />
12 -2 -6 4 0 4 19<br />
Surplus/defecit Field losses Gas<br />
losses from soil from <strong>manure</strong> losses<br />
Total<br />
surplus/deficit<br />
35 -2 -2<br />
Calculation factors N P K Given figures N P K<br />
Store losses from <strong>manure</strong> 0,33 Purchace to anim. prod. 3 2 3<br />
Field losses from <strong>manure</strong> 0,1 0,05 0,1 Purch. seeds 1 0 0<br />
Fodder/animal <strong>production</strong> 4,6 3,0 10 Biol. N-fix 45<br />
Harvest rema<strong>in</strong>/harvest 0,4 0,4 0,4 Atmosph. dep. 8<br />
Artificial fertilizer 0<br />
Crop export 6,6 1 1<br />
Export of animal prod. 16 3 4<br />
Calculated figures<br />
Own feed 72 8 37<br />
Harvest rema<strong>in</strong> 31 4 15<br />
Gas losses 19<br />
24
Tot C % 0-20 cm<br />
Figure 22. Flow of N/P/K kg ha -1 year -1 <strong>in</strong> the agricultural-ecosystem Yttereneby-Skilleby<br />
farm (137 ha and 0,6 animal unit/ha) 2002-2003 <strong>with</strong> anaerobic fermentation <strong>in</strong> biogas plant.<br />
Field studies<br />
Carbon content <strong>in</strong> soil<br />
See Figure 14 for a description of the 12 different treatments carried out on plots <strong>in</strong> each of<br />
the five crops rotation fields.<br />
The average total carbon content <strong>in</strong> top soil <strong>in</strong>creased on all treatment plots dur<strong>in</strong>g the 14 year<br />
periods <strong>in</strong> HV 1 from 1991 to 2005, <strong>in</strong> HV2 from 1992 to 2006, <strong>in</strong> HV3 from 1993- 2007, <strong>in</strong><br />
HV4 from 1994 to 2008 and <strong>in</strong> HV 5 dur<strong>in</strong>g the 5 years 2002 – 2007 (Figure 23). But a<br />
variation of carbon content result<strong>in</strong>g from the different treatments was also observed.<br />
HV 1 -5<br />
3,000<br />
2,000<br />
1,000<br />
0,000<br />
HV 1 91/05 HV2 92/06 HV3 93/07 HV4 94/08 HV 5 02/07<br />
Year 1 2,117 1,754 2,113 1,824 1,702<br />
Year 2 2,308 1,799 2,165 1,887 1,768<br />
Change 0,191 0,046 0,052 0,062 0,066<br />
Year 1<br />
Year 2<br />
Change<br />
Figure 23. The average total carbon content <strong>in</strong> the top soil and the average <strong>in</strong>crease from<br />
compar<strong>in</strong>g year 1 to year 2 measured <strong>in</strong> the field experiment HV1 (year 1991- 2005), HV2<br />
year 1992 -2006), HV3 (year 1993-2007), HV4 (year 1994-2008) and HV5 (year 2002-2005).<br />
The highest carbon content was measured <strong>in</strong> field HV1 and HV 3 <strong>in</strong> the five year crop<br />
rotation and <strong>in</strong> HV 1 the highest average <strong>in</strong>crease dur<strong>in</strong>g the study period (Figure 23) was<br />
recorded. The total carbon content <strong>in</strong> the soil <strong>in</strong>creased <strong>in</strong> all treatments <strong>in</strong> HV1 from 1991 to<br />
2005 and <strong>in</strong>creased on average between 1,3 and 5% each five-year crop rotation period<br />
(Figure 24).<br />
After 2001 a 5 cm deeper plough<strong>in</strong>g was <strong>in</strong>troduced which expla<strong>in</strong> the lower observed<br />
<strong>in</strong>crease <strong>in</strong> HV2 to HV 4 compare to HV 1 (before change of plough<strong>in</strong>g deep) and HV 5<br />
(after change plough<strong>in</strong>g deep).<br />
25
HV I<br />
C %<br />
top<br />
soil<br />
2,35<br />
2,30<br />
2,25<br />
2,20<br />
2,15<br />
2,10<br />
2,05<br />
2,00<br />
1,95<br />
2,28<br />
2,31<br />
2,16<br />
2,12<br />
1991 1995 2000 2005<br />
Figure 24. Average total carbon <strong>in</strong> top soil <strong>in</strong> all treatments <strong>in</strong> HV 1 1991, 1995, 2000 and<br />
2005. General trend is marked..<br />
Influence of amount of <strong>manure</strong><br />
The <strong>in</strong>fluence of the amount of <strong>manure</strong> applied on total carbon and humus content is possible<br />
to observe by compar<strong>in</strong>g the change of total carbon <strong>in</strong> top soil between the different<br />
treatments (Figure 25).<br />
The average carbon content <strong>in</strong> the soil was higher <strong>in</strong> the treatment us<strong>in</strong>g normal amounts (25<br />
tons per ha) of <strong>manure</strong> for fertilis<strong>in</strong>g compared <strong>with</strong> zero <strong>manure</strong>. In the treatments <strong>with</strong> high<br />
<strong>manure</strong> levels (50 tons per ha) the average carbon and humus content was significantly higher<br />
(104 % higher) than <strong>in</strong> the plots <strong>with</strong> zero application.<br />
26
C % units <strong>in</strong> top soil<br />
HV 1-5<br />
0,12<br />
0,10<br />
0,08<br />
ab<br />
a<br />
ab<br />
0,06<br />
0,04<br />
b<br />
0,02<br />
0,00<br />
All treatments FYM 3 FYM 2 No <strong>manure</strong><br />
HV 1-5 0,08 0,10 0,08 0,03<br />
Figure 25. Change <strong>in</strong> the total amount of carbon <strong>in</strong> the top soil after 3 years of crop rotation<br />
(year 4, 5 and 1) (see Figure 14) , average <strong>in</strong> all treatments, <strong>with</strong> high <strong>manure</strong> (FYM 3),<br />
normal farm <strong>manure</strong> (FYM 2) and no <strong>manure</strong> application. Figure a and b above diagram mark<br />
a significant difference only between FYM 3 and No <strong>manure</strong>.<br />
Influence of composted and not composted <strong>manure</strong><br />
The average carbon content <strong>in</strong>crease was higher <strong>in</strong> HV 1 and HV 5 (P
Cange C % units <strong>in</strong> top soil<br />
Tot-C % units<br />
Change tot-C <strong>in</strong> top soil FM and CM HV 1-5<br />
0,300<br />
0,200<br />
0,100<br />
(b)<br />
(a)<br />
(a)<br />
(b)<br />
0,000<br />
HV 1 HV2 HV3 HV4 HV 5<br />
FM 0,163 0,040 0,047 0,104 0,051<br />
CM 0,219 0,051 0,063 0,070 0,108<br />
Figure 26. Change of total carbon <strong>in</strong> top soil from 1991 - 2005, averages for non-composted<br />
(FM) and composted <strong>manure</strong> (CM).<br />
In HV 1 the total carbon content <strong>in</strong> top soil was studied each year (Figure 27). The carbon<br />
content <strong>in</strong>creased steadily and <strong>with</strong> a higher <strong>in</strong>crease <strong>in</strong> the soils treated <strong>with</strong> composted<br />
<strong>manure</strong>.<br />
HV I<br />
0,25<br />
0,22<br />
0,20<br />
0,15<br />
0,18<br />
0,16 0,16<br />
0,10<br />
0,05<br />
0,00<br />
0,05<br />
0,03<br />
2005<br />
1995 2000 2006<br />
FM<br />
CM<br />
Figure 27. Change of total carbon <strong>in</strong> top soil from 1991 – 1995, 1991 – 2000 and 1991 –<br />
2005, averages for non-composted (FM) and composted <strong>manure</strong> (CM).<br />
28
Tot C % units <strong>in</strong> top soil<br />
Influence of biodynamic preparation on total carbon <strong>in</strong> topsoil<br />
The carbon content <strong>in</strong>creased on average higher <strong>in</strong> HV1 and 5 (P
Tot C % units<br />
Change tot C <strong>in</strong> top soil HV1 CM2<br />
0,400<br />
b<br />
0,300 b<br />
0,200<br />
a<br />
0,100 a<br />
0,000<br />
-0,100<br />
-0,200<br />
Year 91-95 Year 91-00 Year 91-05<br />
- BDP -0,080 0,100 0,078<br />
+BDP 0,231 0,287 0,335<br />
Figure 29. HV1 <strong>with</strong> composted <strong>manure</strong> level of 25 tons per ha (CM2) <strong>with</strong>out a (-BDP) and<br />
<strong>with</strong> b (+BDP) biodynamic preparation treatments.<br />
Influence of <strong>manure</strong> from the biogas plant on total carbon <strong>in</strong> soil<br />
From 2003 <strong>manure</strong> from the biogas plant was used and HV 5 results give a <strong>in</strong>dication of the<br />
higher humus content after use of composted biogas treated <strong>manure</strong> compare <strong>with</strong> noncomposted<br />
<strong>manure</strong>. The same trend was seen on HV 1 but not on HV 2, 3 and 4. <strong>On</strong> HV 5 the<br />
highest humus carbon content and humus formation was observed after use of the biodynamic<br />
treatments (Figure 28). More follow up studies to better understand the factors affect<strong>in</strong>g these<br />
results are needed. For example it would be valuable to study the carbon immobilisation and<br />
humus formation after one more crop rotation and compare <strong>with</strong> treatments us<strong>in</strong>g <strong>manure</strong><br />
from Nibble farm that has not been through the biogas plant.<br />
An <strong>in</strong>crease of total carbon content <strong>in</strong> the deeper soil layers was observed (+ 77 %) after<br />
compar<strong>in</strong>g total carbon <strong>in</strong> seven archive samples from 1991 <strong>with</strong> actual samples from 2009<br />
(Figure 30).<br />
30
Tot C % 60 - 90 cm<br />
0,600<br />
Tot C <strong>in</strong> B-horizon (60-90 cm) HV I<br />
0,400<br />
0,200<br />
0,000<br />
-0,200<br />
FM2<br />
(n=1)<br />
CM1(n=<br />
1)<br />
CM2<br />
(n=2)<br />
CM3<br />
(n=3)<br />
M. s. 1-7<br />
Year 1991 0,320 0,180 0,310 0,200 0,24571<br />
Year 2009 0,310 0,340 0,400 0,413 0,38429<br />
Change -0,010 0,160 0,090 0,213 0,13857<br />
Figure 30. Measured total carbon <strong>in</strong> the deeper soil layer (60 – 90 cm), HV1 1991 and 2009.<br />
Number of earthworms<br />
In 2008 the biomass of earth worms <strong>in</strong> top soil was measured to be between 700 – 1200 kg<br />
per ha and tend to <strong>in</strong>crease on plots <strong>with</strong> <strong>in</strong>creas<strong>in</strong>g amounts of <strong>manure</strong>. Treatment <strong>with</strong> the<br />
biodynamic preparations tended to lower the amount of earth worms when us<strong>in</strong>g fresh stable<br />
<strong>manure</strong> but not when us<strong>in</strong>g composted <strong>manure</strong> (Figure 32). The worm activity measured <strong>in</strong><br />
2006 <strong>in</strong> HV1(counted as worm holes per 30x30 cm square) was significantly higher <strong>in</strong> plots<br />
<strong>with</strong> <strong>in</strong>creas<strong>in</strong>g amounts of <strong>manure</strong> and significantly higher <strong>in</strong> the plots treated <strong>with</strong><br />
biodynamic preparations (Figure 33). In 2009 <strong>in</strong> HV 3 <strong>manure</strong> <strong>with</strong> and <strong>with</strong>out biogas<br />
treatment was used <strong>in</strong> separate plots (Figure 34). Here the worm activity showed tendency to<br />
be lower <strong>in</strong> plots <strong>with</strong> <strong>manure</strong> from the biogas plant.<br />
Figure 31. Field studies for collect<strong>in</strong>g worms <strong>in</strong> soil.<br />
31
kg /ha 0-30 cm<br />
Worms 8-13 October 2008 HV 1 , 1 - 12<br />
1500<br />
1000<br />
500<br />
0<br />
F1- F1+ F2- F2+ F3- F3+ K1- K1+ K2- K2+ K3- K3+<br />
1022 796 929 745 1075 939 858 630 645 711 1075 1208<br />
Figure 32. Total biomass of earth worms, kg/ha, <strong>in</strong> top soil , 0-30 cm. The figure F1- and the<br />
others the same as <strong>in</strong> figure 15.<br />
32
Holes / 30 x 30 cm squere<br />
locks /m2<br />
F2-<br />
F2+<br />
F3-<br />
F3+<br />
K0-<br />
K0+<br />
K2-<br />
K2+<br />
K3-<br />
K3+<br />
Worm activity HV1 2006<br />
80<br />
60<br />
40<br />
20<br />
0<br />
F0-<br />
F0+<br />
Figure 33. Number of holes of earthworms <strong>in</strong> HV1, holes/ 30x30 cm <strong>in</strong> the upper soil, 5 cm<br />
Worm activity HV3 2009<br />
200<br />
150<br />
100<br />
50<br />
b<br />
0<br />
F0+<br />
F2+<br />
F3+<br />
K1+<br />
K2+<br />
F0-<br />
F2-<br />
F3-<br />
K1-<br />
K2-<br />
K3-<br />
K3+<br />
BG treatm.<br />
No BG treatm<br />
Figure 34. Number of holes of earthworms <strong>in</strong> HV3 2009, holes/ 30x30 cm <strong>in</strong> the upper soil, 5<br />
cm<br />
Investigations <strong>in</strong> Wheat 1992-2010<br />
Wheat, ma<strong>in</strong>ly w<strong>in</strong>ter wheat, was grown dur<strong>in</strong>g the whole study period 1991-2010 after<br />
clover grass. The yields on the the different treatment plots <strong>in</strong> HV1, HV2, HV3, HV4 and<br />
HV5 were measured.<br />
33
HV 1<br />
Hv2<br />
HV 3<br />
HV 4<br />
HV 1<br />
HV 2<br />
HV 5<br />
HV 3<br />
HV 4<br />
HV 1<br />
HV 2<br />
HV 5<br />
HV 3<br />
HV 4<br />
HV 1<br />
HV 2<br />
HV 5<br />
HV 3<br />
HV 4<br />
Influence on yields of type of <strong>manure</strong><br />
In 14 of the total of 19 seasons, the yield was higher when composted <strong>manure</strong> was used<br />
compared to non-composted <strong>manure</strong>. by an average of 3, 5 % over the whole period (Figure<br />
35 and Table 4).<br />
Influence on yields of the biodynamic preparations<br />
In plots treated <strong>with</strong> the biodynamic preparations the yields were on average higher <strong>in</strong> 11 of<br />
the 19 seasons, and <strong>in</strong> 5 of these significantly higher (P
1994 HV3 2 803 3 099<br />
1995 HV4 2 204 2 095<br />
1996 HV1 3 527 3 516<br />
1997 HV2 3 050 3 285<br />
1998 HV5 2 971 2 928<br />
1999 HV3 2 774 2 938<br />
2000 HV4 2 739 2 777<br />
2001 HV1 2 980 3 015<br />
2002 HV2 4 694 4 957<br />
2003 HV5 3 949 4 096<br />
2004 HV3 1 715 2 127<br />
2005 HV4 4 211 4 385<br />
2006 HV1 2 887 2 933<br />
2007 HV2 2 984 2 737<br />
2008 HV5 2 559 2 737<br />
2009 HV3 2 455 2 963<br />
2010 HV4 4 426 4 736<br />
6 000<br />
5 000<br />
4 000<br />
3 000<br />
2 000<br />
No B DP<br />
With<br />
B DP<br />
1 000<br />
0<br />
HV 1 Hv2 HV 3 HV 4 HV 1 HV 2 HV 5 HV 3 HV 4 HV 1 HV 2 HV 5 HV 3 HV 4 HV 1 HV 2 HV 5 HV 3 HV 4<br />
Figure 36. Yields of W<strong>in</strong>ter wheat, <strong>in</strong> plots treated <strong>with</strong> compost <strong>with</strong> and <strong>with</strong>out (No BDP)<br />
BD preparations treatments 1992 -2010.<br />
Table 5. Yields of w<strong>in</strong>ter wheat, <strong>in</strong> plots treated <strong>with</strong> compost <strong>with</strong> and <strong>with</strong>out (No BDP) BD<br />
preparations treatments 1992 -2010.<br />
35<br />
With<br />
No BDP BDP<br />
1992 HV1 5 293 5 261
Yield kg/ha<br />
1993 Hv2 2 822 2 898<br />
1994 HV3 2 871 3 028<br />
1995 HV4 2 189 2 110<br />
1996 HV1 3 412 3 631<br />
1997 HV2 3 099 3 237<br />
1998 HV5 2 926 2 973<br />
1999 HV3 2 880 2 832<br />
2000 HV4 2 677 2 839<br />
2001 HV1 2 980 3 015<br />
2002 HV2 4 601 5 049<br />
2003 HV5 4 042 4 003<br />
2004 HV3 2 071 1 900<br />
2005 HV4 4 309 4 287<br />
2006 HV1 2 893 2 927<br />
2007 HV2 2 829 2 892<br />
2008 HV5 2 598 2 698<br />
2009 HV3 2 638 2 718<br />
2010 HV4 4 506 4 655<br />
Average 3 244 3 313<br />
Relative 1,0213<br />
Influence on yields of the amount of <strong>manure</strong><br />
Figure 37 describes the yields of w<strong>in</strong>ter wheat dur<strong>in</strong>g the period 1993 to 2010 for the three<br />
<strong>manure</strong> levels and figure 38 shows the difference between the yield <strong>with</strong> no <strong>manure</strong> (FYM1)<br />
<strong>with</strong> the exception of 1993 -1996 when 12,5 tons of <strong>manure</strong> were applied <strong>in</strong> FYM1to w<strong>in</strong>ter<br />
wheat. FYM2 represents 25 (alternatively 30 tonnes?) per ha and FYM3 50 tonnes per ha.<br />
7 000<br />
6 000<br />
5 000<br />
4 000<br />
3 000<br />
2 000<br />
1 000<br />
0<br />
HV2<br />
1993<br />
HV3<br />
1994<br />
HV4<br />
1995<br />
HV1<br />
1996<br />
HV2<br />
1997<br />
HV5<br />
1998<br />
hv3<br />
1999<br />
HV4<br />
2000<br />
FYM 1 2 600 2 884 2 164 2 585 2 988 2 828 2 544 2 550 2 195 3 419 3 366 2 114 3 914 2 113 2 618 2 684 2 449 4 136<br />
FYM2 2 869 3 154 1961 3 657 3 323 3 021 2 962 2 815 3 289 5 015 3 864 1570 4 540 3 132 2 825 2 620 2 556 4 945<br />
FYM3 2 996 2 994 2 434 4 306 3 193 2 958 3 062 2 892 3 509 6 041 4 295 2 272 4 021 3 485 3 139 2 964 3 029 4 420<br />
Figure 37. Yields of w<strong>in</strong>ter wheat, <strong>in</strong> plots treated <strong>with</strong> low (FYM 1), normal (FYM 2) and<br />
high (FYM 3) level of composted <strong>manure</strong> 1993 - 2010.<br />
The mean yield of 3 445 kg per ha on plots <strong>with</strong> the high <strong>manure</strong> application (FYM 3) was<br />
significantly higher than the yield from plots <strong>with</strong> low <strong>manure</strong> application (FYM1) (P
kg/ha<br />
Yield kg/ha<br />
and the yields from the plots <strong>with</strong> normal <strong>manure</strong> application (FYM 2) show a tendency to be<br />
higher (P
6 000<br />
5 000<br />
4 000<br />
Yield kg/ha<br />
3 000<br />
2 000<br />
1 000<br />
0<br />
Hv2 HV3 HV4 HV1 HV2 HV5 HV3 HV4 HV1 HV2 HV5 HV3 HV4 HV1 HV2 HV5 HV3 HV4<br />
1 993 1 994 1 995 1 996 1 997 1 998 1 999 2 000 2 001 2 002 2 003 2 004 2 005 2 006 2 007 2 008 2 009 2 010<br />
FM 3 003 2 803 2 204 3 527 3 050 2 971 2 774 2 739 2 980 4 694 3 949 1 715 4 211 2 887 2 984 2 559 2 455 4 426<br />
CM 2 716 3 099 2 095 3 516 3 285 2 928 2 938 2 777 3 015 4 957 4 096 2 127 4 385 2 933 2 737 2 737 2 963 4 736<br />
FM<br />
CM<br />
Figure 40. The relation between non-composted (FM) and composted (CM) <strong>manure</strong> and the<br />
yields of w<strong>in</strong>ter wheat 1993 - 2020<br />
Influence on yields of biogas fermentation<br />
From 2003 <strong>manure</strong> from the biogas plant (BGFYM) was used and studied through<br />
comparison studies <strong>with</strong> Nibble <strong>manure</strong> (NFYM) both non-composted (F) and composted (C)<br />
from 2006 to 2010 (Figure 41 and 42). There was no significant difference <strong>in</strong> yield on plots<br />
treated <strong>with</strong> biogas and Nibble <strong>manure</strong> In HV 4 and 5 only the normal <strong>manure</strong> application<br />
(30 kg per ha) was compared (Nibble and biogas <strong>manure</strong>) . In 2006, the first year of this<br />
comparison study, only non-composted <strong>manure</strong> was used <strong>in</strong> the field HV1. The results<br />
showed that both biogas and Nibble composted <strong>manure</strong> gave higher yields than noncomposted<br />
<strong>manure</strong>. The biogas plant produces two fractions of <strong>manure</strong>, one <strong>solid</strong> and one<br />
liquid fraction. Mass balance calculations showed that it was about the same amount of <strong>solid</strong><br />
<strong>manure</strong> produced from the biogas plant as composted biogas <strong>manure</strong> from the compost heap.<br />
The effect on yield of the additional liquid <strong>manure</strong> from biogas plant (BLM) was studied <strong>in</strong><br />
2010 (Figure 43). The addition of 20 m3 BLM per ha to the F2 treatment (30 t per ha of noncomposted<br />
<strong>manure</strong> gave a significantly higher yield of 472 kg ha -1 (+11 %). The addition of<br />
20 m3 BLM to the C2 treatment (30 t per ha of composted <strong>manure</strong>) gave a significantly<br />
38
yield kg/ha<br />
Yield kg / ha<br />
higher yield of 760 kg ha -1 . (16 %). The average nitrogen yield of w<strong>in</strong>ter wheat was 73 and<br />
81,5 kg N ha -1 respectively and gave 13 and 10 kg N ha -1 <strong>in</strong> higher yield respectively (+ 18<br />
and 12 %).<br />
W<strong>in</strong>ter Weat 2006-2010<br />
6 000<br />
5 000<br />
4 000<br />
3 000<br />
2 000<br />
1 000<br />
0<br />
HV1 HV2 HV5 HV3 HV4<br />
2006 2007 2008 2009 2010<br />
F NFYM 2 887 2 938 2 681<br />
F BGFYM 2 930 3 077 2 618<br />
C NFYM 2 845 3 027 3 081 4 509<br />
C BGFYM 2 689 2 737 2 909 4 949<br />
Year<br />
Figure 41. Yield of w<strong>in</strong>ter wheat after treatments <strong>with</strong> Nibble farm yard <strong>manure</strong> (NFYM) and<br />
biogas farm yard <strong>manure</strong> (BGFYM) both non- composted <strong>manure</strong> (F) and composted <strong>manure</strong><br />
(F) dur<strong>in</strong>g the five years 2006 – 2010 on the five years crop rotation on the fields HV1 – HV5<br />
on Skilleby experimental farm.<br />
W<strong>in</strong>ter Wheat 2006-2010<br />
4 000<br />
6 000<br />
W Wheat HV4 2010<br />
kg /<br />
ha<br />
and<br />
year<br />
3 000<br />
2 000<br />
1 000<br />
5 000<br />
4 000<br />
0<br />
1<br />
3 000<br />
F NFYM 2 835<br />
F BGFYM 2 875<br />
C NFYM 3 366<br />
C BGFYM 3 321<br />
2 000<br />
1 000<br />
0<br />
F2<br />
C2<br />
BGM 4 203 4 723<br />
plus BLM 4 675 5 483<br />
39
Figure 42. Average annual yield of w<strong>in</strong>ter<br />
wheat after treatments <strong>with</strong> normal farm<br />
yard <strong>manure</strong> (NFYM) and biogas farm<br />
yard <strong>manure</strong> (BGFYM) used as noncomposted<br />
<strong>manure</strong> (F) and composted<br />
<strong>manure</strong> (C) dur<strong>in</strong>g the five years 2006 –<br />
2010 on the five years crop rotation on<br />
the fields HV1 – HV5 on Skilleby<br />
experimental farm.<br />
Figure 43. The yield of w<strong>in</strong>ter wheat on HV4<br />
2010 <strong>with</strong> regular application (30 t per h<br />
)of non-composted and composted (F2<br />
and C2) biogas farm yard <strong>manure</strong><br />
(BGFYM) and additional application of<br />
20 m 3 biogas liquid <strong>manure</strong> ( BLM) per<br />
ha.<br />
Discussion<br />
Introduction<br />
<strong>On</strong>e hundred years ago agriculture <strong>production</strong> depended on the use of local renewable energy<br />
resources. The farmer used the wood from the forest for heat<strong>in</strong>g and raised horses and oxen<br />
for draft power The farmer was also dependent on maximal recycl<strong>in</strong>g of nutrients and humus<br />
build<strong>in</strong>g <strong>organic</strong> material from <strong>manure</strong> <strong>in</strong> comb<strong>in</strong>ation <strong>with</strong> crop rotations <strong>with</strong> a high share<br />
grasslands to build biomass and biological nitrogen fixation (Granstedt, 1995).<br />
Recent economic developments <strong>in</strong> countries like Sweden have forced a specialisation <strong>in</strong><br />
agriculture <strong>with</strong> <strong>in</strong>creas<strong>in</strong>g areas of arable land under crop <strong>production</strong> <strong>with</strong>out clover and<br />
grass leys and <strong>with</strong>out animal <strong>production</strong> produc<strong>in</strong>g farm yard <strong>manure</strong>. Animal <strong>production</strong> is<br />
on other hand concentrated to a smaller group of specialised animal farms were high surpluses<br />
of nutrients cause dangerous levels of emissions to the environment This highly specialised<br />
agriculture is to a great extent dependent on external <strong>in</strong>puts of both fossil energy and<br />
imported fertilizers fodder as well as a grow<strong>in</strong>g use of pesticides especially <strong>in</strong> simplified crop<br />
rotations <strong>with</strong> low variation.<br />
In a farm<strong>in</strong>g system <strong>with</strong>out animals and leys a reduction of 0,24% per year of the carbon<br />
content <strong>in</strong> the top soil has been observed <strong>On</strong> an average m<strong>in</strong>eral soil this can mean a loss of<br />
about 600 kg C or 1440 kg CO2 per ha and year (Bertilsson, 2010). At the same time the lack<br />
of nutrient recycl<strong>in</strong>g has led to a decrease of trace elements <strong>in</strong> soils.<br />
Ecological recycl<strong>in</strong>g agriculture documented through on farm studies <strong>in</strong> the countries around<br />
the Baltic Sea (Granstedt et al 2008) has shown the potential of the <strong>in</strong>tegration of crop and<br />
animal <strong>production</strong> (where the animal <strong>production</strong> is adapted to the farms own fodder<br />
<strong>production</strong> capacity) to <strong>in</strong>crease the recycl<strong>in</strong>g, reduce use of external resources and reduce<br />
losses of nitrogen and phosphorus compounds to the environment. An additional important<br />
step to realise susta<strong>in</strong>able agriculture based on local resources is the capacity to produce<br />
renewable energy on the farms. Through anaerobic fermentation of <strong>manure</strong> before recycl<strong>in</strong>g<br />
it is possible to produce methane gas for heat<strong>in</strong>g and power for agricultural mach<strong>in</strong>es and<br />
transports.<br />
40
<strong>On</strong>e of the world's first large scale dry anaerobic-digestion on-farm biogas plant is built <strong>in</strong><br />
Järna/Sweden <strong>in</strong> the context of the highly self support<strong>in</strong>g farm organism, Skilleby-Yttereneby<br />
by Biodynamic Research Institute <strong>in</strong> Järna. This on-farm biogas plant employs a new process<br />
technique: Dairy cattle <strong>manure</strong> and <strong>organic</strong> residues orig<strong>in</strong>at<strong>in</strong>g from the farm and the<br />
surround<strong>in</strong>g food process<strong>in</strong>g units are digested <strong>in</strong> two different reactors.<br />
This biogas plant has been evaluated <strong>in</strong> relation to the follow<strong>in</strong>g goals:<br />
1) <strong>Biogas</strong> <strong>production</strong> and energy self-sufficiency at farm level<br />
2) Reduce negative impact to the environment<br />
3) Effective <strong>in</strong>ternal recycl<strong>in</strong>g of plant nutrients and improved crop <strong>production</strong><br />
4) Improved humus content, fertility and long term <strong>production</strong> capacity of soil.<br />
<strong>Biogas</strong> <strong>production</strong> and self sufficiency <strong>with</strong> energy on farm level<br />
The biogas <strong>production</strong> was evaluated dur<strong>in</strong>g the years 2003 – 2009. Dur<strong>in</strong>g optimal<br />
conditions it was possible to convert <strong>in</strong> percent of total carbon close to 50 % of the total<br />
carbon content <strong>in</strong> the 2 m 3 produced <strong>manure</strong> per day (Figure 43).<br />
Gas % of C tot<br />
100 0<br />
90<br />
80<br />
70<br />
60<br />
50100<br />
40<br />
30<br />
20<br />
10<br />
0<br />
19 26<br />
81 74<br />
45<br />
55<br />
Fresh Low Normal High<br />
C <strong>in</strong> CO2 and<br />
CH4<br />
C <strong>in</strong> org. matter<br />
Exchange stages<br />
Figure 43. Exchange of carbon <strong>in</strong> gases of the total carbon content <strong>in</strong> <strong>manure</strong>.<br />
The X axes describe different stages of biogas <strong>production</strong> from the <strong>manure</strong> <strong>in</strong>put to the biogas<br />
plant on Skilleby-Ytterenby farm <strong>in</strong> Järna.<br />
Dur<strong>in</strong>g one year total methane gases <strong>production</strong> was 18 644 m 3 but <strong>with</strong> a documented<br />
potential to produce 29 000 m 3. The <strong>production</strong> capacity of the plant is presented <strong>in</strong> figures 9,<br />
17 and 18. Of this the biogas plant needs energy for heat<strong>in</strong>g the reactors to stabilise the<br />
temperature to the optimal process temperature of 37 degrees C and uses up about 9 000 m 3<br />
dur<strong>in</strong>g one year. With an additional 0,5 m 3 d -1 food residues from kitchens <strong>in</strong> the nearby<br />
41
ecological hospital Widarkl<strong>in</strong>iken and process improvements biogas <strong>production</strong> <strong>in</strong>creased to<br />
more than 70 m 3 d -1 and a net <strong>production</strong> capacity of 500 kWh d -1 . The average use of vehicle<br />
fuels on ecological recycl<strong>in</strong>g farms was <strong>in</strong> the BERAS project calculated to 554 kWh d -1<br />
(Granstedt, et al 2006).<br />
It can be concluded that based on the farms own <strong>manure</strong> it is possible to produce 50 – 100 %<br />
of the farms requirements for the vehicle fuels and that the higher level can be realised if it<br />
possible to add additional carbon sources such as food residues. This energy <strong>production</strong> <strong>in</strong><br />
comb<strong>in</strong>ation <strong>with</strong> biological nitrogen fixation, recycled <strong>manure</strong> and animal <strong>production</strong> based<br />
on the farms own fodder demonstrate how, <strong>with</strong> the help of modern technology, it is possible<br />
to realise a self-sufficient susta<strong>in</strong>able agriculture <strong>production</strong> based on local and renewable<br />
resources.<br />
Reduce negative impact to the environment<br />
The comparison between the conventional <strong>manure</strong> management <strong>with</strong> w<strong>in</strong>ter storage on a<br />
dung plate and compost<strong>in</strong>g (C NFYM) and the biogas <strong>manure</strong> system (C BGFYM) show that<br />
total nitrogen losses can be reduced by half <strong>in</strong> the biogas system from 9 N kg -1 y -1 (39 %) to<br />
4,5 N kg -1 y -1 (19 %). This means that more nitrogen is recycled to the soil. These<br />
calculations confirm the f<strong>in</strong>d<strong>in</strong>gs of Schäfer et al (2008) but <strong>with</strong> the difference that the<br />
reduction of nitrogen losses was 38 % lower <strong>in</strong> the biogas system compare to the previous<br />
<strong>manure</strong> management system on the farm used system. Use of liquid <strong>manure</strong> can give higher<br />
gas emissions compared to use of <strong>solid</strong> <strong>manure</strong> which can reduce the total higher nitrogen<br />
efficiency <strong>in</strong> the biogas system.<br />
The lower nitrogen emissions and higher nitrogen efficiency mean that emissions of NH 4 N<br />
and N 2 O N are reduced <strong>with</strong> about 50 %. However the effect on N 2 O and NO 3 N emissions<br />
from soil after the use of liquid <strong>manure</strong> fraction need further study. In the literature lower<br />
emissions of CH 4 have also been documented.<br />
Effective <strong>in</strong>ternal recycl<strong>in</strong>g of plant nutrients and improved crop <strong>production</strong><br />
The field experiment <strong>with</strong> additional application <strong>in</strong> May of 20 tonnes biogas liquid <strong>manure</strong><br />
ha -1 gave 14 % higher yield of the cash crop w<strong>in</strong>ter wheat (15 % higher N yield) and also a<br />
correspond<strong>in</strong>g <strong>in</strong>crease of crop residues. In the total balance the nitrogen surplus was 35<br />
<strong>in</strong>stead of 36 N kg -1 y -1 thus reduc<strong>in</strong>g the total potential nitrogen emissions from the biogas<br />
plant system compared to the conventional <strong>manure</strong> management system. The higher<br />
<strong>production</strong> of crop residues <strong>with</strong> a high C/N ratio also <strong>in</strong>creases nitrogen immobilisation and<br />
<strong>in</strong> this way also contributes to <strong>in</strong>creased humus content <strong>in</strong> the soil.<br />
Humus content <strong>in</strong> soil, long term fertility and <strong>production</strong> capacity<br />
Carbon balance <strong>in</strong> a susta<strong>in</strong>able system <strong>with</strong> clover grass ley<br />
42
SOM %<br />
Based on data from this study and field experiments <strong>with</strong> clover grass leys on Skilleby<br />
(Granstedt and L-Bäckström, 2000) it has been calculated that a three-year clover grass ley<br />
<strong>with</strong> an annual nitrogen fixation between 100 – 200 kg N ha-1 can result <strong>in</strong> the net<br />
assimilation of 18 tons of carbon <strong>in</strong> biomass which is then go<strong>in</strong>g to the soil <strong>organic</strong> matter<br />
formation process both directly from crop residues and roots and <strong>in</strong>directly through recycled<br />
<strong>manure</strong> and food residues. The effect of grassland leys <strong>in</strong> different years is exemplified <strong>in</strong><br />
Figure 45.<br />
Soil Organic Matter <strong>in</strong> topsoil as a fuction by ley<br />
8<br />
7<br />
6<br />
5<br />
4<br />
3<br />
2<br />
1<br />
0<br />
0 2 3 5<br />
Number of leys <strong>in</strong> 6 years crop rotation<br />
Silt loam<br />
Silt loam<br />
Till clay<br />
Soil Organic Matter = SOM <strong>in</strong> top soil after three rotations <strong>in</strong> North Sweden (Persson, 1994)<br />
Figure 45. Soil <strong>organic</strong> matter after three crop rotations <strong>with</strong> different numbers of leys <strong>in</strong> the 6<br />
years crop rotation (Persson, 1994)<br />
Previous experiment<br />
In the thirty-two year long K-experiment (1958 – 1990) the treatments <strong>with</strong> <strong>organic</strong> <strong>manure</strong><br />
comb<strong>in</strong>ed <strong>with</strong> the clover/grass ley gave a clear <strong>in</strong>crease of <strong>organic</strong> carbon <strong>in</strong> the topsoil<br />
compared <strong>with</strong> no use of <strong>organic</strong> <strong>manure</strong> (Reents, Pettersson & Wist<strong>in</strong>ghausen, 1992). The<br />
m<strong>in</strong>eral fertilized treatments and the unfertilized treatment gave no <strong>in</strong>crease of the carbon and<br />
humus content despite the <strong>in</strong>clusion of leys <strong>in</strong> the crop rotation. The total amount of <strong>organic</strong><br />
carbon to a depth of 60 cm, after <strong>in</strong>terpolation of the humus content <strong>in</strong> the soil layers between<br />
them, was calculated to an annual average <strong>in</strong>crease of <strong>organic</strong> carbon <strong>in</strong> the order of 800 kg<br />
per ha <strong>in</strong> the biodynamic treatment (Granstedt and Kjellenberg, 2008). This amount is<br />
comparable to what is reported from the renowned Rhodale long term experiment from 1981<br />
to 2005 <strong>in</strong> Pennsylvania <strong>in</strong> USA <strong>in</strong> a more legume based farm<strong>in</strong>g system <strong>with</strong> farm yard<br />
<strong>manure</strong>, Soya beans and clover/grass ley (Hepperly, Douds & Seidel, 2006) and correspond<br />
<strong>with</strong> the DOK experiment <strong>in</strong> Switzerland where the effect of biodynamic (BD) preparation<br />
and composted <strong>manure</strong> are also reported (Mäder et al, 2002).<br />
In a study compar<strong>in</strong>g biodynamic and conventional cultivation, the UJ-experiment (1971-<br />
1979), it was possible to analyse the importance of leys <strong>in</strong> each system (Pettersson, 1982).<br />
The humus concentration <strong>in</strong> the biodynamic trial B2 <strong>with</strong> ley <strong>in</strong>creased from 2.72% to 3.06%<br />
(1.58 to 1,77 % C-org) dur<strong>in</strong>g the 8-year trial period (slightly more than 10%) while the<br />
43
Corg - % 0-20cm<br />
humus content rema<strong>in</strong>ed at the same level <strong>in</strong> the trial <strong>with</strong> conventional cultivation A1<br />
<strong>with</strong>out leys (Figure 46).<br />
1,8<br />
1,75<br />
1,7<br />
Soil Organic Carbon Järna experiment<br />
L+FYM<br />
B2<br />
B1<br />
A2<br />
A1<br />
1,65<br />
1,6<br />
1,55<br />
L+M<strong>in</strong>F<br />
FYM<br />
M<strong>in</strong><br />
1,5<br />
1,45<br />
1971 1973 1976 1979<br />
Figure 46. Trials compar<strong>in</strong>g biodynamic and conventional cultivation <strong>in</strong> Järna 1971 – 1979. (<br />
L – ley, M<strong>in</strong>F – m<strong>in</strong>eral fertiliser and FYM – farmyard <strong>manure</strong>)<br />
In these trials the importance of leys and <strong>organic</strong> fertilizer for the assimilation of <strong>organic</strong><br />
carbon and the build<strong>in</strong>g up and ma<strong>in</strong>tenance of the humus content <strong>in</strong> the soil and <strong>with</strong> this the<br />
associated biological soil properties is apparent (Dlouhý 1981, Pettersson, 1982, Granstedt<br />
and Kjellenberg 1999).<br />
Dur<strong>in</strong>g the 15 years from 1991 to 2005the total carbon <strong>in</strong>creased on average from 2.12 to<br />
2.31 % <strong>in</strong> top soil on field experiment HV1 on Skilleby. Despite a change to deeper plough<strong>in</strong>g<br />
before sow<strong>in</strong>g w<strong>in</strong>ter wheat it was possible to observe an <strong>in</strong>crease of <strong>organic</strong> carbon content<br />
and formation of soil <strong>organic</strong> matter on all fields HV1 – HV 5 and the significantly higher<br />
<strong>in</strong>crease for the <strong>manure</strong> treatment compared the no <strong>manure</strong> treatments for all fields together is<br />
presented <strong>in</strong> Figure 25. The significant average <strong>in</strong>crease <strong>in</strong> the 20 cm topsoil on HV 1 field<br />
was calculated to 5 725 kg C ha -1 from 63 500 to 69 225 kg C ha -1 assumimng3000 tonnes<br />
top soil per ha (1 % carbon = 30 000kg). This <strong>in</strong>crease of carbon <strong>in</strong> soil through formation of<br />
44
soil <strong>organic</strong> biomass (SOM) is <strong>in</strong> accordance <strong>with</strong> the f<strong>in</strong>d<strong>in</strong>gs of earlier studies referred to<br />
above<br />
Influence of compost<strong>in</strong>g and use of Biodynamic treatments<br />
In the Swiss DOK trials <strong>in</strong> FiBL which compared biodynamic, <strong>organic</strong> and conventional<br />
treatments the humus content (SOM) was, after 20 years <strong>in</strong> conventional farm<strong>in</strong>g 2, 8 % , <strong>in</strong><br />
<strong>organic</strong> farm<strong>in</strong>g <strong>with</strong> <strong>organic</strong> <strong>manure</strong> 3,15 % and <strong>in</strong> biodynamic (BD) treatment 3,65 %<br />
(Mäder et al, 2002). The separate effect of the compost<strong>in</strong>g process and the BD effect was not<br />
studied. In the Järna study (HV1 <strong>in</strong> Figure 27) composted <strong>manure</strong> gave a 10,3 % <strong>in</strong>crease of<br />
the <strong>organic</strong> carbon dur<strong>in</strong>g 14 years (1991 -2005) compare to non-composted <strong>manure</strong>'s 7,3 % -<br />
(34 % higher effect). The BD treatments gave an significant higher <strong>in</strong>crease of compare to no<br />
BD on the <strong>organic</strong> carbon and SOM <strong>in</strong> HV 1 (Figure 29) and HV 5 (Figure 28). This results<br />
correspond to results <strong>in</strong> the long term study <strong>in</strong> Darmstadt, Germany (Abele, 1987) but should<br />
need further studies for understand<strong>in</strong>g how this is possible.<br />
Influence of amount of <strong>manure</strong>, compost<strong>in</strong>g on soil fertility and plant nutrient managements.<br />
The total amount of worms were calculated to be more than 1000 kg biomass per ha for trial<br />
plots <strong>with</strong> high (50 kg) applications of composted <strong>manure</strong> <strong>in</strong> HV1. The samples were taken<br />
over a rather long time period due to variable weather conditions. Clearer differences were<br />
seen between treatments from the count<strong>in</strong>g of worm locks which gave a significant higher<br />
<strong>in</strong>dication of worm activity <strong>in</strong> plots <strong>with</strong> higher <strong>manure</strong> application and also an effect of BD<br />
treatments. The high density of worms is one important factor expla<strong>in</strong><strong>in</strong>g the fact that, despite<br />
the net export of plant nutrients, there was no decrease of soluble nutrient contents <strong>in</strong> soils and<br />
<strong>in</strong> some cases and <strong>in</strong>crease dur<strong>in</strong>g the project time.<br />
Influence of the amount of <strong>manure</strong> and compost<strong>in</strong>g <strong>manure</strong> on yield of w<strong>in</strong>ter wheat.<br />
The average yield on the normal (25 – 30 t per ha) <strong>manure</strong> level FYM 2 (composted and not<br />
composted <strong>manure</strong>) was 3329 kg <strong>with</strong> variation between and was on average 16 % higher<br />
than the low (0 t per ha) <strong>manure</strong> treatment FYM 1. The average yield <strong>in</strong> FYM 3 treatment<br />
was 23 % higher than FYM 1 and was the only statistically significant difference. Despite a<br />
high variation <strong>in</strong> the yield there seems to be a weak <strong>in</strong>crease of the yield which from the year<br />
2002 was about 42 kg per ha for the treatments <strong>with</strong> composted <strong>manure</strong> compare <strong>with</strong> 26 kg<br />
/ha for the treatments <strong>with</strong> no composted <strong>manure</strong> . For the whole study period an <strong>in</strong>crease of<br />
soil <strong>organic</strong> matter (SOM) was observed <strong>in</strong> soil <strong>with</strong> high applications of composted <strong>manure</strong><br />
and there was also a tendency of higher yields <strong>in</strong> plots treated <strong>with</strong> composted <strong>manure</strong>. More<br />
research is needed to understand the complexity of factors that <strong>in</strong>fluence yields over the long<br />
term.<br />
Influence of the extent biogas treatment on SOM, soil fertility and long term productivity.<br />
The <strong>in</strong>crease of humus content <strong>in</strong> HV 5 which had applications of only biogas <strong>manure</strong> from<br />
2003 (Figure 28) follow the same trend as <strong>in</strong> HV 1 studied from 1991 (an <strong>in</strong>creas<strong>in</strong>g of the<br />
soil carbon status for all treatments). This <strong>in</strong>crease <strong>in</strong> humus content has occurred despite the<br />
fact that <strong>in</strong> the biogas treatments up to 66 % of the total carbon <strong>in</strong> the <strong>manure</strong> is lost through<br />
the <strong>production</strong> of methane gas and loss of CO 2 dur<strong>in</strong>g both the biogas fermentation and the<br />
45
follow<strong>in</strong>g compost<strong>in</strong>g (Figure 18 a). <strong>On</strong>ly 34 % of the orig<strong>in</strong>al carbon <strong>in</strong> <strong>manure</strong> is<br />
<strong>in</strong>corporated <strong>in</strong> the soil <strong>organic</strong> biomass (SOM). This is <strong>in</strong> contrast to the 50% that is<br />
<strong>in</strong>corporated from composted <strong>manure</strong> (Figure 18 b). It is possible that both types of <strong>manure</strong><br />
eventually result <strong>in</strong> the formation of the same amount of SOM correspond<strong>in</strong>g to about a third<br />
of the orig<strong>in</strong>al biomass <strong>in</strong> <strong>manure</strong> but perhaps <strong>with</strong> lower biological activity dur<strong>in</strong>g both the<br />
compost<strong>in</strong>g process (Figure 16) and <strong>in</strong> the soil when biogas <strong>manure</strong> is used. The long term<br />
implications of this need to be studied.<br />
Conclusions<br />
<strong>On</strong>e of the world's first large scale dry anaerobic-digestion on-farm biogas plants is <strong>in</strong> Järna<br />
Sweden on the ecological recycl<strong>in</strong>g farm Skilleby-Yttereneby which is to a large extent selfsufficient.<br />
This plant is run by the Biodynamic Research Institute <strong>in</strong> Järna. The biogas plant's<br />
fermentation process is divided <strong>in</strong>to two stages: one which gives <strong>solid</strong> rest products of <strong>manure</strong><br />
that are composted before field application and one which produces a liquid fraction for direct<br />
use as a complementary liquid <strong>manure</strong> <strong>in</strong> crop <strong>production</strong>.<br />
The biogas <strong>production</strong> is based on approximately 2 tons <strong>manure</strong> per day from app. 50 dairy<br />
cows and 50 calves. This number of animals, (0,6 animal units per ha on 137 ha), is based on<br />
the pr<strong>in</strong>ciples of Ecological Recycl<strong>in</strong>g Agriculture (ERA). This means that the number of<br />
animals is adapted to the amount of fodder that can be susta<strong>in</strong>ably produced on the farm <strong>in</strong> a 5<br />
year crop rotation <strong>with</strong> 3 years clover grassland for biological nitrogen fixation and soil<br />
improvement.<br />
The <strong>production</strong> process was evaluated dur<strong>in</strong>g the years 2003 – 2009. Dur<strong>in</strong>g optimal<br />
conditions it was possible to convert nearly 50 % of the total <strong>manure</strong> carbon content to biogas<br />
(about 60% CH 4 and 40 % CO 2 ) from the 2 m 3 <strong>manure</strong> per day.<br />
Additional ecological food residues from public kitchens were also used as substrate<br />
<strong>in</strong>dicat<strong>in</strong>g the possibility to also recycle plant nutrients from food products back to agriculture<br />
and <strong>in</strong> this way also <strong>in</strong>crease the biogas <strong>production</strong> on the farm. With this complement of<br />
food residues it was possible to produce the same amount or more of renewable net energy<br />
used as fuel for the farm vehicles.<br />
The 50% reduction of nitrogen compounds (NH 4 N and N 2 O N) emissions from the <strong>manure</strong><br />
system as well as lowered methane gas emissions from <strong>manure</strong> mean that more nitrogen is<br />
recycled to the soil for crop <strong>production</strong> and green house gases emissions and acidification are<br />
decreased.<br />
An additional benefit to the farmer is the more effective recycl<strong>in</strong>g of nitrogen <strong>in</strong> the form of<br />
liquid <strong>manure</strong> that can be optimally utilised for crop <strong>production</strong>. In this documented case the<br />
result was a 14 % higher yield of bread gra<strong>in</strong>. The recycl<strong>in</strong>g from both the farm and food<br />
sector, produc<strong>in</strong>g bio-energy and compost from <strong>solid</strong> <strong>manure</strong> make it possible for farmers to<br />
become self-sufficient <strong>in</strong> plant nutrients while simultaneously improv<strong>in</strong>g soil fertility<br />
These field studies compar<strong>in</strong>g composted and non-composted <strong>manure</strong> show how a farm<strong>in</strong>g<br />
system based on a five year crop rotation comb<strong>in</strong>ed <strong>with</strong> a balanced animal <strong>production</strong> based<br />
46
on on-farm fodder <strong>production</strong> and <strong>with</strong> recycl<strong>in</strong>g and compost<strong>in</strong>g of the <strong>manure</strong> can <strong>in</strong> the<br />
long term improve soil fertility and the conditions for a better yield. This is possible to<br />
achieve <strong>with</strong> <strong>solid</strong> <strong>manure</strong> which is first used for biogas <strong>production</strong> and is then composted<br />
before field application.<br />
This study shows how ecological farm<strong>in</strong>g based on recycl<strong>in</strong>g has the capacity to be selfsufficient<br />
<strong>in</strong> energy through biogas <strong>production</strong> from <strong>solid</strong> <strong>manure</strong> and food residues while at<br />
the same time improv<strong>in</strong>g soil fertility and reduc<strong>in</strong>g the surplus of carbon <strong>in</strong> the atmosphere by<br />
improv<strong>in</strong>g the soils capacity to store carbon.<br />
Acknowledgments<br />
The author warmly thank colleagues who on different ways contributed to this report and the<br />
realisation of the now evaluated <strong>Biogas</strong> Plant, especially Lars Evers who <strong>with</strong> support from<br />
Bertil Siversson have realised the construction of the Plant and then been responsible for the<br />
biogas <strong>production</strong>, the improvement and collect<strong>in</strong>g data. I also warmly the farmer Dagf<strong>in</strong>n<br />
Reder and his staff who open the farm <strong>with</strong> all the practical consequences <strong>in</strong> the daily work<br />
for the realisation of the biogas plant. I thank also the farm owner, Agape foundation, who<br />
also gave economical support and guaranties to realise the plant and f<strong>in</strong>ally the group of<br />
private and <strong>in</strong>stitutional f<strong>in</strong>ancial supporter to build the biogas plant. I will also thank my<br />
colleague <strong>in</strong> F<strong>in</strong>land, Dr W<strong>in</strong>fried Schäfer who together <strong>with</strong> colleagues <strong>in</strong> MTT <strong>in</strong> F<strong>in</strong>land<br />
was do<strong>in</strong>g the reported technical documentation an evaluation of the biogas plant. F<strong>in</strong>ally I<br />
warmly thank Ekhaga Foundation, the support which give the possibility to realise this<br />
evaluation.<br />
Conclusion <strong>in</strong> Swedish<br />
Sammanfattn<strong>in</strong>g på svenska<br />
Gårdsbaserad biogasproduktion med fast<br />
stallgödsel i ekologisk odl<strong>in</strong>g<br />
En av världens första fullskaleanläggn<strong>in</strong>gar på gårdsnivå baserad på fast stallgödsel blev<br />
färdigbygd 2003 på Skilleby-Yttereneby försöksgård i Järna och vars miljö och<br />
produktionsnytta nu har utvärderats. Anläggn<strong>in</strong>gen är bygd och utvecklad av Stiftelsen<br />
Biodynamiska Forskn<strong>in</strong>gs<strong>in</strong>stitutet i Järna under ledn<strong>in</strong>g av Artur Granstedt. Konstruktör har<br />
varit Lars Evers anställd vid <strong>in</strong>stitutet samt Bertil Siversson på BioMil AB.<br />
Gården är självförsörjande på både foder och gödsel och kan genom biogasanläggn<strong>in</strong>gen bli<br />
självförsörjande även på energi. Rötn<strong>in</strong>gsprocessen sker i två steg. Det första steget ger en<br />
restprodukt av rötad gödsel som genomgår en efterkomposter<strong>in</strong>g och användes på hösten som<br />
gödsel till höstsäd. Steg två består av en anaerob metangasjäsn<strong>in</strong>g av den flytande<br />
rötn<strong>in</strong>gsresten från steg ett och ger en flytande restprodukt som används som flytgödsel i<br />
växande gröda.<br />
47
<strong>Biogas</strong>produktionen baseras på ca 2 ton fast stallgödsel per dag som efter ur<strong>in</strong>separer<strong>in</strong>g<br />
matas ut med tryckare från ladugården med ca 50 mjölkkor och ca 50 ungdjur och kalvar för<br />
gårdens rekryter<strong>in</strong>g. Antalet djur (0,6 djurenheter per ha och en totalareal på 137 ha) är<br />
baserat på pr<strong>in</strong>ciperna för ekologiskt kretsloppsjordbruk (Ecological Recycl<strong>in</strong>g Agriculture<br />
and Society). Det betyder att antalet djur är anpassat till den mängd foder gården uthålligt kan<br />
producera samtidigt som det f<strong>in</strong>ns utrymme för odl<strong>in</strong>g av livsmedelsgrödor på ca 15 % av<br />
arealen i den femåriga växtföljden med tillräcklig andel kvävefixerande och djuprotade<br />
vallbaljväxter för gårdens självförsörjn<strong>in</strong>g med kväve och m<strong>in</strong>eralämnen (vårsäd men <strong>in</strong>sådd,<br />
tre år vall följt av höstvete som gödslas före sådd).<br />
Produktionsprocessen och rötresternas efterföljande användn<strong>in</strong>g utvärderades genom mätn<strong>in</strong>g<br />
av producerad biogas, analyser av rötrester och beräkn<strong>in</strong>g av nettoproducerad energi.<br />
Miljökonsekvensanalyser gjordes genom analyser av rötad biomassa, massbalansberäkn<strong>in</strong>gar<br />
och beräkn<strong>in</strong>gar av växtnär<strong>in</strong>gsflödena på gårdsnivå. Fältförsök genomfördes med<br />
användande av rötrester som gödsel i jämförelser med traditionell stallgödselhanter<strong>in</strong>g och<br />
som gjorde det möjligt att påvisa <strong>in</strong>verkan på humusuppbyggnad, markens<br />
bördighetsegenskaper och skördeutfall.<br />
Under optimala bet<strong>in</strong>gelser visade det sig möjligt att omforma nära 50 % av gödselns totala<br />
kol<strong>in</strong>nehåll till biogas(omkr<strong>in</strong>g 60% CH 4 och 40 % CO 2 ) från omkr<strong>in</strong>g 2 m 3 gödsel per dag.<br />
Ytterligare tillförsel av substrat till biogasanläggn<strong>in</strong>gen i form köksavfall från en ekologisk<br />
restaurang gjorde det möjligt att öka biogasproduktionen och samtidigt också öka<br />
recirkuler<strong>in</strong>g av växtnär<strong>in</strong>g från livsmedelsavfallet tillbaka till åkern. Med detta komplement<br />
så uppnåddes mer effektiv växtnär<strong>in</strong>gscirkuler<strong>in</strong>g och en nettoproduktion av förnyelsebar<br />
energi motsvarande gårdens energibehov för traktorer och mask<strong>in</strong>er.<br />
En 50 % reduktion av emissionen av kvävefören<strong>in</strong>gar (NH 4 N and N 2 O N) kunde på påvisas<br />
genom att motsvarande mera kväve erhölls i form av kväve i den flytande restprodukten som<br />
användes som flytgödsel. Detta <strong>in</strong>nebär reducerade emissioner av växthusgaser samtidigt med<br />
en effektivare resursanvändn<strong>in</strong>g och som gynnade växtproduktionen. I fältförsöken påvisades<br />
14 % högre skörd av brödsäd jämfört med traditionell stallgödselhanter<strong>in</strong>g med fastgödsel och<br />
efterföljande komposter<strong>in</strong>g så som det tillämpades på försöksgården <strong>in</strong>nan<br />
biogasanläggn<strong>in</strong>gen byggdes.<br />
Fältstudierna omfattade jämförelser mellan komposterad och icke komposterad gödsel i det<br />
här tillämpade odl<strong>in</strong>gssystemet med femårig växtföljden, treåriga baljväxtblandvallar och<br />
därtill anpassad djurhålln<strong>in</strong>g. En mullhaltsökn<strong>in</strong>g motsvarande ca 400 kg kol per ha och år<br />
under ett växtföljdsomlopp har här kunnat påvisas och med något högre värden för<br />
komposterad gödsel. De påvisade mullhaltsökn<strong>in</strong>garna gällde också för biogasrötad gödsel<br />
med efterföljande komposter<strong>in</strong>g.<br />
Studien visar hur ekologiskt lantbruk baserat på kretslopp har möjligheten att vara<br />
självförsörjande på energi genom biogasproduktion baserad på fast stallgödsel och<br />
livsmedelsavfall och samtidigt öka bördigheten i marken. Emissionerna av koldioxid till<br />
atmosfären m<strong>in</strong>skar när det markbundna kolförrådet ökar. Till dessa miljöfördelar kommer de<br />
m<strong>in</strong>skade emissioner av växthusgaser som själva biogasproduktionen <strong>in</strong>nebär med m<strong>in</strong>skade<br />
emissioner från förbrukn<strong>in</strong>g av fossila drivmedel på gårdsnivå.<br />
48
Studien med utvärder<strong>in</strong>g av biogasanläggn<strong>in</strong>gens miljönytta och betydelse för<br />
lantbruksproduktionen har kunnat genomföras tack vare anslag från Ekhagastiftelsen.<br />
References<br />
Abele U. 1987. Produktqualität und Düngung- m<strong>in</strong>eralisch, organisch, biologisch-dynamisch,<br />
Ed, Mün, ster-Hiltrup (1987).<br />
Bertilsson, G. 2010. Mat, Klimat och miljö. En möjlighetsbok. Recito förlag, Borås.<br />
Dlouhy J. 1981. Alternativa odl<strong>in</strong>gsformer- växtprodukters kvalitet vid konventionell och<br />
biodynamisk odl<strong>in</strong>g, <strong>in</strong> Inst f Växtodl<strong>in</strong>g, Ed. SLU, Uppsala.<br />
Granstedt A. 1992. Case studies on the flow and supply of nitrogen <strong>in</strong> alternative farm<strong>in</strong>g <strong>in</strong><br />
Sweden. Biological Agriculture and Horticulture 9:15-63.<br />
Granstedt A. 1995. Long term field experiment <strong>in</strong> Sweden (K-Trial). Effects on <strong>organic</strong> and<br />
<strong>in</strong><strong>organic</strong> fertilizers on soil and crops. , <strong>in</strong> Fertilization, crop yield and quality Ma<strong>in</strong> effects of<br />
various <strong>organic</strong> and m<strong>in</strong>eral fertilization on soil <strong>organic</strong> matter turnover and plant growth<br />
Concerted action supported by the European Community Fertilization Systems <strong>in</strong> Organic<br />
<strong>Farm</strong><strong>in</strong>g, Ed by Raupp J, pp 16-21<br />
Granstedt A. 2000. Stallgödselanvändn<strong>in</strong>g i ekologisk odl<strong>in</strong>g med hänsyn till hushålln<strong>in</strong>g med<br />
växtnär<strong>in</strong>gsämnen och produktion i ekologisk odl<strong>in</strong>g, <strong>in</strong> Ekologiskt Lantbruk, Ed. Swedish<br />
university of agricultural Sciences., Uppsala.).<br />
Granstedt, A., L-Baeckström, G. 2000. Studies of the preced<strong>in</strong>g crop effect of leys <strong>in</strong><br />
ecological agriculture. American Journal of Alternative Agriculture, vol. 15, no. 2, pages 68–<br />
78. Wash<strong>in</strong>gton University.<br />
Granstedt, A and Kjellenberg L. 2008. Organic and biodynamic cultivation - a possible way<br />
of <strong>in</strong>creas<strong>in</strong>g humus capital, improv<strong>in</strong>g soil fertility and provid<strong>in</strong>g a significant carbon s<strong>in</strong>k <strong>in</strong><br />
Nordic conditions. Proceed<strong>in</strong>gs of the Second Scientific Conference of the International<br />
Society of Organic Agriculture Research (ISOFAR), held at the 16th IFOAM Organic World<br />
Congress Modena, Italy, June 18-20, 2008.<br />
Granstedt, A. Thomsson, O. and Schneider, T. 2006, Environmental impacts of ecological<br />
food systems - f<strong>in</strong>al report from BERAS. Work Package 2. CUL, SLU<br />
49
Hepperly, Douds, Seidel, 2006. The Rodale Institute <strong>Farm</strong><strong>in</strong>g Systems Trial 1981 to 2005. In<br />
Raupp, Pekrun, Oltmanns and Köpke. Long Term Field Experiments <strong>in</strong> Organic <strong>Farm</strong><strong>in</strong>g.<br />
ISOFAR Scientific Series. Berl<strong>in</strong>.<br />
Kjellenberg, L., Granstedt A. and Pettersson BD. 2005. The connection between soil, crop<br />
and <strong>manure</strong>. Resuts from the K-trial, a 33-year study on the effect of fertilisation on the<br />
properties of soil and crop, Ed. Biodynamic Research Institute, Järna, Sweden (2005).<br />
Kjellenberg L, Pettersson BD and Granstedt A. 1998. Samband mellan Mark Gröda Gödsl<strong>in</strong>g<br />
- Resultat från K-försöket en 33-årig studie av gödsl<strong>in</strong>gens <strong>in</strong>verkan på mark och grödors<br />
egenskaper <strong>in</strong> Nordisk Forskn<strong>in</strong>gsr<strong>in</strong>g meddelande, Ed. Nordisk Forskn<strong>in</strong>gsr<strong>in</strong>g för<br />
biodynamisk odl<strong>in</strong>g, Järna.<br />
Malgeryd, J., Karlsson, S., Rhode, L. & Salomon, E. 2002. Lönsam stallgödselhanter<strong>in</strong>g –<br />
teknik, växtnär<strong>in</strong>gshushålln<strong>in</strong>g, kvalitet och ekonomi. JTI-Institutet för jordbruk- och<br />
miljöteknik. Tekn<strong>in</strong>g för Lantbruket 99.<br />
Mäder, P., Fliessbach, A., Dubois, D., Gunst,L., Fried, P., & Niggli, U. 2000. Soil Fertility<br />
and Biodiversity <strong>in</strong> Organic <strong>Farm</strong><strong>in</strong>g. Science VOL 296 pp 1592-1597.<br />
Persson, J., 1994. Soil Fertility and Regulat<strong>in</strong>g Factors. Naturvårdsverket, Stockholm.<br />
Pettersson B. D. 1982. Konventionell och biodynamisk odl<strong>in</strong>g, <strong>in</strong> Nordisk Forskn<strong>in</strong>gsr<strong>in</strong>g<br />
meddelande, Ed. Nordisk Forskn<strong>in</strong>gsr<strong>in</strong>g, Järna.<br />
Pettersson B.D, Reents H and Wist<strong>in</strong>ghausen Ev, Düngung und Bodeneigenschaften, <strong>in</strong><br />
Nordisk Forskn<strong>in</strong>gsr<strong>in</strong>g meddelande, Ed. Nordisk Forskn<strong>in</strong>gsr<strong>in</strong>g för biodynamisk odl<strong>in</strong>g,<br />
Järna (1992).<br />
Schäfer, W., Lehto, M and Teye, F. 2006. Dry anaerobic digestion of <strong>organic</strong> residues on<br />
farm. Solid compost from biogas plant digestation residues –a new product. MTT, Agrifood<br />
Research, F<strong>in</strong>land.<br />
50
precipitations per yea mmr<br />
Average year temperatures o C<br />
Supplement 1. Weather conditions<br />
Data on temperature and precipitation was obta<strong>in</strong>ed from the Swedish Meteorological and<br />
Hydrological Institute weather stations <strong>in</strong> the proximity (<strong>with</strong><strong>in</strong> 20 km), from the field trial<br />
and from 2004 and onwards on a climatic station located on the farm (figures 10- 16 ).<br />
8,5<br />
8,0<br />
8,2<br />
7,5<br />
7,0<br />
7,2<br />
7,4<br />
6,5<br />
6,5<br />
6,7<br />
6,0<br />
2004 2005 2006 2007 2008<br />
Figure 1. Supplement 1. Average annual temperatures dur<strong>in</strong>g 2004 – 2008.<br />
700<br />
648<br />
600<br />
500<br />
514<br />
543<br />
419<br />
400<br />
345<br />
300<br />
200<br />
100<br />
0<br />
2004 2005 2006 2007 2008<br />
Figure 2, supplement 1. Average annual precipitation dur<strong>in</strong>g 2004 – 2008<br />
51
Monthly averagre temperatures o C<br />
Monthly average temperatures o C<br />
20,0<br />
15,0<br />
10,0<br />
5,0<br />
0,0<br />
jan-07 feb-07 mar-07 apr-07 maj-07 jun-07 jul-07 aug-07 sep-07 okt-07 nov-07 dec-07<br />
Figure 3. Monthly<br />
average<br />
-5,0<br />
temperatures for<br />
Aver 2004-08 Actual 2007<br />
2007 (actual)<br />
compared to the average monthly temperatures dur<strong>in</strong>g the five years period 2004 – 2008.<br />
20,0<br />
15,0<br />
10,0<br />
5,0<br />
0,0<br />
jan-08 feb-08 mar-08 apr-08 maj-08 jun-08 jul-08 aug-08 sep-08 okt-08 nov-08 dec-08<br />
-5,0<br />
Aver 2004-08 Actual 2008<br />
Figure 4. Monthly average temperatures for 2008 (actual) compared to the average monthly<br />
temperatures dur<strong>in</strong>g the five years period 2004 – 2008.<br />
52
K-AL mg/100g<br />
F1<br />
F1+<br />
F2+<br />
F3+<br />
K1+<br />
K2+<br />
K3-<br />
F2-<br />
F3-<br />
K1-<br />
K2-<br />
K3-<br />
K3+<br />
P-AL mg/100g<br />
F1<br />
F1+<br />
F2+<br />
F3+<br />
K1+<br />
K2+<br />
F2-<br />
F3-<br />
K1-<br />
K2-<br />
K3+<br />
pH<br />
Supplement 2. Chemical properties<br />
pH top soil HV I<br />
6,5<br />
6,0<br />
5,5<br />
5,0<br />
1991 1995 2000 2005 2005<br />
P-AL top soil HV I<br />
4,0<br />
3,5<br />
3,0<br />
2,5<br />
2,0<br />
1,5<br />
1,0<br />
0,5<br />
0,0<br />
1991<br />
1995<br />
2000<br />
2005<br />
K-AL top soil HVI<br />
20,0<br />
15,0<br />
10,0<br />
5,0<br />
0,0<br />
F1<br />
F1+<br />
F2+<br />
F3+<br />
K1+<br />
K2+<br />
F2-<br />
F3-<br />
K1-<br />
K2-<br />
K3-<br />
K3+<br />
1991 1995 2000 2005 2005<br />
53
Ca-Al mg/100 g<br />
Mg AL mg/100g<br />
Mg-AL top soil HV I<br />
35,0<br />
30,0<br />
25,0<br />
20,0<br />
15,0<br />
10,0<br />
5,0<br />
0,0<br />
F1<br />
F1+<br />
F2+<br />
F3+<br />
K1+<br />
K2+<br />
F2-<br />
F3-<br />
K1-<br />
K2-<br />
K3-<br />
K3+<br />
1991 1995 2000 2005 2005<br />
Ca-AL top soil HV I<br />
300,0<br />
250,0<br />
200,0<br />
150,0<br />
100,0<br />
50,0<br />
0,0<br />
F1<br />
F1+<br />
F2+<br />
F3+<br />
K1+<br />
K2+<br />
F2-<br />
F3-<br />
K1-<br />
K2-<br />
K3-<br />
K3+<br />
1991 1995 2000 2005 2005<br />
Figure 1 - 5 supplement 2. Soil chemical analysis 1991, 1995, 2000 and 2005 field trial HV1.<br />
pH top soil HV2<br />
6,80<br />
6,60<br />
6,40<br />
6,20<br />
6,00<br />
5,80<br />
5,60<br />
f 0- f 0+ f 2- f 2+ f 3- f 3+ k0- k0+ k2- k2+ k3- k3+<br />
pH-92 6,05 6,09 6,14 6,14 6,11 6,12 6,11 6,12 6,03 6,05 6,09 6,07<br />
pH-95 6,35 6,50 6,53 6,43 6,45 6,43 6,35 6,43 6,23 6,28 6,30 6,30<br />
pH 2007 6,43 6,38 6,58 6,48 6,48 6,55 6,13 6,38 6,40 6,48 6,40 6,53<br />
pH-92 pH-95 pH 2007<br />
54
mg / 100 g jord<br />
mg/100 g jord<br />
P-AL top soil HV2<br />
4,00<br />
3,00<br />
2,00<br />
1,00<br />
0,00<br />
f0<br />
+<br />
f2<br />
+<br />
f3<br />
+<br />
P-AL 92 1,8 1,9 2,1 2,0 2,0 2,1 2,1 2,2 1,8 1,9 2,3 2,1<br />
P-95 1,4 1,5 2,2 1,7 1,9 1,7 1,9 2,3 1,4 1,5 1,8 1,9<br />
P-AL 2007 1,8 2,6 2,5 2,5 2,6 2,7 2,2 2,4 2,3 2,4 2,8 3,2<br />
k0<br />
+<br />
P-AL 92 P-95 P-AL 2007<br />
k2<br />
+<br />
f0-<br />
f2-<br />
f3-<br />
k0-<br />
k2-<br />
k3-<br />
k3<br />
+<br />
K- AL top soil HV2<br />
15,00<br />
10,00<br />
5,00<br />
0,00<br />
k0<br />
+<br />
k2<br />
+<br />
f 0- f 0+ f 2- f 2+ f 3- f 3+ k0-<br />
k2-<br />
k3-<br />
k3<br />
+<br />
K-AL-92 9,0 9,0 8,7 8,7 9,5 9,41 8,91 8,8 8,5 8,5 9,31 9,0<br />
K-AL-95 10,3 10,7 11,3 11,2 12,5 12,0 10,3 10,7 11,0 10,1 11,7 10,7<br />
K-AL 2007 10,2 10,4 11,7 11,2 13,0 12,6 10,0 10,1 11,8 11,3 13,4 12,5<br />
K-AL-92 K-AL-95 K-AL 2007<br />
Figure 6 - 8 supplement 2. Soil chemical analysis 1991, 1995, 2000 and 2005 field trial HV2.<br />
55