You also want an ePaper? Increase the reach of your titles
YUMPU automatically turns print PDFs into web optimized ePapers that Google loves.
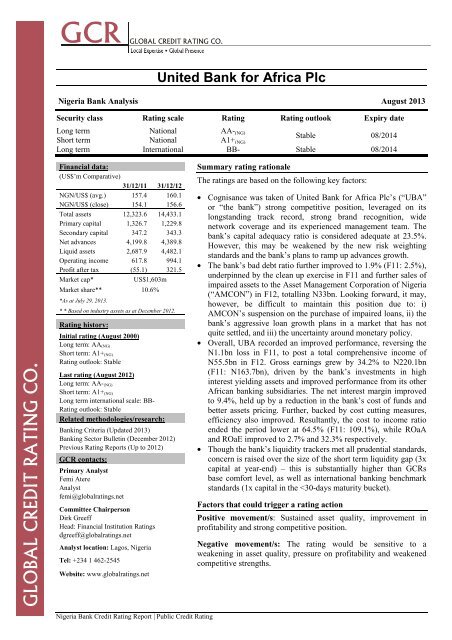
United Bank for Africa <strong>Plc</strong><br />
Nigeria Bank Analysis August 2013<br />
Security class Rating scale Rating Rating outlook Expiry date<br />
Long term National AA- (NG)<br />
Stable 08/2014<br />
Short term National A1+ (NG)<br />
Long term International BB- Stable 08/2014<br />
Financial data:<br />
(US$’m Comparative)<br />
31/12/11 31/12/12<br />
NGN/US$ (avg.) 157.4 160.1<br />
NGN/US$ (close) 154.1 156.6<br />
Total assets 12,323.6 14,433.1<br />
Primary capital 1,326.7 1,229.8<br />
Secondary capital 347.2 343.3<br />
Net advances 4,199.8 4,389.8<br />
Liquid assets 2,687.9 4,482.1<br />
Operating income 617.8 994.1<br />
Profit after tax (55.1) 321.5<br />
Market cap*<br />
US$1,603m<br />
Market share** 10.6%<br />
*As at July 29, 2013.<br />
* * Based on industry assets as at December 2012.<br />
Rating history:<br />
Initial rating (August 2000)<br />
Long term: AA (NG)<br />
Short term: A1+ (NG)<br />
Rating outlook: Stable<br />
Last rating (August 2012)<br />
Long term: AA- (NG)<br />
Short term: A1+ (NG)<br />
Long term international scale: BB-<br />
Rating outlook: Stable<br />
Related methodologies/research:<br />
Banking Criteria (Updated 2013)<br />
Banking Sector Bulletin (December 2012)<br />
Previous Rating Reports (Up to 2012)<br />
GCR contacts:<br />
Primary Analyst<br />
Femi Atere<br />
Analyst<br />
femi@globalratings.net<br />
Committee Chairperson<br />
Dirk Greeff<br />
Head: Financial Institution Ratings<br />
dgreeff@globalratings.net<br />
Analyst location: Lagos, Nigeria<br />
Tel: +234 1 462-2545<br />
Website: www.globalratings.net<br />
Summary rating rationale<br />
The ratings are based on the following key factors:<br />
• Cognisance was taken of United Bank for Africa <strong>Plc</strong>’s (“<strong>UBA</strong>”<br />
or “the bank”) strong competitive position, leveraged on its<br />
longstanding track record, strong brand recognition, wide<br />
network coverage and its experienced management team. The<br />
bank’s capital adequacy ratio is considered adequate at 23.5%.<br />
However, this may be weakened by the new risk weighting<br />
standards and the bank’s plans to ramp up advances growth.<br />
• The bank’s bad debt ratio further improved to 1.9% (F11: 2.5%),<br />
underpinned by the clean up exercise in F11 and further sales of<br />
impaired assets to the Asset Management Corporation of Nigeria<br />
(“AMCON”) in F12, totalling N33bn. Looking forward, it may,<br />
however, be difficult to maintain this position due to: i)<br />
AMCON’s suspension on the purchase of impaired loans, ii) the<br />
bank’s aggressive loan growth plans in a market that has not<br />
quite settled, and iii) the uncertainty around monetary policy.<br />
• Overall, <strong>UBA</strong> recorded an improved performance, reversing the<br />
N1.1bn loss in F11, to post a total comprehensive income of<br />
N55.5bn in F12. Gross earnings grew by 34.2% to N220.1bn<br />
(F11: N163.7bn), driven by the bank’s investments in high<br />
interest yielding assets and improved performance from its other<br />
African banking subsidiaries. The net interest margin improved<br />
to 9.4%, held up by a reduction in the bank’s cost of funds and<br />
better assets pricing. Further, backed by cost cutting measures,<br />
efficiency also improved. Resultantly, the cost to income ratio<br />
ended the period lower at 64.5% (F11: 109.1%), while ROaA<br />
and ROaE improved to 2.7% and 32.3% respectively.<br />
• Though the bank’s liquidity trackers met all prudential standards,<br />
concern is raised over the size of the short term liquidity gap (3x<br />
capital at year-end) – this is substantially higher than GCRs<br />
base comfort level, as well as international banking benchmark<br />
standards (1x capital in the
Organisational profile<br />
Corporate summary 1<br />
<strong>UBA</strong> is a fully-fledged commercial bank with an<br />
international focus, offering a wide array of banking<br />
and pension fund custody services to its customers.<br />
Apart from Nigeria, the bank has a presence in 18<br />
African countries, as well as the United Kingdom, the<br />
United States of America and France. The bank has<br />
grown to become one of the largest banks in sub-<br />
Sahara Africa with over 700 branches across all its<br />
jurisdictions.<br />
Ownership structure<br />
Apart from the <strong>UBA</strong> Staff investment trust scheme<br />
and Stanbic Nominees Nigeria Ltd (“SNNL”), no<br />
single shareholder held more than 5% of the bank’s<br />
issued shares as at 31 December 2012. Overall, the<br />
bank’s shareholding structure is well spread across<br />
both local and foreign investors.<br />
Table 1: Shareholding Structure<br />
% Holding<br />
Stanbic Nominees Nig. Ltd 11.0<br />
<strong>UBA</strong> Staff Investment Trust Scheme 7.6<br />
Consolidated Trust Funds Ltd 4.7<br />
The Bank of New York Mellon 4.4<br />
Heirs Holdings Limited 3.4<br />
STH Limited 2.6<br />
Bank of America Merrill Lynch 2.3<br />
International Finance Corporation 1.8<br />
Poshville Investment Limited 1.7<br />
African Development Bank 1.6<br />
Others 58.9<br />
Total 100.0<br />
Source: AFS.<br />
Strategy and operations<br />
Having spun-off its non-banking subsidiaries<br />
internally, in line with the Central Bank of Nigeria’s<br />
(“CBN”) requirements, the old <strong>UBA</strong> Group is now<br />
restructured into 4 standalone entities: <strong>UBA</strong>, Africa<br />
Prudential Registrar <strong>Plc</strong>, Afriland Properties <strong>Plc</strong> and<br />
<strong>UBA</strong> Capital <strong>Plc</strong>. As the group’s core-banking entity,<br />
<strong>UBA</strong> now controls all 18 African banking<br />
subsidiaries, the <strong>UBA</strong> New York branch, <strong>UBA</strong><br />
Capital Europe, <strong>UBA</strong> Pension Custodian and <strong>UBA</strong><br />
FX Mart Limited (all permitted under the new<br />
banking regulations). To reflect the new business<br />
model, the organisational structure was reviewed<br />
with a focus on human capacity building and deeper<br />
market penetration. In this regard, additional regional<br />
bank heads were appointed to enhance control, as<br />
well as to mobilise low-cost deposits at the retail<br />
segments. Also, a global account management<br />
framework was established to monitor the bank’s<br />
operations at a granular level. Overall, the bank<br />
continued to pursue its core strategic focus.<br />
In 2012, <strong>UBA</strong> operated with 11,529 employees, over<br />
5,303 point-of-sales units (“POS”) and about 1,500<br />
Automated Teller Machines (“ATMs”).<br />
Governance structure<br />
<strong>UBA</strong> continued to improve on its corporate<br />
governance structure, adhering to the provisions of<br />
the CBN’s Code of Corporate Governance for Banks<br />
and the Securities and Exchange Commission’s<br />
(“SEC”) Code for Publicly Quoted Companies. The<br />
bank’s Board of Director is made up of 18 members,<br />
8 of which are Executive Directors, with the<br />
remainder serving as Non-Executive Directors.<br />
Subsequent to end-2012, 2 Executive Directors<br />
(Rasheed Olaoluwa & Ifeatu Onejeme) retired from<br />
the board.<br />
Testing description<br />
Findings<br />
Number of non-executive directors 10/18 (Incl. chairman)<br />
Tenure of non-executive directors 3 years each/4 cycles<br />
Independent directors Yes, 2<br />
Number of board committees 6<br />
Int. audit & compliance function Yes, independent/free units<br />
External auditors & rotation policy PWC/10 years tenure<br />
Board evaluation<br />
Akintola Williams Deloitte<br />
Internal & external practice guides Yes, group wide rules applied<br />
Financial <strong>report</strong>ing<br />
The bank’s financial statements were prepared in<br />
accordance with International Financial Reporting<br />
Standards (“IFRS”). The annual and interim <strong>report</strong>s<br />
are relatively detailed and transparent. The external<br />
auditor, PricewaterhouseCoopers, issued a clean<br />
<strong>report</strong> on the financial statements, as at year end-<br />
2012.<br />
Operating environment 2<br />
Industry overview<br />
Competitors in the Nigerian banking space include<br />
commercial banks, merchant banks, development<br />
financial institutions, specialised financial institutions<br />
and non-bank financial institutions. The full take-off<br />
of the newly introduced stratified banking model in<br />
2012 has dramatically re-shaped the country’s<br />
commercial banking operating universe. This<br />
segment presently comprise: 10 international banks<br />
(including <strong>UBA</strong>), 9 national banks and 2 regional<br />
banks, including Heritage Bank Limited (which<br />
commenced operations in 2013). Three of the<br />
National Banks, namely: Enterprise Bank Limited,<br />
Keystone Bank Limited and Mainstreet Bank Limited<br />
are presently under AMCON’s management. In<br />
addition, First Bank of Nigeria <strong>Plc</strong>, First City<br />
Monument Bank <strong>Plc</strong>, Stanbic IBTC Bank <strong>Plc</strong> and<br />
Union Bank of Nigeria <strong>Plc</strong> now operate as<br />
subsidiaries of Nigerian financial services companies,<br />
1 Refer to previous United Bank for Africa <strong>Plc</strong> <strong>report</strong>s for a detailed<br />
2 Refer to GCR’s 2012 Nigeria Banking Industry Bulletin for a review<br />
background.<br />
of all relevant economic, regulatory and/or industry developments.<br />
Nigeria Bank Credit Rating Report | Public Credit Rating Page 2
in line with the new banking rules which, inter-alia<br />
prohibits banks from owning non-core subsidiaries.<br />
Although yet to resume its banking operations, the<br />
banking license of Savannah Bank Limited was<br />
restored. Assets quality improved across the sector in<br />
2012. However, this is mainly due to the mop up of<br />
banks’ major toxic loans by AMCON. It may,<br />
however, be difficult to maintain the NPL ratio at this<br />
level through 2013 due to: (i) the temporary<br />
suspension of AMCON’s mandate, and (ii) the<br />
declining returns on securities, which has now<br />
stimulated banks’ appetite for loan assets creation.<br />
Competitive position<br />
With its longstanding record, <strong>UBA</strong> ranks as the third<br />
largest bank in terms of total assets and second<br />
largest with respect to branch network within the<br />
Nigeria banking sector. As such, its competitive<br />
advantage remains strong. The bank is compared<br />
against several of its peers in Table 2 below.<br />
Financial profile<br />
Funding composition<br />
<strong>UBA</strong>’s assets were funded by capital (10.9%),<br />
customer deposits (78.6%), other borrowings (5.1%)<br />
and other liabilities (5.4%).<br />
Customer deposits and interbank funding:<br />
Leveraging off the bank’s wide branch network and<br />
brand recognition, total deposits grew by 21.3% to<br />
N1.8tn (F11: N1.5tn) in F12. In spite of the upward<br />
pressure on interest rate towards year-end, the bank’s<br />
average cost of funds came in at 3.3% (one of the<br />
lowest in the market). Of the total deposits, retail<br />
constituted 29%, while corporates and interbank<br />
borrowings made up 67.7% and 3.3% respectively.<br />
The bank displayed a moderately concentrated<br />
liability pool with the single and twenty largest<br />
deposits, accounting for 5.3% and 14.3% of the<br />
combined pool. By maturity, a significant portion of<br />
the bank’s funding is concentrated in the less than 1-<br />
month bucket. <strong>UBA</strong> has forecasted a 39% growth in<br />
deposits for F13, driven largely by its enhanced retail<br />
initiatives and other products.<br />
Table 3: Deposit Book Characteristics<br />
By type: % %<br />
Demand 29.0 Term 51.6<br />
Savings 16.1 Interbank borrowings 3.3<br />
Concentration:<br />
Single largest 5.3 Ten largest 12.3<br />
Five largest 9.7 Twenty largest 14.3<br />
Maturity:<br />
12 months 3.8<br />
Source: AFS.<br />
Deposits were conserved in F12, with a larger<br />
percentage invested in high interest yielding assets<br />
(mainly money market securities), thus accounting<br />
for the low loan to deposits ratio of 38%.<br />
Capital and money market funding:<br />
Underpinned by retained earnings, <strong>UBA</strong>’s Tier 1<br />
capital grew by 27.5% to N192.5bn, bringing the<br />
total (absolute) capital to assets ratio up to 8.5%.<br />
Furthermore, the bank’s risk weighted capital<br />
adequacy ratio improved to 23.5% in F12 (F11:<br />
21.7%), ending well above the prudential<br />
requirement of 15% for an international bank.<br />
The bank’s Tier-2 capital comprised subordinated<br />
bonds (Series 1 & 2 with 7-years maturity each) of<br />
N53.7bn. The series’ were issued in 2010 and 2011<br />
with a coupon of 13% and 14% respectively, being<br />
part of the bank’s N400bn Medium Term Note<br />
Programme (“MTN”). Based on the quarterly returns<br />
from trustees, the series’ are duly performing.<br />
The bank’s remaining borrowings stood at N114.5bn<br />
at year-end 2012, comprising on-lending facilities<br />
from the African Development Bank, CBN, Bank of<br />
Industry, AFREXIM, SCB and HSBC, in proportion<br />
20.7%, 31.9%, 12.1%, 12.6%, 21.9% and 0.8%<br />
respectively. Of these facilities, the short-term<br />
funding pool constituted a combined 46.7%.<br />
Table 2: Competitive position*<br />
<strong>UBA</strong> vs. selected banks<br />
Year end 31 December 2012<br />
FBN Zenith <strong>UBA</strong> Access GTBank<br />
Capital (N’bn) 391.1 463.0 246.2 240.3 283.4<br />
Total assets (N’bn)† 3,076.4 2,566.1 2,260.2 1,719.9 1,688.7<br />
Net loans (N’bn) 1,563.0 989.8 687.4 608.6 783.9<br />
Profit after tax (N’bn) 94.4 98.5 55.5 35.1 86.4<br />
Capital/assets (%) 12.7 18.0 10.9 14.0 16.8<br />
Liquid & trading assets/total short-term funding (%) 29.8 49.6 33.0 27.8 46.5<br />
Gross bad debt ratio (%) 2.6 3.1 1.9 5.3 3.3<br />
Net interest margin (%) 10.0 8.6 9.4 11.3 10.3<br />
Cost ratio (%) 65.0 52.4 64.5 61.1 42.6<br />
ROaE (%) 24.5 23.0 32.3 16.2 33.6<br />
ROaA (%) 3.2 4.1 2.7 2.1 5.3<br />
* Ranked by total assets. † Total assets excludes client balances in respect of foreign currency letters of credit.<br />
Nigeria Bank Credit Rating Report | Public Credit Rating Page 3
Liquidity positioning<br />
Though the bank’s liquidity seems reasonably<br />
managed, there was a gap of N571.4bn in the less<br />
than 1-month maturity bucket of the bank’s<br />
contractual maturity profile (equating to 3x capital,<br />
which is considered extremely high and a standard<br />
risk flag under GCR’s methodology). Nevertheless,<br />
the bank covers liquidity shortfalls via its treasury<br />
bills, other short term marketable securities and<br />
available credit lines from other banking institutions.<br />
The liquidity ratio stood at 69.8% at FYE12, well<br />
above the CBN’s minimum requirement of 30%.<br />
Credit risk (strategic overview)<br />
Risk management<br />
Credit risk is inherent in the bank’s loan portfolio,<br />
interbank placements and investments. <strong>UBA</strong>’s credit<br />
risk management processes are considered<br />
satisfactory and appears to be functioning as<br />
intended.<br />
<strong>UBA</strong>’s total assets grew by 19% to N2.3tn in F12.<br />
The asset mix showed a substantial increase in interbank<br />
balances, driven by the high interbank rate<br />
(hence, a lower risk, supportive means to capture<br />
available yield in the market). Furthermore, the<br />
increase in the cash reserve ratio (“CRR”) from 8%<br />
to 12% in F12 saw the mandatory reserve with the<br />
CBN increase by 46% in absolute terms, putting<br />
pressure on the bank’s available funds for lending.<br />
Net advances recorded a lower growth of 6.2%, with<br />
the bank focusing on recovery, while investments<br />
declined by 5.7%. The investment pool (mainly<br />
available for sale and held to maturity investment<br />
securities) is made-up of treasury bills, equity<br />
investments and bonds, mostly risk free assets.<br />
Table 4: Asset Mix<br />
F11<br />
F12<br />
N’bn % N’bn %<br />
Cash & liquid assets* 414.2 21.8 701.9 31.1<br />
Cash 173.2 9.1 162.4 7.2<br />
Liquidity reserve deposits 81.8 4.3 119.7 5.3<br />
Treasury bills and bonds 1.3 0.1 0.5
consideration must be given to the artificial element<br />
associated with the market wide sell-off of bad loans.<br />
Overall, provisioning was adequate, with the arrears<br />
coverage ratio standing at 78.4% (F11: 70.4%).<br />
GCR’s concern, however, is on the sustainability of<br />
the asset quality position as the bank gears up for<br />
loan growth in F13, considering AMCON’s decision<br />
to suspend its uptake of any further loans.<br />
Table 6: Asset Quality (N’bn) F11 F12<br />
Gross advances 672.2 703.4<br />
Loan Classification:<br />
Performing 655.3 690.0<br />
Impaired 16.9 13.4<br />
Provision for impairment (25.0) (16.0)<br />
Individually impaired (13.1) (5.4)<br />
Collectively impaired (11.9) (10.5)<br />
Net NPLs negative negative<br />
Select asset quality ratios:<br />
Gross NPLs ratio (%) 2.5 1.9<br />
Net NPLs ratio (%) negative negative<br />
Net NPLs/Capital (%) negative negative<br />
Source: AFS.<br />
Default losses are moderated by the fact that nearly<br />
the entire book is secured in some form or the other.<br />
However, given the cumbersome judicial process to<br />
liquidate security and the associated time lags, little<br />
credence is given to security in this analysis.<br />
Financial performance and prospects<br />
A 4-year financial synopsis is reflected at the back of<br />
this <strong>report</strong>, supplemented by the commentary below.<br />
Supported by improved asset quality and growth in<br />
non-interest income (with enhanced contributions<br />
from its other African subsidiaries), <strong>UBA</strong>’s gross<br />
earnings grew by 34.2% to N220.1bn (F11:<br />
N163.7bn). Growth in net interest income was driven<br />
by enhanced mobilisation of low-cost funds, as well<br />
as transacting in high-interest yielding assets and<br />
investments. Hence, the bank’s net interest margin<br />
improved to 9.4%.<br />
operating expenses, <strong>UBA</strong>’s focus will be on<br />
streamlining expenses, growing contributions from<br />
all business activities and improving low-cost deposit<br />
mobilisation through value-added products. While<br />
recognising the intensity of the competitive<br />
landscape, going forward, the bank will continue to<br />
build on its transformation agenda to strengthen its<br />
position.<br />
Table 7: Budget vs.<br />
interim results<br />
Actual Budget Actual<br />
F12 F13 1Q- F13<br />
(N’bn) (N’bn) (N’bn)<br />
% of<br />
budget*<br />
Statement of comprehensive income<br />
Net interest income 91.6 99.4 27.2 109.3<br />
Other income 67.5 80.6 17.5 86.7<br />
Total income 159.2 180.0 44.6 99.1<br />
Impairment charge (4.6) (4.0) (0.2) 20.0<br />
Operating expenses (102.6) (96.4) (27.3) 113.3<br />
Profit before tax 52.0 79.7 17.2 86.3<br />
Statement of financial position<br />
Deposits 1,777.8 2,477.1 2,017.0 81.4<br />
Advances 687.4 921.9 664.2 72.1<br />
Total assets 2,272.9 3,225.2 2,434.4 75.5<br />
Tier I capital 192.5 321.6 209.4 65.1<br />
* Annualised. Source: AFS.<br />
Based on budget, <strong>UBA</strong> plans to increase net interest<br />
income by 8.5%, with sizeable growth from noninterest<br />
income. Total operating expenses is expected<br />
to fall with the cost reduction measures, while<br />
impairments will increase on account of loan growth,<br />
leading to a 53.2% rise in pre-tax profit. At 1Q-F13,<br />
pre-tax profit stood at 86%, underperforming the<br />
budget (on an annualised basis). Meanwhile,<br />
deposits, capital and total assets grew by 13.5%,<br />
8.8% and 7.7% respectively but advances fell by<br />
3.4%. While cognisance is taken of the slow<br />
economic activities in every 1Q in Nigeria (due to<br />
uncertainty surrounding budget implementation),<br />
GCR expects earnings to pick-up towards year-end.<br />
With improved earnings from non-interest<br />
transactions, total operating income recorded a 64%<br />
growth. Operating expenses were well managed<br />
across all lines, supported by cost cutting measures<br />
and a reduction in the impairment charge. Thus, the<br />
bank’s cost to income ratio improved to 64.5% in<br />
F12 (F11: 109.1%). Overall, <strong>UBA</strong> recorded an<br />
improved performance, reversing the N1.1bn loss in<br />
F11, to post a total comprehensive income of<br />
N55.5bn in F12. Consequently, RoaA and RoaE<br />
ended up at 2.7% and 32.3% respectively.<br />
As earnings rely mainly on the bank’s ability to<br />
maintain a low cost of funds and minimise its level of<br />
Nigeria Bank Credit Rating Report | Public Credit Rating Page 5
Year end: 31 December<br />
Statement of Comprehensive Income Analysis Dec. 09<br />
NGAAP<br />
Dec. 10 Dec. 11<br />
IFRS<br />
Dec. 11 Dec. 12<br />
Interest income 177 848 117 745 121 422 113 590 150 003<br />
Interest expense (59 659) (46 969) (46 125) (45 423) (58 386)<br />
Net interest income 118 189 70 776 75 297 68 167 91 617<br />
Other income 63 716 67 303 63 402 29 075 67 545<br />
Total operating income 181 905 138 079 138 699 97 242 159 162<br />
Impairment charge (39 839) (18 213) (22 628) (17 738) (4 560)<br />
Operating expenditure (128 404) (103 981) (107 716) (106 104) (102 592)<br />
Exceptional items (7 025) (12 666) (36 851) - -<br />
Net profit before tax 6 637 3 219 (28 496) (26 600) 52 010<br />
Tax (4 262) (2 621) 18 849 17 935 (533)<br />
Net profit after tax 2 375 598 (9 647) (8 665) 51 477<br />
Profit/(loss) from discontinued operations - - - 1 864 3 289<br />
Other after-tax income / (expenses) (262) 70 (827) 5 680 764<br />
Net income 2 113 668 (10 474) (1 121) 55 530<br />
Statement of Financial Position Analysis<br />
Subscribed capital 124 423 124 423 124 423 124 423 124 423<br />
Reserves (incl. net income for the year) 62 406 55 003 45 610 26 517 68 044<br />
Total capital and reserves 186 829 179 426 170 033 150 940 192 467<br />
Bank borrowings (incl. deposits, placements & REPOs) 15 807 7 456 17 201 33 459 111 280<br />
Deposits 1 244 742 1 245 750 1 444 988 1 445 822 1 652 674<br />
Short-term funding (< 1 year) 1 260 549 1 253 206 1 462 189 1 479 281 1 763 954<br />
Deposits 908 21 421 - - 67 334<br />
Other borrowings 14 760 82 144 192 123 53 500 53 719<br />
Long-term funding (> 1 year) 15 668 103 565 192 123 176 591 182 073<br />
Payables/Deferred liabilities 77 779 66 417 97 082 92 257 121 735<br />
Other liabilities 77 779 66 417 97 082 92 257 121 735<br />
Total capital and liabilities 1 540 825 1 602 614 1 921 427 1 899 069 2 260 229<br />
Balances with central bank 13 325 12 262 81 151 81 789 119 697<br />
Property, Plants and Equipments 73 042 65 200 52 852 55 618 70 746<br />
Receivables/Deferred assets (incl. zero rate loans) 60 305 35 331 58 651 59 797 119 353<br />
Non-earnings assets 146 672 112 793 192 654 197 204 309 796<br />
Short-term deposits & cash 35 386 30 442 44 895 173 221 162 353<br />
Loans & advances (net of provisions) 636 793 628 811 689 625 647 191 687 435<br />
Bank placements 481 757 312 542 282 397 157 842 419 371<br />
Marketable/Trading securities 42 035 123 455 175 525 1 303 457<br />
Equity investments 188 407 384 453 525 975 722 308 680 817<br />
Investments in subsidiaries/associates 9 775 10 118 10 356 - -<br />
Total earning assets 1 394 153 1 489 821 1 728 773 1 701 865 1 950 433<br />
Total assets 1 540 825 1 602 614 1 921 427 1 899 069 2 260 229<br />
Contingencies 689 479 654 360 952 798 372 047 401 312<br />
Ratio Analysis (%)<br />
Capitalisation<br />
Internal capital generation 1.1 0.4 n.a. n.a. 28.9<br />
Total capital / Net advances + net equity invest. + guarantees 12.3 10.8 7.8 8.7 10.9<br />
Total capital / Total assets 12.1 11.2 8.8 7.9 8.5<br />
Liquidity†<br />
Net advances / Deposits + other short-term funding 50.5 49.3 47.2 43.8 37.5<br />
Net advances / Total funding (excl. equity portion) 49.9 46.3 41.7 39.1 35.3<br />
Liquid & trading assets / Total assets 36.3 29.1 26.2 17.5 25.8<br />
Liquid & trading assets / Total short-term funding 44.4 37.2 34.4 22.5 33.0<br />
Liquid & trading assets / Total funding (excl. equity portion) 43.8 34.4 30.4 20.1 29.9<br />
Liquid & trading assets / Total contingencies (x cover) 44.4 37.2 34.4 22.5 33.0<br />
Asset quality<br />
Impaired loans / Gross advances 7.9 8.8 3.7 2.5 1.9<br />
Total loan loss reserves / Gross advances 6.3 6.7 3.5 3.7 2.3<br />
Bad debt charge (income statement) / Gross advances (avg.) 7.2 2.8 3.4 2.7 0.7<br />
Bad debt charge (income statement) / Total operating income 21.9 13.2 16.3 18.2 2.9<br />
Profitability<br />
Net income / Total capital (avg.) 1.1 0.4 n.a. n.a. 32.3<br />
Net income / Total assets (avg.) 0.1 0.0 n.a. n.a. 2.7<br />
Net interest margin 7.5 6.1 6.6 7.0 9.4<br />
Interest income + com. fees / Earning assets + guarantees (a/avg.) 6.3 3.8 3.7 2.4 5.7<br />
Non-interest income / Total operating income 35.0 48.7 45.7 29.9 42.4<br />
Non-interest income / Total operating expenses (or burden ratio) 49.6 64.7 58.9 27.4 65.8<br />
Cost ratio 70.6 75.3 77.7 109.1 64.5<br />
OEaA (or overhead ratio) 8.4 6.6 6.1 6.1 4.9<br />
ROaE 3.9 7.3 15.1 (0.7) 32.3<br />
ROaA 0.5 0.8 1.5 (0.1) 2.7<br />
Nominal growth indicators<br />
Total assets 1.8 4.0 19.9 18.5 19.0<br />
Net advances 51.0 (1.3) 9.7 2.9 6.2<br />
Shareholders funds (0.7) (4.0) (5.2) (15.9) 27.5<br />
Total capital and reserves (0.7) (4.0) (5.2) (15.9) 27.5<br />
Deposits (wholesale) (1.0) 1.7 14.0 14.1 19.0<br />
Total funding (excl. equity portion) 1.4 6.3 21.9 22.0 17.5<br />
Net income 95.8 (60.5) (1 668.0) (267.8) 5 053.6<br />
† Please note that for these raos, liquid assets exclude the statutory reserve balance<br />
United Bank for Africa <strong>Plc</strong><br />
(Naira in millions except as noted)<br />
Nigeria Bank Credit Rating Report | Public Credit Rating Page 6
SALIENT FEATURES OF ACCORDED RATINGS<br />
GCR affirms that a.) no part of the rating was influenced by any other business activities of the credit rating agency; b.) the rating was<br />
based solely on the merits of the rated entity, security or financial instrument being rated; c.) such rating was an independent evaluation of<br />
the risks and merits of the rated entity, security or financial instrument; and d.) the validity of the rating is for a maximum of 12 months, or<br />
earlier as indicated by the applicable credit rating document.<br />
The ratings were solicited by, or on behalf of, United Bank for Africa <strong>Plc</strong>, and therefore, GCR has been compensated for the provision of the<br />
ratings.<br />
United Bank for Africa <strong>Plc</strong> participated in the rating process via face-to-face management meetings, teleconferences and other written<br />
correspondence. Furthermore, the quality of info received was considered adequate and has been independently verified where possible.<br />
The credit ratings above were disclosed to United Bank for Africa <strong>Plc</strong> with no contestation of/changes to the ratings.<br />
The information received from United Bank for Africa <strong>Plc</strong> and other reliable third parties to accord the credit rating included the latest<br />
audited annual financial statements (plus four years of comparative numbers), latest internal and/or external <strong>report</strong> to management, full<br />
year detailed budgeted financial statements, most recent year-to-date management accounts, reserving methodologies and capital<br />
management policies. In addition, information specific to the rated entity and/or industry was also received.<br />
ALL GCR CREDIT RATINGS ARE SUBJECT TO CERTAIN LIMITATIONS, TERMS OF USE OF SUCH RATINGS AND<br />
DISCLAIMERS. PLEASE READ THESE LIMITATIONS, TERMS OF USE AND DISCLAIMERS BY FOLLOWING THIS LINK:<br />
HTTP://GLOBALRATINGS.NET/UNDERSTANDINGRATINGS. IN ADDITION, RATING SCALES AND DEFINITIONS ARE<br />
AVAILABLE ON GCR’S PUBLIC WEB SITE AT HTTP://GLOBALRATINGS.NET/RATINGSINFORMATION. PUBLISHED<br />
RATINGS, CRITERIA, AND METHODOLOGIES ARE AVAILABLE FROM THIS SITE AT ALL TIMES. GCR'S CODE OF<br />
CONDUCT, CONFIDENTIALITY, CONFLICTS OF INTEREST, COMPLIANCE, AND OTHER RELEVANT POLICIES AND<br />
PROCEDURES ARE ALSO AVAILABLE FROM THE UNDERSTANDING RATINGS SECTION OF THIS SITE.<br />
CREDIT RATINGS ISSUED AND RESEARCH PUBLICATIONS PUBLISHED BY GCR, ARE GCR’S OPINIONS, AS AT THE<br />
DATE OF ISSUE OR PUBLICATION THEREOF, OF THE RELATIVE FUTURE CREDIT RISK OF ENTITIES, CREDIT<br />
COMMITMENTS, OR DEBT OR DEBT-LIKE SECURITIES. GCR DEFINES CREDIT RISK AS THE RISK THAT AN ENTITY<br />
MAY NOT MEET ITS CONTRACTUAL AND/OR FINANCIAL OBLIGATIONS AS THEY BECOME DUE. CREDIT RATINGS<br />
DO NOT ADDRESS ANY OTHER RISK, INCLUDING BUT NOT LIMITED TO: FRAUD, MARKET LIQUIDITY RISK, MARKET<br />
VALUE RISK, OR PRICE VOLATILITY. CREDIT RATINGS AND GCR’S OPINIONS INCLUDED IN GCR’S PUBLICATIONS<br />
ARE NOT STATEMENTS OF CURRENT OR HISTORICAL FACT. CREDIT RATINGS AND GCR’S PUBLICATIONS DO NOT<br />
CONSTITUTE OR PROVIDE INVESTMENT OR FINANCIAL ADVICE, AND CREDIT RATINGS AND GCR’S PUBLICATIONS<br />
ARE NOT AND DO NOT PROVIDE RECOMMENDATIONS TO PURCHASE, SELL OR HOLD PARTICULAR SECURITIES.<br />
NEITHER GCR’S CREDIT RATINGS, NOR ITS PUBLICATIONS, COMMENT ON THE SUITABILITY OF AN INVESTMENT<br />
FOR ANY PARTICULAR INVESTOR. GCR ISSUES ITS CREDIT RATINGS AND PUBLISHES GCR’S PUBLICATIONS WITH<br />
THE EXPECTATION AND UNDERSTANDING THAT EACH INVESTOR WILL MAKE ITS OWN STUDY AND EVALUATION<br />
OF EACH SECURITY THAT IS UNDER CONSIDERATION FOR PURCHASE, HOLDING OR SALE.<br />
Copyright © 2013 Global Credit Rating Co (Pty) Ltd. THE INFORMATION CONTAINED HEREIN MAY NOT BE COPIED<br />
OR OTHERWISE REPRODUCED OR DISCLOSED , IN WHOLE OR IN PART, IN ANY FORM OR MANNER OR BY ANY<br />
MEANS WHATSOEVER, BY ANY PERSON WITHOUT GCR’S PRIOR WRITTEN CONSENT. The ratings were solicited<br />
by, or on behalf of, the issuer of the instrument in respect of which the rating is issued, and GCR has been<br />
compensated for the provision of the ratings. Information sources used to prepare the ratings are set out in each<br />
credit rating <strong>report</strong> and/or rating notification and include the following: parties involved in the ratings and public<br />
information. All information used to prepare the ratings is obtained by GCR from sources reasonably believed by<br />
it to be accurate and reliable. Although GCR will at all times use its best efforts and practices to ensure that the<br />
information it relies on is accurate at the time, GCR does not provide any warranty in respect of, nor is it<br />
otherwise responsible for, the accurateness of such information. GCR adopts all reasonable measures to ensure<br />
that the information it uses in assigning a credit rating is of sufficient quality and that such information is<br />
obtained from sources that GCR, acting reasonably, considers to be reliable, including, when appropriate,<br />
independent third-party sources. However, GCR cannot in every instance independently verify or validate<br />
information received in the rating process. Under no circumstances shall GCR have any liability to any person or<br />
entity for (a) any loss or damage suffered by such person or entity caused by, resulting from, or relating to, any<br />
error made by GCR, whether negligently (including gross negligence) or otherwise, or other circumstance or<br />
contingency outside the control of GCR or any of its directors, officers, employees or agents in connection with<br />
the procurement, collection, compilation, analysis, interpretation, communication, publication or delivery of any<br />
such information, or (b) any direct, indirect, special, consequential, compensatory or incidental damages<br />
whatsoever (including without limitation, lost profits) suffered by such person or entity, as a result of the use of<br />
or inability to use any such information. The ratings, financial <strong>report</strong>ing analysis, projections, and other<br />
observations, if any, constituting part of the information contained herein are, and must be construed solely as,<br />
statements of opinion and not statements of fact or recommendations to purchase, sell or hold any securities.<br />
Each user of the information contained herein must make its own study and evaluation of each security it may<br />
consider purchasing, holding or selling. NO WARRANTY, EXPRESS OR IMPLIED, AS TO THE ACCURACY,<br />
TIMELINESS, COMPLETENESS, MERCHANTABILITY OR FITNESS FOR ANY PARTICULAR PURPOSE OF ANY SUCH<br />
RATING OR OTHER OPINION OR INFORMATION IS GIVEN OR MADE BY GCR IN ANY FORM<br />
OR MANNER WHATSOEVER.<br />
Nigeria Bank Credit Rating Report | Public Credit Rating Page 7
GCR<br />
GLOBAL CREDIT RATING CO.<br />
Local Expertise • Global Presence<br />
RATING DEFINITIONS<br />
Long term debt<br />
Investment grade<br />
AAA Highest credit quality. The risk factors are negligible,<br />
being only slightly more than for risk free<br />
government bonds.<br />
AA+<br />
AA<br />
AA-<br />
A+<br />
A<br />
A-<br />
BBB+<br />
BBB<br />
BBB-<br />
Very high credit quality. Protection factors are very<br />
strong. Adverse changes in business, economic or<br />
financial conditions would increase investment risk,<br />
although not significantly.<br />
High credit quality. Protection factors are good.<br />
However, risk factors are more variable and greater in<br />
periods of economic stress.<br />
Adequate protection factors and considered sufficient<br />
for prudent investment. However, there is<br />
considerable variability in risk during economic<br />
cycles.<br />
Non-investment grade<br />
BB+<br />
BB<br />
BB-<br />
B+<br />
B<br />
B-<br />
Below investment grade but capacity for timely<br />
repayment exists. Present or prospective financial<br />
protection factors fluctuate according to industry<br />
conditions or company fortunes. Overall quality may<br />
move up or down frequently within this category.<br />
Below investment grade and possessing risk that<br />
obligations will not be met when due. Financial<br />
protection factors will fluctuate widely according to<br />
economic cycles, industry conditions and/or company<br />
fortunes.<br />
CCC Well below investment grade securities.<br />
Considerable uncertainty exists as to timely payment<br />
of principal or interest. Protection factors are narrow<br />
and risk can be substantial with unfavourable<br />
economic/industry conditions, and/or with<br />
unfavourable company developments.<br />
DD<br />
Short term debt<br />
High Grade<br />
Defaulted debt obligations. Issuer failed to meet<br />
scheduled principal and/or<br />
Interest payments.<br />
A1+ Highest certainty of timely payment. Short-term<br />
liquidity, including internal operating factors and/or<br />
access to alternative sources of funds, is outstanding,<br />
and safety is just below that of risk-free treasury bills.<br />
A1 Very high certainty of timely payment. Liquidity<br />
factors are excellent and supported by good<br />
fundamental protection factors. Risk factors are<br />
minor.<br />
Good Grade<br />
A1- High certainty of timely payment. Liquidity factors<br />
are strong and<br />
GLOBAL supported by good fundamental<br />
CREDIT RATING CO.<br />
protection factors. Risk factors are very small.<br />
A2<br />
Satisfactory Grade<br />
A3<br />
Good certainty of timely payment. Liquidity factors<br />
and company fundamentals are sound. Although<br />
ongoing funding needs may enlarge total financing<br />
requirements, access to capital markets is good. Risk<br />
factors are small.<br />
Satisfactory liquidity and other protection factors<br />
qualify issues as to investment grade However, risk<br />
factors are larger and subject to greater variation.<br />
Non-investment Grade<br />
B<br />
Default<br />
C<br />
Speculative investment characteristics. Liquidity is<br />
not sufficient to insure against disruption in debt<br />
service. Operating factors and market access may be<br />
subject to a high degree of variation<br />
Issuer failed to meet scheduled principal or interest<br />
payments.<br />
Claims paying ability<br />
Secure<br />
AAA<br />
AA+<br />
AA<br />
AA-<br />
A+<br />
A<br />
A-<br />
BBB+<br />
BBB<br />
BBB-<br />
BB+<br />
BB<br />
BB-<br />
B+<br />
B<br />
B-<br />
CCC<br />
E-mail<br />
www.globalratings.net<br />
P.O. Box 76667,<br />
: hotline@globlaratings.net<br />
Tel :(+2711) 784-1771<br />
Wendywood, 2144, South Africa<br />
• Fax :(+2711) 784-1770<br />
Highest claims paying ability. The risk factors are<br />
negligible.<br />
Very high claims paying ability. Protection factors<br />
are strong. Risk is modest, but may vary slightly over<br />
time due to economic and/or underwriting conditions.<br />
High claims paying ability. Protection factors are<br />
above average although there is an expectation of<br />
variability in risk over time due to economic and/or<br />
underwriting conditions.<br />
Adequate claims paying ability. Protection factors<br />
are adequate although there is considerable variability<br />
in risk over time due to economic and/or underwriting<br />
conditions.<br />
Uncertain claims paying ability and less than<br />
investment grade quality. The ability of these<br />
organisations to discharge obligations is considered<br />
moderate and thereby not well safeguarded in the<br />
future. Protection factors will vary widely with<br />
changes in economic and/or underwriting conditions.<br />
Possessing substantial risk that policyholder and<br />
contract-holder obligations will not be paid when due.<br />
Judged to be speculative to a high degree.<br />
Company has been, or is likely to be, placed under an<br />
order of the court.


