About Guggenheim Investments - Security Benefit Agent
About Guggenheim Investments - Security Benefit Agent
About Guggenheim Investments - Security Benefit Agent

You also want an ePaper? Increase the reach of your titles
YUMPU automatically turns print PDFs into web optimized ePapers that Google loves.
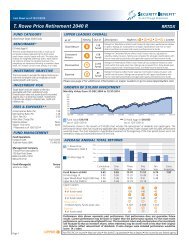
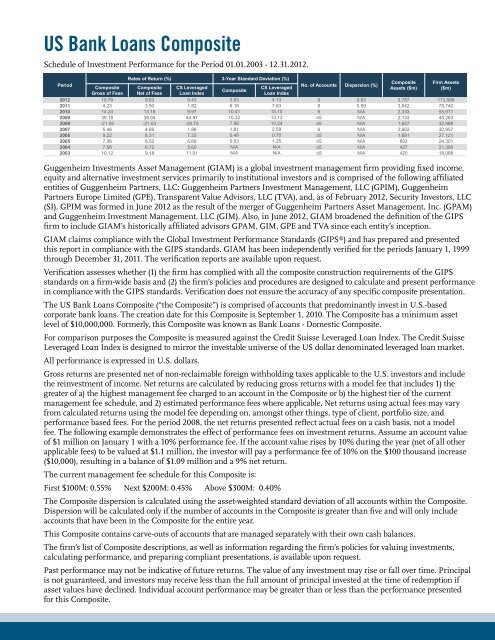
US Bank Loans Composite<br />
Schedule of Investment Performance for the Period 01.01.2003 - 12.31.2012.<br />
Period<br />
Composite<br />
Gross of Fees<br />
Rates of Return (%) 3-Year Standard Deviation (%)<br />
Composite<br />
Net of Fees<br />
CS Leveraged<br />
Loan Index<br />
Composite<br />
CS Leveraged<br />
Loan Index<br />
No. of Accounts Dispersion (%)<br />
Composite<br />
Assets ($m)<br />
Firm Assets<br />
($m)<br />
2012 10.79 9.83 9.43 3.63 4.13 9 0.63 3,787 113,588<br />
2011 4.23 3.50 1.82 6.18 7.63 8 0.59 3,642 75,740<br />
2010 14.24 13.16 9.97 10.41 13.10 6 N/A 2,333 55,911<br />
2009 39.18 38.04 44.87 10.32 13.12 ≤5 N/A 2,133 45,263<br />
2008 -21.05 -21.63 -28.75 7.98 10.24 ≤5 N/A 1,657 32,988<br />
2007 5.46 4.69 1.88 1.81 2.59 6 N/A 2,662 30,957<br />
2006 9.22 8.31 7.33 0.49 0.70 ≤5 N/A 1,891 27,121<br />
2005 7.36 6.52 5.69 0.63 1.25 ≤5 N/A 893 24,301<br />
2004 7.56 6.72 5.60 N/A N/A ≤5 N/A 427 21,390<br />
2003 10.12 9.18 11.01 N/A N/A ≤5 N/A 420 18,088<br />
<strong>Guggenheim</strong> <strong>Investments</strong> Asset Management (GIAM) is a global investment management firm providing fixed income,<br />
equity and alternative investment services primarily to institutional investors and is comprised of the following affiliated<br />
entities of <strong>Guggenheim</strong> Partners, LLC: <strong>Guggenheim</strong> Partners Investment Management, LLC (GPIM), <strong>Guggenheim</strong><br />
Partners Europe Limited (GPE), Transparent Value Advisors, LLC (TVA), and, as of February 2012, <strong>Security</strong> Investors, LLC<br />
(SI). GPIM was formed in June 2012 as the result of the merger of <strong>Guggenheim</strong> Partners Asset Management, Inc. (GPAM)<br />
and <strong>Guggenheim</strong> Investment Management, LLC (GIM). Also, in June 2012, GIAM broadened the definition of the GIPS<br />
firm to include GIAM’s historically affiliated advisors GPAM, GIM, GPE and TVA since each entity’s inception.<br />
GIAM claims compliance with the Global Investment Performance Standards (GIPS ® ) and has prepared and presented<br />
this report in compliance with the GIPS standards. GIAM has been independently verified for the periods January 1, 1999<br />
through December 31, 2011. The verification reports are available upon request.<br />
Verification assesses whether (1) the firm has complied with all the composite construction requirements of the GIPS<br />
standards on a firm-wide basis and (2) the firm’s policies and procedures are designed to calculate and present performance<br />
in compliance with the GIPS standards. Verification does not ensure the accuracy of any specific composite presentation.<br />
The US Bank Loans Composite (“the Composite”) is comprised of accounts that predominantly invest in U.S.-based<br />
corporate bank loans. The creation date for this Composite is September 1, 2010. The Composite has a minimum asset<br />
level of $10,000,000. Formerly, this Composite was known as Bank Loans - Domestic Composite.<br />
For comparison purposes the Composite is measured against the Credit Suisse Leveraged Loan Index. The Credit Suisse<br />
Leveraged Loan Index is designed to mirror the investable universe of the US dollar denominated leveraged loan market.<br />
All performance is expressed in U.S. dollars.<br />
Gross returns are presented net of non-reclaimable foreign withholding taxes applicable to the U.S. investors and include<br />
the reinvestment of income. Net returns are calculated by reducing gross returns with a model fee that includes 1) the<br />
greater of a) the highest management fee charged to an account in the Composite or b) the highest tier of the current<br />
management fee schedule, and 2) estimated performance fees where applicable. Net returns using actual fees may vary<br />
from calculated returns using the model fee depending on, amongst other things, type of client, portfolio size, and<br />
performance based fees. For the period 2008, the net returns presented reflect actual fees on a cash basis, not a model<br />
fee. The following example demonstrates the effect of performance fees on investment returns. Assume an account value<br />
of $1 million on January 1 with a 10% performance fee. If the account value rises by 10% during the year (net of all other<br />
applicable fees) to be valued at $1.1 million, the investor will pay a performance fee of 10% on the $100 thousand increase<br />
($10,000), resulting in a balance of $1.09 million and a 9% net return.<br />
The current management fee schedule for this Composite is:<br />
First $100M: 0.55% Next $200M: 0.45% Above $300M: 0.40%<br />
The Composite dispersion is calculated using the asset-weighted standard deviation of all accounts within the Composite.<br />
Dispersion will be calculated only if the number of accounts in the Composite is greater than five and will only include<br />
accounts that have been in the Composite for the entire year.<br />
This Composite contains carve-outs of accounts that are managed separately with their own cash balances.<br />
The firm’s list of Composite descriptions, as well as information regarding the firm’s policies for valuing investments,<br />
calculating performance, and preparing compliant presentations, is available upon request.<br />
Past performance may not be indicative of future returns. The value of any investment may rise or fall over time. Principal<br />
is not guaranteed, and investors may receive less than the full amount of principal invested at the time of redemption if<br />
asset values have declined. Individual account performance may be greater than or less than the performance presented<br />
for this Composite.