1 ILLUSTRATION OF RESEARCH RESULTS Tables A title ... - SAMK
1 ILLUSTRATION OF RESEARCH RESULTS Tables A title ... - SAMK
1 ILLUSTRATION OF RESEARCH RESULTS Tables A title ... - SAMK

You also want an ePaper? Increase the reach of your titles
YUMPU automatically turns print PDFs into web optimized ePapers that Google loves.
2<br />
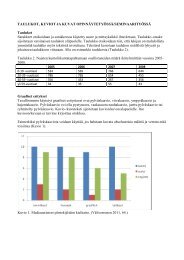
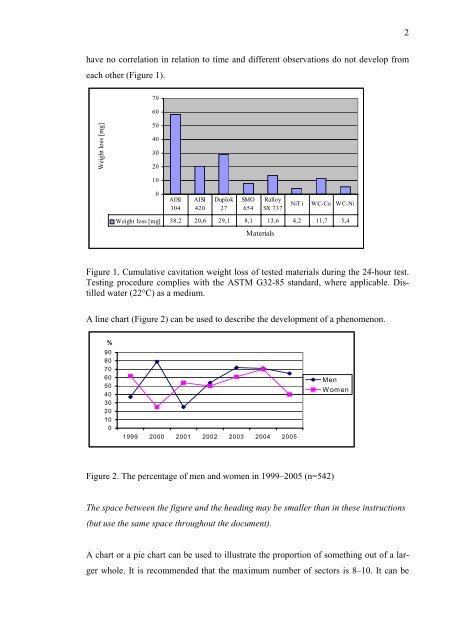
have no correlation in relation to time and different observations do not develop from<br />
each other (Figure 1).<br />
70<br />
60<br />
Weight loss [mg]<br />
50<br />
40<br />
30<br />
20<br />
10<br />
0<br />
AISI<br />
304<br />
AISI<br />
420<br />
Duplok<br />
27<br />
SMO<br />
654<br />
Ralloy<br />
SX 737<br />
NiTi WC-Co WC-Ni<br />
Weight loss [mg] 58,2 20,6 29,1 8,1 13,6 4,2 11,7 5,4<br />
Materials<br />
Figure 1. Cumulative cavitation weight loss of tested materials during the 24-hour test.<br />
Testing procedure complies with the ASTM G32-85 standard, where applicable. Distilled<br />
water (22°C) as a medium.<br />
A line chart (Figure 2) can be used to describe the development of a phenomenon.<br />
%<br />
90<br />
80<br />
70<br />
60<br />
50<br />
40<br />
30<br />
20<br />
10<br />
0<br />
1999 2000 2001 2002 2003 2004 2005<br />
Men<br />
Women<br />
Figure 2. The percentage of men and women in 1999–2005 (n=542)<br />
The space between the figure and the heading may be smaller than in these instructions<br />
(but use the same space throughout the document).<br />
A chart or a pie chart can be used to illustrate the proportion of something out of a larger<br />
whole. It is recommended that the maximum number of sectors is 8–10. It can be