1 ILLUSTRATION OF RESEARCH RESULTS Tables A title ... - SAMK
1 ILLUSTRATION OF RESEARCH RESULTS Tables A title ... - SAMK
1 ILLUSTRATION OF RESEARCH RESULTS Tables A title ... - SAMK

You also want an ePaper? Increase the reach of your titles
YUMPU automatically turns print PDFs into web optimized ePapers that Google loves.
1<br />
<strong>ILLUSTRATION</strong> <strong>OF</strong> <strong>RESEARCH</strong> <strong>RESULTS</strong><br />
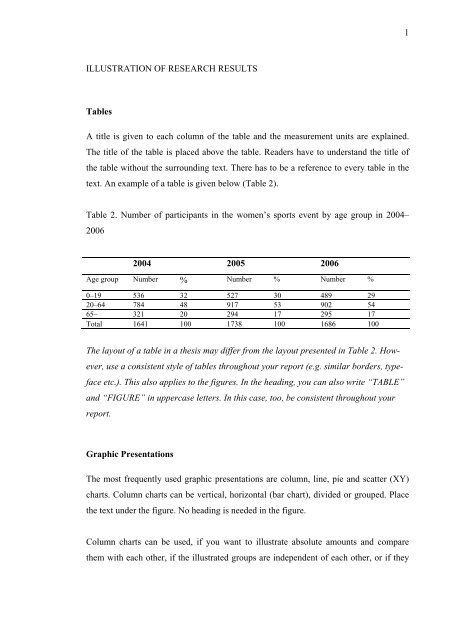
<strong>Tables</strong><br />
A <strong>title</strong> is given to each column of the table and the measurement units are explained.<br />
The <strong>title</strong> of the table is placed above the table. Readers have to understand the <strong>title</strong> of<br />
the table without the surrounding text. There has to be a reference to every table in the<br />
text. An example of a table is given below (Table 2).<br />
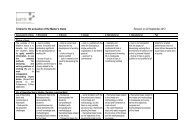
Table 2. Number of participants in the women’s sports event by age group in 2004–<br />
2006<br />
2004 2005 2006<br />
Age group Number % Number % Number %<br />
0–19 536 32 527 30 489 29<br />
20–64 784 48 917 53 902 54<br />
65– 321 20 294 17 295 17<br />
Total 1641 100 1738 100 1686 100<br />
The layout of a table in a thesis may differ from the layout presented in Table 2. However,<br />
use a consistent style of tables throughout your report (e.g. similar borders, typeface<br />
etc.). This also applies to the figures. In the heading, you can also write “TABLE”<br />
and “FIGURE” in uppercase letters. In this case, too, be consistent throughout your<br />
report.<br />
Graphic Presentations<br />
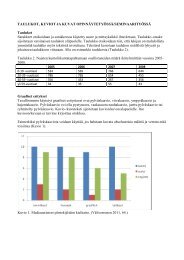
The most frequently used graphic presentations are column, line, pie and scatter (XY)<br />
charts. Column charts can be vertical, horizontal (bar chart), divided or grouped. Place<br />
the text under the figure. No heading is needed in the figure.<br />
Column charts can be used, if you want to illustrate absolute amounts and compare<br />
them with each other, if the illustrated groups are independent of each other, or if they
2<br />
have no correlation in relation to time and different observations do not develop from<br />
each other (Figure 1).<br />
70<br />
60<br />
Weight loss [mg]<br />
50<br />
40<br />
30<br />
20<br />
10<br />
0<br />
AISI<br />
304<br />
AISI<br />
420<br />
Duplok<br />
27<br />
SMO<br />
654<br />
Ralloy<br />
SX 737<br />
NiTi WC-Co WC-Ni<br />
Weight loss [mg] 58,2 20,6 29,1 8,1 13,6 4,2 11,7 5,4<br />
Materials<br />
Figure 1. Cumulative cavitation weight loss of tested materials during the 24-hour test.<br />
Testing procedure complies with the ASTM G32-85 standard, where applicable. Distilled<br />
water (22°C) as a medium.<br />
A line chart (Figure 2) can be used to describe the development of a phenomenon.<br />
%<br />
90<br />
80<br />
70<br />
60<br />
50<br />
40<br />
30<br />
20<br />
10<br />
0<br />
1999 2000 2001 2002 2003 2004 2005<br />
Men<br />
Women<br />
Figure 2. The percentage of men and women in 1999–2005 (n=542)<br />
The space between the figure and the heading may be smaller than in these instructions<br />
(but use the same space throughout the document).<br />
A chart or a pie chart can be used to illustrate the proportion of something out of a larger<br />
whole. It is recommended that the maximum number of sectors is 8–10. It can be
3<br />
difficult to perceive small, 1–2% sectors in a black and white printout and therefore they<br />
should be avoided. Sectors are added to the graph starting clockwise at 12 o’clock. The<br />
sectors are added in the order of importance.<br />
Photographs are presented in the same way as figures. Place the text under the photo<br />
(e.g. Photograph 1). Number the photographs separately throughout the report. If the<br />
photograph is not taken by the author of the thesis, its origin must be indicated and a<br />
permission to publish it must be obtained from the photographer or the owner of the<br />
photograph.<br />
Photograph 1. Stone bridge across the Kokemäki river (photo taken by Ritva Annala).<br />
Other ways to illustrate the results<br />
For example, if interviews or diaries are used as research data, the results can be illustrated<br />
by using direct quotes selected from the data. The quotes are written in italics<br />
with line spacing one, indented with one tabulator.<br />
Example:<br />
The interviewee recalls having thought first that he would not be suitable for this kind<br />
of task. However, he plucked up his courage, went to the job interview and was chosen<br />
for the job. He took up a new challenging job and does not regret the choice he made.<br />
Sure, it has been the best thing that ever happened to me in the working<br />
life! It has surpassed my every expectation. There has not been a single<br />
morning when I did not feel like leaving for work.
4<br />
This document is an almost direct extract from the former instructions for writing a thesis, and it is written by Hanna<br />
Hyttinen, Paula Asikainen, Heli Mattila, Markku Salonen, Erja Turunen and Jaana Simula.