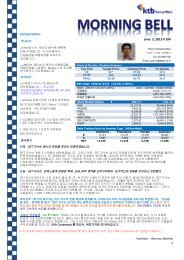
SET:CSS - KTB Securities (Thailand) Co.,Ltd.
SET:CSS - KTB Securities (Thailand) Co.,Ltd.
SET:CSS - KTB Securities (Thailand) Co.,Ltd.

Create successful ePaper yourself
Turn your PDF publications into a flip-book with our unique Google optimized e-Paper software.
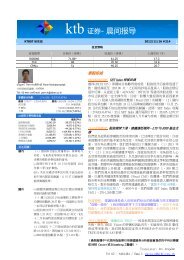
Index Values<br />
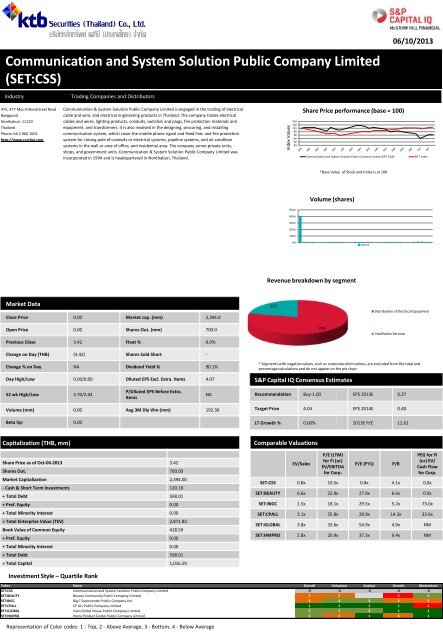
<strong>Co</strong>mmunication and System Solution Public <strong>Co</strong>mpany Limited<br />
(<strong>SET</strong>:<strong>CSS</strong>)<br />
Industry<br />
Trading <strong>Co</strong>mpanies and Distributors<br />
06/10/2013<br />
475, 477 Moo 9 Bondstreet Road <strong>Co</strong>mmunication & System Solution Public <strong>Co</strong>mpany Limited is engaged in the trading of electrical<br />
Bangpood<br />
cable and wire, and electrical engineering products in <strong>Thailand</strong>. The company trades electrical<br />
Nonthaburi, 11120<br />
cables and wires, lighting products, conduits, switches and plugs, fire protection materials and<br />
<strong>Thailand</strong><br />
equipment, and transformers. It is also involved in the designing, procuring, and installing<br />
Phone: 66 2 960 1001<br />
communication system, which cover the mobile phone signal and fixed line; and fire protection<br />
http://www.cssthai.com system for closing pole of conduits or electrical systems, pipeline systems, and air condition<br />
systems in the wall or area of office, and residential area. The company serves private units,<br />
shops, and government units. <strong>Co</strong>mmunication & System Solution Public <strong>Co</strong>mpany Limited was<br />
incorporated in 1994 and is headquartered in Nonthaburi, <strong>Thailand</strong>.<br />
104<br />
102<br />
100<br />
98<br />
96<br />
94<br />
92<br />
90<br />
Share Price performance (base = 100)<br />
<strong>Co</strong>mmunication and System Solution Public <strong>Co</strong>mpany Limited (<strong>SET</strong>:<strong>CSS</strong>)<br />
<strong>SET</strong> Index<br />
*Base Value of Stock and Index is at 100<br />
Volume (shares)<br />
500m<br />
400m<br />
300m<br />
200m<br />
100m<br />
0m<br />
Volume<br />
Revenue breakdown by segment<br />
Market Data<br />
Close Price 0.00 Market cap. (mm) 2,394.0<br />
Open Price 0.00 Shares Out. (mm) 700.0<br />
Previous Close 3.42 Float % 0.0%<br />
Change on Day (THB) (3.42) Shares Sold Short -<br />
22%<br />
78%<br />
Distribution of Electrical Equipment<br />
Installation Services<br />
Change % on Day NA Dividend Yield % 90.1%<br />
Day High/Low 0.00/0.00 Diluted EPS Excl. Extra. Items 4.07<br />
* Segments with negative values, such as corporate eliminations, are excluded from the total and<br />
percentage calculations and do not appear on the pie chart<br />
S&P Capital IQ <strong>Co</strong>nsensus Estimates<br />
52 wk High/Low 3.70/2.04<br />
P/Diluted EPS Before Extra.<br />
Items<br />
NA<br />
Recommendation Buy-1.00 EPS 2013E 0.27<br />
Volume (mm) 0.00 Avg 3M Dly Vlm (mm) 192.30<br />
Beta 5yr 0.00 <br />
Target Price 4.04 EPS 2014E 0.40<br />
LT Growth % 0.00% 2013E P/E 12.61<br />
Capitalization (THB, mm)<br />
Share Price as of Oct-06-2013 3.42<br />
Shares Out. 700.00<br />
Market Capitalization 2,394.00<br />
- Cash & Short Term Investments 120.18<br />
+ Total Debt 598.01<br />
+ Pref. Equity 0.00<br />
+ Total Minority Interest 0.00<br />
= Total Enterprise Value (TEV) 2,871.83<br />
Book Value of <strong>Co</strong>mmon Equity 418.59<br />
+ Pref. Equity 0.00<br />
+ Total Minority Interest 0.00<br />
+ Total Debt 598.01<br />
= Total Capital 1,016.59<br />
<strong>Co</strong>mparable Valuations<br />
EV/Sales<br />
P/E (LTM)<br />
for FI (or)<br />
EV/EBITDA<br />
for <strong>Co</strong>rp.<br />
P/E (FY1)<br />
P/B<br />
PEG for FI<br />
(or) EV/<br />
Cash Flow<br />
for <strong>Co</strong>rp.<br />
<strong>SET</strong>:<strong>CSS</strong> 0.8x 10.5x 0.8x 4.1x 0.0x<br />
<strong>SET</strong>:BEAUTY 6.6x 22.9x 27.9x 6.6x 0.0x<br />
<strong>SET</strong>:BIGC 1.5x 18.1x 29.5x 5.2x 73.0x<br />
<strong>SET</strong>:CPALL 2.1x 25.8x 28.9x 14.3x 32.6x<br />
<strong>SET</strong>:GLOBAL 3.8x 33.6x 54.9x 4.9x NM<br />
<strong>SET</strong>:HMPRO 2.8x 20.9x 37.3x 9.4x NM<br />
Investment Style – Quartile Rank<br />
Ticker Name Overall Valuation Analyst Growth Momentum<br />
<strong>SET</strong>:<strong>CSS</strong> <strong>Co</strong>mmunication and System Solution Public <strong>Co</strong>mpany Limited -5 -5 -5 -5 -5<br />
<strong>SET</strong>:BEAUTY Beauty <strong>Co</strong>mmunity Public <strong>Co</strong>mpany Limited 3 3 FALSE 4 2<br />
<strong>SET</strong>:BIGC Big C Supercenter Public <strong>Co</strong>mpany <strong>Ltd</strong>. 3 2 2 3 3<br />
<strong>SET</strong>:CPALL CP ALL Public <strong>Co</strong>mpany Limited 1 1 1 1 4<br />
<strong>SET</strong>:GLOBAL Siam Global House Public <strong>Co</strong>mpany Limited 2 2 2 1 1<br />
<strong>SET</strong>:HMPRO Home Product Center Public <strong>Co</strong>mpany Limited 2 3 1 3 1<br />
Representation of <strong>Co</strong>lor codes: 1 - Top, 2 - Above Average, 3 - Bottom, 4 - Below Average
Key Statistics (THB, mm)<br />
Key Statistics<br />
3 Months 3 Months 12 Months 12 Months 0 Months<br />
Mar-31-<br />
2013Q<br />
Mar-31-<br />
2012Q<br />
Dec-31-<br />
2012A<br />
Dec-31-<br />
2011A<br />
Jan-00-<br />
1900A<br />
Total Revenue 840.73 633.48 3,302.11 2,339.39 0.00<br />
Growth Over Prior<br />
Year<br />
32.7% 0.0% 41.2% 0.0% 0.0%<br />
Total Expenditure 64.03 59.73 250.36 218.82 0.00<br />
EBITDA 66.22 36.95 245.22 108.22 0.00<br />
EBIT 62.00 33.00 228.57 92.32 0.00<br />
Net income 44.23 20.47 158.27 40.36 0.00<br />
Diluted EPS Excl.<br />
Extra. Items<br />
YOY % Change<br />
Diluted EPS Excl.<br />
Extra. Items<br />
Total Cash and ST<br />
investments<br />
Total current<br />
assets<br />
0.11 0.05 3.96 1.01 0.00<br />
106.3% 0.0% 292.5% 0.0% 0.0%<br />
120.18 17.16 60.26 17.16 0.00<br />
1603.31 0.00 1695.30 919.23 0.00<br />
Net PPE 261.96 0.00 116.80 97.65 0.00<br />
Total Assets 2067.97 0.00 1987.41 1160.15 0.00<br />
Total Current<br />
Liabilities<br />
1623.27 0.00 1550.80 872.93 0.00<br />
Short term debt 576.99 0.00 437.07 360.86 0.00<br />
Long term debt 4.25 0.00 6.21 13.81 0.00<br />
Gross Profit<br />
Margin (%)<br />
Net Income<br />
Margin (%)<br />
3 Months 3 Months 12 Months 12 Months 0 Months<br />
Mar-31-<br />
2013Q<br />
Mar-31-<br />
2012Q<br />
Dec-31-2012A Dec-31-2011A Jan-00-1900A<br />
14.99% 14.64% 14.50% 13.30% 0.00%<br />
5.26% 3.23% 4.79% 1.73% 0.00%<br />
ROE(%) 0.00% 0.00% 47.40% 0.00% 0.00%<br />
ROA(%) 0.00% 0.00% 9.08% 0.00% 0.00%<br />
ROCE(%),<br />
Return on<br />
capital<br />
employed<br />
Total Asset<br />
Turnover<br />
Fixed Asset<br />
Turnover<br />
Inventory<br />
Turnover<br />
0.00% 0.00% 18.90% 0.00% 0.00%<br />
0.00x 0.00x 2.10x 0.00x 0.00x<br />
0.00x 0.00x 30.80x 0.00x 0.00x<br />
0.00x 0.00x 11.64x 0.00x 0.00x<br />
Current Ratio 0.99x 0.00x 1.09x 1.05x 0.00x<br />
Quick Ratio 0.76x 0.00x 0.90x 0.80x 0.00x<br />
Cash<br />
<strong>Co</strong>nversion<br />
Cycle (Days)<br />
EBIT Interest<br />
<strong>Co</strong>verage<br />
EBITDA<br />
Interest<br />
<strong>Co</strong>verage<br />
0.00 0.00 64.72 0.00 0.00<br />
8.63x 6.01x 11.35x 3.54x 0.00x<br />
9.22x 6.73x 12.18x 4.15x 0.00x<br />
Debt/Equity 1.43x 1.47x 1.13x 1.47x 0.00x<br />
Total Liabilities 1649.39 0.00 1579.99 899.81 0.00<br />
<strong>Co</strong>mmon Stock &<br />
APIC<br />
250.00 0.00 200.00 200.00 0.00<br />
Minority Interest 0.00 0.00 0.00 0.00 0.00<br />
Preferred Stock 0 0 0 0 0<br />
Total Equity 418.59 260.35 407.42 260.35 0.00<br />
Key Developments<br />
Top Holders<br />
Date/Time<br />
Aug-30-2013<br />
Aug-30-2013<br />
Mar-26-2013<br />
Key Development<br />
<strong>Co</strong>mmunication and System Solution Public <strong>Co</strong>mpany Limited Reports <strong>Co</strong>nsolidated and<br />
<strong>Co</strong>mpany Earnings Results for the Second Quarter and Six Months Ended June 30, 2013<br />
<strong>Co</strong>mmunication And System Solution Public <strong>Co</strong>mpany Limited has completed an IPO in the<br />
amount of THB 600.00 million.<br />
<strong>Co</strong>mmunication And System Solution Public <strong>Co</strong>mpany Limited has filed an IPO.<br />
Holder<br />
<strong>Co</strong>mmon Stock<br />
Equivalent Held<br />
% of Total<br />
Shares<br />
Outstanding<br />
Market Value<br />
(THB mm)<br />
0 0 0.00 0.0<br />
0 0 0.00 0.0<br />
0 0 0.00 0.0<br />
0 0 0.00 0.0<br />
0 0 0.00 0.0<br />
0 0 0.00 0.0<br />
Board Members<br />
Key Executives<br />
Kangsawiwat, Sompong<br />
Sawatwannarat, Panida<br />
Temeesrisuk, Nongnuch<br />
Tiyawattanaroj, Opas<br />
Mekmanee, Kittirat<br />
Chairman and Chief Executive Officer<br />
Chief Financial Officer and Executive Director<br />
Acting Chief Administrative Officer and Executive Director<br />
Chief Telecommunication Officer and Executive Director<br />
Chief Business Officer and Executive Director<br />
Kangsawiwat,<br />
Sompong<br />
Sawatwannarat,<br />
Panida<br />
Temeesrisuk,<br />
Nongnuch<br />
Tiyawattanaroj, Opas<br />
Mekmanee, Kittirat<br />
Chataccaraphat,<br />
Pitiphat<br />
Chairman and Chief Executive Officer<br />
Chief Financial Officer and Executive Director<br />
Acting Chief Administrative Officer and Executive Director<br />
Chief Telecommunication Officer and Executive Director<br />
Chief Business Officer and Executive Director<br />
Independent Director and Chairman of Audit <strong>Co</strong>mmittee<br />
Tharnthong, Banyawake Deputy Chief Telecommunication Officer 2<br />
Source: S&P Capital IQ