The upper and lower limits of the reference range of the QT interval ...
The upper and lower limits of the reference range of the QT interval ...
The upper and lower limits of the reference range of the QT interval ...

Create successful ePaper yourself
Turn your PDF publications into a flip-book with our unique Google optimized e-Paper software.
114 豊 橋 創 造 大 学 紀 要 第 16 号<br />
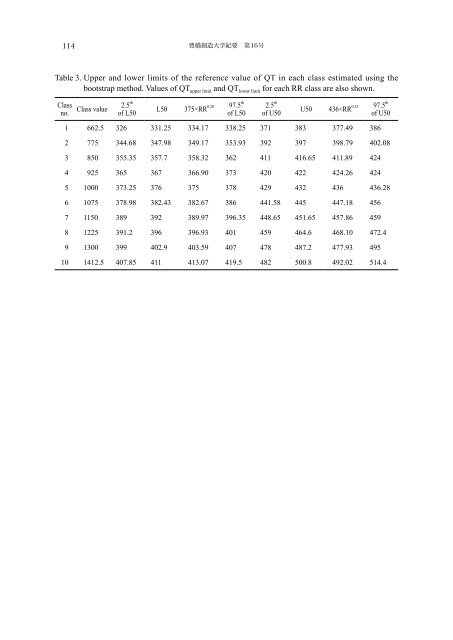
Table 3. Upper <strong>and</strong> <strong>lower</strong> <strong>limits</strong> <strong>of</strong> <strong>the</strong> <strong>reference</strong> value <strong>of</strong> <strong>QT</strong> in each class estimated using <strong>the</strong><br />
bootstrap method. Values <strong>of</strong> <strong>QT</strong> <strong>upper</strong> limit <strong>and</strong> <strong>QT</strong> <strong>lower</strong> limit for each RR class are also shown.<br />
Class<br />
no.<br />
Class value<br />
2.5 th<br />
<strong>of</strong> L50<br />
0.28 97.5th<br />
L50 375×RR<br />
<strong>of</strong> L50<br />
2.5 th<br />
<strong>of</strong> U50<br />
0.35 97.5th<br />
U50 436×RR<br />
<strong>of</strong> U50<br />
1 662.5 326 331.25 334.17 338.25 371 383 377.49 386<br />
2 775 344.68 347.98 349.17 353.93 392 397 398.79 402.08<br />
3 850 355.35 357.7 358.32 362 411 416.65 411.89 424<br />
4 925 365 367 366.90 373 420 422 424.26 424<br />
5 1000 373.25 376 375 378 429 432 436 436.28<br />
6 1075 378.98 382.43 382.67 386 441.58 445 447.18 456<br />
7 1150 389 392 389.97 396.35 448.65 451.65 457.86 459<br />
8 1225 391.2 396 396.93 401 459 464.6 468.10 472.4<br />
9 1300 399 402.9 403.59 407 478 487.2 477.93 495<br />
10 1412.5 407.85 411 413.07 419.5 482 500.8 492.02 514.4