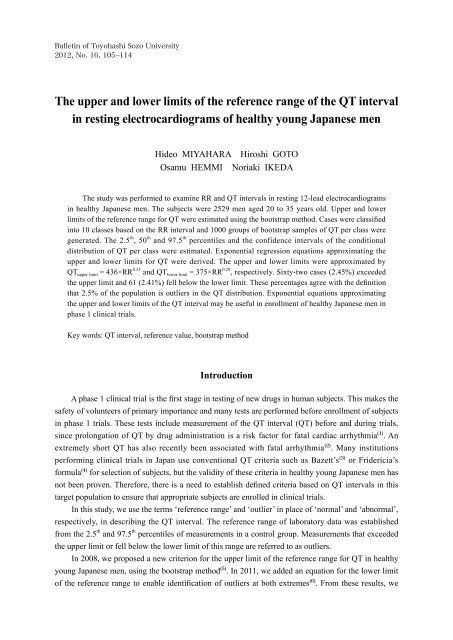
The upper and lower limits of the reference range of the QT interval ...
The upper and lower limits of the reference range of the QT interval ...
The upper and lower limits of the reference range of the QT interval ...

Create successful ePaper yourself
Turn your PDF publications into a flip-book with our unique Google optimized e-Paper software.
Bulletin <strong>The</strong> <strong>upper</strong> <strong>of</strong> Toyohashi <strong>and</strong> <strong>lower</strong> <strong>limits</strong> Sozo <strong>of</strong> <strong>the</strong> University<br />
<strong>reference</strong> <strong>range</strong> <strong>of</strong> <strong>the</strong> <strong>QT</strong> <strong>interval</strong> in resting electrocardiograms <strong>of</strong> healthy young Japanese men 105<br />
2012, No. 16, 105 –114<br />
<strong>The</strong> <strong>upper</strong> <strong>and</strong> <strong>lower</strong> <strong>limits</strong> <strong>of</strong> <strong>the</strong> <strong>reference</strong> <strong>range</strong> <strong>of</strong> <strong>the</strong> <strong>QT</strong> <strong>interval</strong><br />
in resting electrocardiograms <strong>of</strong> healthy young Japanese men<br />
Hideo MIYAHARA Hiroshi GOTO<br />
Osamu HEMMI Noriaki IKEDA<br />
<strong>The</strong> study was performed to examine RR <strong>and</strong> <strong>QT</strong> <strong>interval</strong>s in resting 12-lead electrocardiograms<br />
in healthy Japanese men. <strong>The</strong> subjects were 2529 men aged 20 to 35 years old. Upper <strong>and</strong> <strong>lower</strong><br />
<strong>limits</strong> <strong>of</strong> <strong>the</strong> <strong>reference</strong> <strong>range</strong> for <strong>QT</strong> were estimated using <strong>the</strong> bootstrap method. Cases were classified<br />
into 10 classes based on <strong>the</strong> RR <strong>interval</strong> <strong>and</strong> 1000 groups <strong>of</strong> bootstrap samples <strong>of</strong> <strong>QT</strong> per class were<br />
generated. <strong>The</strong> 2.5 th , 50 th <strong>and</strong> 97.5 th percentiles <strong>and</strong> <strong>the</strong> confidence <strong>interval</strong>s <strong>of</strong> <strong>the</strong> conditional<br />
distribution <strong>of</strong> <strong>QT</strong> per class were estimated. Exponential regression equations approximating <strong>the</strong><br />
<strong>upper</strong> <strong>and</strong> <strong>lower</strong> <strong>limits</strong> for <strong>QT</strong> were derived. <strong>The</strong> <strong>upper</strong> <strong>and</strong> <strong>lower</strong> <strong>limits</strong> were approximated by<br />
<strong>QT</strong> <strong>upper</strong> limit = 436×RR 0.35 <strong>and</strong> <strong>QT</strong> <strong>lower</strong> limit = 375×RR 0.28 , respectively. Sixty-two cases (2.45%) exceeded<br />
<strong>the</strong> <strong>upper</strong> limit <strong>and</strong> 61 (2.41%) fell below <strong>the</strong> <strong>lower</strong> limit. <strong>The</strong>se percentages agree with <strong>the</strong> definition<br />
that 2.5% <strong>of</strong> <strong>the</strong> population is outliers in <strong>the</strong> <strong>QT</strong> distribution. Exponential equations approximating<br />
<strong>the</strong> <strong>upper</strong> <strong>and</strong> <strong>lower</strong> <strong>limits</strong> <strong>of</strong> <strong>the</strong> <strong>QT</strong> <strong>interval</strong> may be useful in enrollment <strong>of</strong> healthy Japanese men in<br />
phase 1 clinical trials.<br />
Key words: <strong>QT</strong> <strong>interval</strong>, <strong>reference</strong> value, bootstrap method<br />
Introduction<br />
A phase 1 clinical trial is <strong>the</strong> first stage in testing <strong>of</strong> new drugs in human subjects. This makes <strong>the</strong><br />
safety <strong>of</strong> volunteers <strong>of</strong> primary importance <strong>and</strong> many tests are performed before enrollment <strong>of</strong> subjects<br />
in phase 1 trials. <strong>The</strong>se tests include measurement <strong>of</strong> <strong>the</strong> <strong>QT</strong> <strong>interval</strong> (<strong>QT</strong>) before <strong>and</strong> during trials,<br />
since prolongation <strong>of</strong> <strong>QT</strong> by drug administration is a risk factor for fatal cardiac arrhythmia (1) . An<br />
extremely short <strong>QT</strong> has also recently been associated with fatal arrhythmia (2) . Many institutions<br />
performing clinical trials in Japan use conventional <strong>QT</strong> criteria such as Bazett’s (3) or Fridericia’s<br />
formula (4) for selection <strong>of</strong> subjects, but <strong>the</strong> validity <strong>of</strong> <strong>the</strong>se criteria in healthy young Japanese men has<br />
not been proven. <strong>The</strong>refore, <strong>the</strong>re is a need to establish defined criteria based on <strong>QT</strong> <strong>interval</strong>s in this<br />
target population to ensure that appropriate subjects are enrolled in clinical trials.<br />
In this study, we use <strong>the</strong> terms ‘<strong>reference</strong> <strong>range</strong>’ <strong>and</strong> ‘outlier’ in place <strong>of</strong> ‘normal’ <strong>and</strong> ‘abnormal’,<br />
respectively, in describing <strong>the</strong> <strong>QT</strong> <strong>interval</strong>. <strong>The</strong> <strong>reference</strong> <strong>range</strong> <strong>of</strong> laboratory data was established<br />
from <strong>the</strong> 2.5 th <strong>and</strong> 97.5 th percentiles <strong>of</strong> measurements in a control group. Measurements that exceeded<br />
<strong>the</strong> <strong>upper</strong> limit or fell below <strong>the</strong> <strong>lower</strong> limit <strong>of</strong> this <strong>range</strong> are referred to as outliers.<br />
In 2008, we proposed a new criterion for <strong>the</strong> <strong>upper</strong> limit <strong>of</strong> <strong>the</strong> <strong>reference</strong> <strong>range</strong> for <strong>QT</strong> in healthy<br />
young Japanese men, using <strong>the</strong> bootstrap method (5) . In 2011, we added an equation for <strong>the</strong> <strong>lower</strong> limit<br />
<strong>of</strong> <strong>the</strong> <strong>reference</strong> <strong>range</strong> to enable identification <strong>of</strong> outliers at both extremes (6) . From <strong>the</strong>se results, we
106 豊 橋 創 造 大 学 紀 要 第 16 号<br />
found that <strong>the</strong> exponent <strong>of</strong> <strong>the</strong> regression equation <strong>of</strong> <strong>QT</strong> in terms <strong>of</strong> RR did not always agree with<br />
those <strong>of</strong> equations representing <strong>the</strong> <strong>upper</strong> <strong>and</strong> <strong>lower</strong> limit <strong>of</strong> <strong>the</strong> <strong>reference</strong> <strong>range</strong>. However, because <strong>of</strong><br />
a shortage <strong>of</strong> cases, we were unable to achieve <strong>the</strong> accuracy we had hoped for, especially for <strong>the</strong> longer<br />
<strong>and</strong> shorter ends <strong>of</strong> <strong>the</strong> RR <strong>interval</strong>. We also assumed <strong>the</strong> normality <strong>of</strong> <strong>the</strong> conditional distribution <strong>of</strong><br />
<strong>QT</strong> in <strong>the</strong>se studies <strong>and</strong> approximated <strong>the</strong> 97.5 th <strong>and</strong> 2.5 th percentiles <strong>of</strong> <strong>the</strong> distribution as <strong>the</strong> mean<br />
±1.96 sigma <strong>of</strong> <strong>the</strong> distribution.<br />
In <strong>the</strong> present study, addition <strong>of</strong> new cases from <strong>the</strong> same institution as that in <strong>the</strong> previous studies<br />
permitted estimation <strong>of</strong> <strong>the</strong> <strong>upper</strong> <strong>and</strong> <strong>lower</strong> <strong>limits</strong> with 95% confidence <strong>interval</strong>s, without assuming<br />
<strong>the</strong> normality <strong>of</strong> <strong>the</strong> conditional distribution <strong>of</strong> <strong>QT</strong>. Based on this analysis, we propose updated criteria<br />
for <strong>QT</strong> to identify subjects who should be excluded from clinical trials.<br />
Subjects <strong>and</strong> Methods<br />
A 12-lead electrocardiogram (ECG) was recorded for 2609 healthy Japanese men aged 20 to 35<br />
years old as a part <strong>of</strong> screening for c<strong>and</strong>idacy in a phase 1 clinical trial. <strong>The</strong> screening was performed<br />
from March 2006 to March 2009. All ECGs were recorded for 10 s with <strong>the</strong> subjects in <strong>the</strong> resting<br />
supine position from about 1 p.m. to 3 p.m. <strong>and</strong> after at least 60 minutes <strong>of</strong> rest. <strong>The</strong> RR <strong>interval</strong> (RR)<br />
for each case was determined by averaging <strong>the</strong> RR <strong>interval</strong>s <strong>of</strong> all leads measured from normal <strong>and</strong><br />
noise-free beats <strong>of</strong> <strong>the</strong> 10-s ECG recording. <strong>QT</strong> was measured using <strong>QT</strong> analysis s<strong>of</strong>tware (FCP-7431<br />
Version S) (12) provided by Fukuda Denshi. This s<strong>of</strong>tware determines <strong>the</strong> end <strong>of</strong> <strong>the</strong> T wave by <strong>the</strong><br />
gradient method <strong>and</strong> includes an algorithm that uses first-order differential <strong>and</strong> threshold equations.<br />
<strong>QT</strong> was measured for all 12 ECG leads <strong>and</strong> <strong>the</strong> average <strong>of</strong> all <strong>QT</strong>’s, excluding leads that were<br />
impossible to measure due to noise or baseline drift, was used in <strong>the</strong> subsequent analysis.<br />
For all ECGs, <strong>the</strong> computer measurements <strong>of</strong> RR <strong>and</strong> <strong>QT</strong> were verified by comparison <strong>of</strong> <strong>the</strong><br />
automated measurements with manual measurements made by a single physician using <strong>the</strong> printed<br />
ECG waveform. Some cases showed a U-wave or flat T-wave that might have affected computer<br />
recognition <strong>of</strong> <strong>the</strong> end <strong>of</strong> <strong>the</strong> T wave, but in all cases <strong>the</strong> difference between <strong>the</strong> automated <strong>and</strong> manual<br />
measurements was within 20 ms. <strong>The</strong>refore, <strong>the</strong> automated measurements were used in all cases.<br />
Age, heart rate, RR <strong>and</strong> <strong>QT</strong> were obtained for all cases that met <strong>the</strong> enrollment criteria for ECG<br />
findings. Eighty cases were excluded based on <strong>the</strong>se criteria, leaving 2529 cases in <strong>the</strong> study (Table 1).<br />
<strong>The</strong> joint distribution <strong>of</strong> RR <strong>and</strong> <strong>QT</strong> was used to determine a linear regression equation for <strong>QT</strong> in terms<br />
<strong>of</strong> RR: <strong>QT</strong> L = α×RR+β; <strong>and</strong> an exponential regression equation for <strong>QT</strong>: <strong>QT</strong> E = γ×RR δ . <strong>The</strong> coefficients,<br />
α <strong>and</strong> γ, intercept β, <strong>and</strong> exponent δ <strong>of</strong> <strong>the</strong>se equations were determined using <strong>the</strong> least squares method.<br />
<strong>The</strong> RR <strong>range</strong> (0.600 to 1.500 s) corresponding to <strong>the</strong> enrollment criteria for <strong>the</strong> clinical trial was<br />
divided into 10 classes. To compensate for <strong>the</strong> fewer samples at both ends <strong>of</strong> <strong>the</strong> RR <strong>interval</strong>, <strong>the</strong> class<br />
widths at both ends were broadened. Thus, <strong>the</strong> <strong>lower</strong> <strong>and</strong> <strong>upper</strong> <strong>limits</strong> <strong>of</strong> <strong>the</strong> lowest RR were set at<br />
0.600 <strong>and</strong> 0.7375 s, respectively (width 0.1375 s), <strong>and</strong> <strong>the</strong> <strong>limits</strong> <strong>of</strong> <strong>the</strong> highest RR were set at 1.3375<br />
<strong>and</strong> 1.500 s, respectively (width 0.1625 s). <strong>The</strong> <strong>limits</strong> <strong>of</strong> <strong>the</strong> o<strong>the</strong>r 8 <strong>interval</strong>s were graduated in 0.075 s<br />
<strong>interval</strong>s from <strong>the</strong> <strong>upper</strong> limit <strong>of</strong> <strong>the</strong> lowest <strong>interval</strong>. RR = 1 s occurred in <strong>the</strong> <strong>interval</strong> between 0.9625<br />
<strong>and</strong> 1.0375 s. <strong>The</strong> <strong>lower</strong> <strong>and</strong> <strong>upper</strong> <strong>limits</strong> <strong>of</strong> <strong>the</strong> 10 <strong>interval</strong>s are shown in Table 2. Each subject was<br />
classified into one <strong>of</strong> <strong>the</strong> 10 classes based on <strong>the</strong>ir RR <strong>interval</strong>. <strong>The</strong> value <strong>of</strong> RR for each case in <strong>the</strong><br />
same class was replaced with <strong>the</strong> class value <strong>of</strong> <strong>the</strong> <strong>interval</strong>, whereas <strong>the</strong> actual values <strong>of</strong> <strong>QT</strong> were used
<strong>The</strong> <strong>upper</strong> <strong>and</strong> <strong>lower</strong> <strong>limits</strong> <strong>of</strong> <strong>the</strong> <strong>reference</strong> <strong>range</strong> <strong>of</strong> <strong>the</strong> <strong>QT</strong> <strong>interval</strong> in resting electrocardiograms <strong>of</strong> healthy young Japanese men 107<br />
in <strong>the</strong> analysis. Using <strong>the</strong> bootstrap method (7) , <strong>the</strong> median, <strong>lower</strong> limit <strong>and</strong> <strong>upper</strong> limit <strong>of</strong> <strong>the</strong> <strong>reference</strong><br />
<strong>range</strong> <strong>of</strong> <strong>QT</strong> in each class were estimated as follows:<br />
Step 1: <strong>The</strong> number <strong>of</strong> samples corresponding to <strong>the</strong> sample size in <strong>the</strong> i-th class (n i ; i = 1, 10)<br />
were repeatedly sampled from <strong>the</strong> same class <strong>and</strong> a set <strong>of</strong> <strong>QT</strong> populations consisting <strong>of</strong> n i cases was<br />
constructed. <strong>The</strong> same procedure was repeated j times for <strong>the</strong> same subjects in <strong>the</strong> i-th class to produce<br />
j sets <strong>of</strong> <strong>QT</strong> populations consisting <strong>of</strong> n i cases (BS ik : i = 1, .., 10, k = 1, .., j). <strong>The</strong> number <strong>of</strong> bootstrap<br />
samples (j) was set at 1000.<br />
Step 2: <strong>The</strong> 2.5 th percentile (L ik ; k = 1, .., j) was determined in each <strong>of</strong> <strong>the</strong> j sets <strong>of</strong> BS ik for each i.<br />
Step 3: <strong>The</strong> 2.5 th (L2.5 i ), 50 th (L50 i ), <strong>and</strong> 97.5 th (L97.5 i ) percentiles <strong>of</strong> j samples <strong>of</strong> L ik were<br />
determined in each class. L50 i was defined as <strong>the</strong> estimated <strong>lower</strong> limit <strong>of</strong> <strong>the</strong> <strong>reference</strong> value <strong>of</strong> <strong>QT</strong> in<br />
<strong>the</strong> i-th class. L2.5 i <strong>and</strong> L97.5 i were defined as <strong>the</strong> <strong>lower</strong> <strong>and</strong> <strong>upper</strong> <strong>limits</strong> <strong>of</strong> <strong>the</strong> 95% confidence<br />
<strong>interval</strong> (CI) <strong>of</strong> L50 i , respectively.<br />
Step 4: Similarly to step 2, <strong>the</strong> 50th (M ik ; i = 1, . . , 10, k = 1, . . , j) <strong>and</strong> 97.5 th (U ik ; i = 1, . . , 10,<br />
k = 1, .., j) percentiles were determined in each <strong>of</strong> <strong>the</strong> j sets <strong>of</strong> BS ik .<br />
Step 5: Similarly to step 3, <strong>the</strong> 2.5 th (M2.5 i ), 50 th (M50 i ), <strong>and</strong> 97.5 th (M97.5 i ) percentiles <strong>of</strong> j<br />
samples <strong>of</strong> M ik were determined in each class. M50 i was defined as <strong>the</strong> median <strong>reference</strong> value <strong>of</strong> <strong>QT</strong><br />
in <strong>the</strong> i-th class, <strong>and</strong> M2.5 i <strong>and</strong> M97.5 i were defined as <strong>the</strong> <strong>lower</strong> <strong>and</strong> <strong>upper</strong> <strong>limits</strong> <strong>of</strong> <strong>the</strong> 95% CI <strong>of</strong><br />
M50 i , respectively. Similarly, <strong>the</strong> 2.5 th (U2.5 i ), 50 th (U50 i ), <strong>and</strong> 97.5 th (U97.5 i ) percentiles <strong>of</strong> j samples<br />
<strong>of</strong> U ik were determined in each class. U50 i was defined as <strong>the</strong> <strong>upper</strong> limit <strong>of</strong> <strong>the</strong> <strong>reference</strong> value <strong>of</strong> <strong>QT</strong><br />
in <strong>the</strong> i-th class, <strong>and</strong> U2.5 i <strong>and</strong> U97.5 i were defined as <strong>the</strong> <strong>lower</strong> <strong>and</strong> <strong>upper</strong> <strong>limits</strong> <strong>of</strong> <strong>the</strong> 95% CI <strong>of</strong><br />
U50 i , respectively.<br />
Step 6: Using 10 pairs <strong>of</strong> <strong>the</strong> class value from <strong>the</strong> i-th class <strong>of</strong> <strong>the</strong> RR <strong>and</strong> U50 i (i = 1, .., 10), an<br />
exponential regression equation for <strong>the</strong> <strong>upper</strong> limit <strong>of</strong> <strong>the</strong> <strong>reference</strong> value <strong>of</strong> <strong>QT</strong> was estimated in terms<br />
<strong>of</strong> RR (<strong>QT</strong> <strong>upper</strong> limit = c×RR d ). <strong>The</strong> coefficient c <strong>and</strong> exponent d <strong>of</strong> <strong>the</strong> equation were determined using<br />
<strong>the</strong> weighted least squares method.<br />
Step 7: Similarly to step 6, regression equations for <strong>the</strong> median (<strong>QT</strong> median = e ×RR f ) <strong>and</strong> <strong>lower</strong><br />
limit (<strong>QT</strong> <strong>lower</strong> limit = g×RR h ) <strong>of</strong> <strong>the</strong> <strong>reference</strong> value <strong>of</strong> <strong>QT</strong> were estimated in terms <strong>of</strong> RR.<br />
After drawing <strong>the</strong> curves for <strong>the</strong> <strong>upper</strong> <strong>and</strong> <strong>lower</strong> <strong>limits</strong> <strong>of</strong> <strong>the</strong> <strong>reference</strong> <strong>range</strong> on <strong>the</strong> plots <strong>of</strong> <strong>the</strong><br />
joint distribution <strong>of</strong> RR <strong>and</strong> <strong>QT</strong>, <strong>the</strong> validity <strong>of</strong> <strong>the</strong> pair <strong>of</strong> equations was confirmed by <strong>the</strong> naked eye.<br />
More precisely, we compared <strong>the</strong> detection rate at both extremes with <strong>the</strong> anticipated rate <strong>of</strong> 2.5% after<br />
identifying outliers in <strong>the</strong> subject population using <strong>the</strong> criteria.<br />
<strong>The</strong> study was approved by <strong>the</strong> Institutional Review Board <strong>of</strong> <strong>the</strong> institution where all ECGs were<br />
recorded <strong>and</strong> all subjects gave written informed consent before starting <strong>the</strong> study. Micros<strong>of</strong>t Excel<br />
2003 SP2 was used for statistical analysis.<br />
Results<br />
Joint distribution <strong>of</strong> RR <strong>and</strong> <strong>QT</strong><br />
<strong>The</strong> mean age <strong>of</strong> <strong>the</strong> 2529 subjects was 24.3 years old. <strong>The</strong> RR <strong>and</strong> <strong>QT</strong> <strong>interval</strong>s <strong>range</strong>d from 0.60<br />
to 1.50 s <strong>and</strong> from 326 to 530 ms, respectively. <strong>The</strong> joint distribution <strong>of</strong> RR <strong>and</strong> <strong>QT</strong> in <strong>the</strong> 2529 cases<br />
is shown in Figure 1. <strong>The</strong> mean <strong>of</strong> <strong>the</strong> conditional distribution <strong>of</strong> <strong>QT</strong> for a given RR increased<br />
curvilinearly with <strong>the</strong> increase <strong>of</strong> RR. <strong>The</strong> correlation coefficient between RR <strong>and</strong> <strong>QT</strong> was 0.78. A
108 豊 橋 創 造 大 学 紀 要 第 16 号<br />
linear regression equation for <strong>QT</strong> in terms <strong>of</strong> RR (<strong>QT</strong> L = 126.5×RR+276.0) was obtained with a root<br />
mean square error (RMSE) <strong>of</strong> 16.36 ms over all subjects. Similarly, an exponential regression equation<br />
for <strong>QT</strong> in terms <strong>of</strong> RR (<strong>QT</strong> E = 403.3×RR 0.32 ) was obtained with an RMSE <strong>of</strong> 16.32 ms.<br />
<strong>The</strong> median <strong>of</strong> <strong>the</strong> <strong>QT</strong> distribution was compared with <strong>the</strong> arithmetic mean (Mean) for each <strong>of</strong> <strong>the</strong><br />
10 classes (Table 2). M50 i was less than Mean in each class, which suggests that <strong>the</strong> conditional<br />
distribution <strong>of</strong> <strong>QT</strong> slightly leaned toward <strong>the</strong> shorter end. However, <strong>the</strong> differences between M50 <strong>and</strong><br />
Mean in each class were minimal <strong>and</strong> <strong>the</strong> values agreed to two significant figures. <strong>The</strong> <strong>range</strong>s <strong>of</strong> <strong>the</strong><br />
95% CI <strong>of</strong> <strong>the</strong> median (M97.5 i – M2.5 i ) were from 3 to 10 ms <strong>and</strong> did not increase with RR, but with<br />
<strong>the</strong> inverse <strong>of</strong> <strong>the</strong> sample size. <strong>QT</strong> median was estimated as <strong>QT</strong> median = 403.03 ×RR 0.308 . <strong>The</strong> coefficient <strong>of</strong><br />
403.03 <strong>and</strong> exponent <strong>of</strong> 0.31 were very close to <strong>the</strong> respective values for <strong>QT</strong> E . <strong>The</strong> exponent <strong>of</strong> 0.32 in<br />
<strong>QT</strong> E was closer to <strong>the</strong> value <strong>of</strong> 1/3 proposed by Fridericia (4) than to that <strong>of</strong> 1/2 proposed by Bazett (3) .<br />
Estimation <strong>of</strong> <strong>the</strong> <strong>upper</strong> limit <strong>of</strong> <strong>the</strong> <strong>QT</strong> <strong>reference</strong> value<br />
<strong>The</strong> median (U50 i ) <strong>and</strong> <strong>the</strong> <strong>upper</strong> (U97.5 i ) <strong>and</strong> <strong>lower</strong> (U2.5 i ) <strong>limits</strong> <strong>of</strong> <strong>the</strong> 95% CI <strong>of</strong> U50 i<br />
(i = 1,…, 10) estimated for each <strong>of</strong> <strong>the</strong> 10 classes using <strong>the</strong> bootstrap method are shown in Table 3.<br />
Similarly to M50 i , U50 i increased along with RR. In <strong>the</strong> 5th class (class value 1 s, sample size 491),<br />
U2.5 i , U50 i , <strong>and</strong> U97.5 i were 429.0, 432.0 <strong>and</strong> 436.3 ms, respectively, <strong>and</strong> <strong>the</strong> width <strong>of</strong> <strong>the</strong> 95% CI<br />
was 7.28 ms. <strong>The</strong> widths <strong>of</strong> <strong>the</strong> 95% CI broadened in <strong>the</strong> shorter <strong>and</strong> longer RR classes, but showed no<br />
increasing or decreasing trend with respect to RR (Table 3).<br />
In steps 6 <strong>and</strong> 7 above, <strong>the</strong> equation <strong>QT</strong> <strong>upper</strong> limit = 436×RR 0.35 was obtained for <strong>the</strong> <strong>upper</strong> limit <strong>of</strong><br />
<strong>the</strong> <strong>reference</strong> value <strong>of</strong> <strong>the</strong> <strong>QT</strong> population. <strong>The</strong> RMSE <strong>of</strong> this equation was 5.98 ms. <strong>The</strong> <strong>upper</strong> <strong>and</strong><br />
<strong>lower</strong> <strong>limits</strong> <strong>of</strong> <strong>the</strong> 95% CI <strong>of</strong> <strong>QT</strong> <strong>upper</strong> limit in <strong>the</strong> i-th class were approximated using U97.5 i <strong>and</strong> U2.5 i ,<br />
respectively (Table 3). In <strong>the</strong> RR <strong>range</strong> between 0.812 <strong>and</strong> 1.263 s <strong>the</strong> width <strong>of</strong> <strong>the</strong> 95% CIs <strong>range</strong>d<br />
from 4 to 14.4 ms, whereas for <strong>the</strong> RR <strong>range</strong>s < 0.812 s <strong>and</strong> >1.263 s <strong>the</strong> 95% CIs <strong>range</strong>d from 10 to<br />
32.4 ms. <strong>The</strong> value <strong>of</strong> <strong>QT</strong> <strong>upper</strong> limit exceeded U97.5 4 by 0.2 ms in <strong>the</strong> 4th class, but remained within <strong>the</strong><br />
95% CIs <strong>of</strong> U50 i in all o<strong>the</strong>r classes.<br />
Estimation <strong>of</strong> <strong>the</strong> <strong>lower</strong> limit <strong>of</strong> <strong>the</strong> <strong>QT</strong> <strong>reference</strong> value<br />
<strong>The</strong> median (L50 i .) <strong>and</strong> <strong>the</strong> <strong>upper</strong> (L97.5 i ) <strong>and</strong> <strong>lower</strong> (L2.5 i ) <strong>limits</strong> <strong>of</strong> <strong>the</strong> 95% CI <strong>of</strong> L50 i (i = 1,…,<br />
10) were estimated for each <strong>of</strong> <strong>the</strong> 10 classes using <strong>the</strong> bootstrap method (Table 3). Similarly to M50 i<br />
<strong>and</strong> U50 i , L50 i increased along with RR. In <strong>the</strong> 5th class, L2.5 i , L50 i <strong>and</strong> L97.5 i were 373.3, 376 <strong>and</strong><br />
378 ms, respectively, <strong>and</strong> <strong>the</strong> width <strong>of</strong> <strong>the</strong> 95% CI was 4.75 ms. <strong>The</strong> widths <strong>of</strong> <strong>the</strong> 95% CIs broadened<br />
to 12 ms in <strong>the</strong> shorter <strong>and</strong> longer RR classes, but showed no increasing or decreasing trend with<br />
respect to RR (Table 3). Using similar steps to estimate <strong>QT</strong> <strong>upper</strong> limit , <strong>the</strong> exponential equation<br />
<strong>QT</strong> <strong>lower</strong> limit = 375×RR 0.28 was obtained for <strong>the</strong> <strong>upper</strong> limit <strong>of</strong> <strong>the</strong> <strong>reference</strong> value <strong>of</strong> <strong>the</strong> <strong>QT</strong> population.<br />
<strong>The</strong> RMSE <strong>of</strong> this equation was 1.63 ms. <strong>The</strong> <strong>upper</strong> <strong>and</strong> <strong>lower</strong> <strong>limits</strong> <strong>of</strong> <strong>the</strong> 95% CI <strong>of</strong> <strong>QT</strong> <strong>lower</strong> limit in <strong>the</strong><br />
i-th class were approximated using L97.5 i <strong>and</strong> L2.5 i , respectively (Table 3). In <strong>the</strong> RR <strong>range</strong> between<br />
0.812 <strong>and</strong> 1.263 s <strong>the</strong> width <strong>of</strong> <strong>the</strong> 95% CIs <strong>range</strong>d from 4.8 to 9.8 ms, whereas for <strong>the</strong> RR <strong>range</strong>s<br />
< 0.812 s <strong>and</strong> > 1.263 s <strong>the</strong> 95% CIs <strong>range</strong>d from 8 to 12.3 ms. <strong>The</strong> value <strong>of</strong> <strong>QT</strong> <strong>lower</strong> limit remained within<br />
<strong>the</strong> 95% CIs <strong>of</strong> L50 i in all 10 classes.<br />
Curves representing <strong>QT</strong> <strong>upper</strong> limit = 436×RR 0.35 <strong>and</strong> <strong>QT</strong> <strong>lower</strong> limit = 375×RR 0.28 are shown with <strong>the</strong> plot<br />
<strong>of</strong> <strong>the</strong> joint distribution <strong>of</strong> RR <strong>and</strong> <strong>QT</strong> in Figure 2.
<strong>The</strong> <strong>upper</strong> <strong>and</strong> <strong>lower</strong> <strong>limits</strong> <strong>of</strong> <strong>the</strong> <strong>reference</strong> <strong>range</strong> <strong>of</strong> <strong>the</strong> <strong>QT</strong> <strong>interval</strong> in resting electrocardiograms <strong>of</strong> healthy young Japanese men 109<br />
Detection <strong>of</strong> outliers in <strong>the</strong> target population<br />
Using <strong>QT</strong> <strong>upper</strong> limit = 436×RR 0.35 , 62 <strong>of</strong> <strong>the</strong> 2529 cases (2.45%) with <strong>QT</strong> exceeding <strong>the</strong> limit were<br />
identified as outliers with longer <strong>QT</strong>. Similarly, using <strong>QT</strong> <strong>lower</strong> limit = 375 ×RR 0.28 , 61 cases (2.41%) fell<br />
below <strong>the</strong> limit <strong>and</strong> were identified as outliers with shorter <strong>QT</strong>. <strong>The</strong> o<strong>the</strong>r 2406 cases were located<br />
between <strong>the</strong> two <strong>limits</strong> <strong>and</strong> thus had <strong>QT</strong> within <strong>the</strong> <strong>reference</strong> <strong>range</strong>. <strong>The</strong> accuracy <strong>of</strong> <strong>the</strong> <strong>upper</strong> <strong>and</strong><br />
<strong>lower</strong> <strong>limits</strong> <strong>of</strong> <strong>the</strong> <strong>QT</strong> distribution was clearer when <strong>the</strong> subjects were divided into two groups based<br />
on RR <strong>interval</strong>s <strong>of</strong> < 1 s <strong>and</strong> > 1 s. At <strong>the</strong> <strong>upper</strong> extremes for RR <strong>interval</strong>s < 1 s <strong>and</strong> > 1 s, 20 <strong>of</strong> 971<br />
cases (2.45%) <strong>and</strong> 42 <strong>of</strong> 1558 cases (2.70%) were identified as outliers, respectively. At <strong>the</strong> <strong>lower</strong><br />
extremes for RR <strong>interval</strong>s < 1 s <strong>and</strong> > 1 s, 25 (2.57%) <strong>and</strong> 36 cases (2.31%) were identified as outliers.<br />
<strong>The</strong>se detection rates were within 0.26%, which suggested that <strong>the</strong> detection rate <strong>of</strong> 2.5% was<br />
satisfactory for both <strong>upper</strong> <strong>and</strong> <strong>lower</strong> extremes <strong>of</strong> RR.<br />
Discussion<br />
<strong>The</strong> mean <strong>of</strong> <strong>the</strong> conditional distribution <strong>of</strong> <strong>the</strong> <strong>QT</strong> <strong>interval</strong> for a given RR is well known to<br />
increase curvilinearly along with <strong>the</strong> increase <strong>of</strong> <strong>the</strong> RR <strong>interval</strong>, <strong>and</strong> many criteria <strong>and</strong> equations have<br />
been proposed to approximate this relationship (8) . Two <strong>of</strong> <strong>the</strong> most widely used are Bazett’s <strong>and</strong><br />
Fridericia’s formulas. In a previous study, we obtained an exponent that differed greatly from <strong>the</strong> value<br />
proposed by Bazett, which could not be used to approximate our target population. In contrast, <strong>the</strong><br />
exponent <strong>of</strong> RR in Fridericia’s formula was very close to <strong>the</strong> exponent <strong>of</strong> <strong>the</strong> equation that<br />
approximated <strong>the</strong> <strong>upper</strong> limit <strong>of</strong> our subject population. However, we were unable to obtain<br />
information on ano<strong>the</strong>r important parameter, <strong>the</strong> coefficient <strong>of</strong> RR in Fridericia’s formula. We were<br />
also unable to use o<strong>the</strong>r criteria since <strong>the</strong> subjects were examined for potential enrollment in studies<br />
with different purposes, including epidemiological studies treating a broad <strong>range</strong> <strong>of</strong> populations using<br />
diverse recording devices.<br />
Since <strong>the</strong> variance <strong>of</strong> <strong>the</strong> conditional distribution <strong>of</strong> <strong>QT</strong> increased along with <strong>the</strong> increase <strong>of</strong> RR,<br />
we expected that <strong>the</strong> exponent <strong>of</strong> RR in <strong>the</strong> equation for <strong>the</strong> <strong>upper</strong> limit would differ from that for <strong>the</strong><br />
<strong>lower</strong> limit. In fact, <strong>the</strong> exponents <strong>of</strong> RR for <strong>QT</strong> <strong>upper</strong> limit , <strong>QT</strong> median, <strong>and</strong> <strong>QT</strong> <strong>lower</strong> limit were estimated to be<br />
0.35, 0.31, <strong>and</strong> 0.28, respectively. <strong>The</strong>se values were obtained directly by <strong>the</strong> bootstrap method, but<br />
are consistent with <strong>the</strong> values <strong>of</strong> 1/3 proposed by Fridericia (who first obtained an exponent <strong>of</strong> 0.3558<br />
by <strong>the</strong> least squares method) <strong>and</strong> 0.308 (0.298 – 0.318) proposed by Yoshinaga (9) , which were both<br />
obtained indirectly using <strong>the</strong> mean <strong>and</strong> st<strong>and</strong>ard deviation <strong>of</strong> <strong>the</strong> distribution.<br />
To show <strong>the</strong> advantage <strong>of</strong> our criteria, we used similar criteria consisting <strong>of</strong> two equations for <strong>the</strong><br />
<strong>upper</strong> <strong>and</strong> <strong>lower</strong> <strong>limits</strong> with a common exponent <strong>of</strong> RR <strong>and</strong> compared <strong>the</strong> accuracy for detection <strong>of</strong><br />
outliers. Keeping <strong>the</strong> coefficient <strong>of</strong> RR unchanged, <strong>the</strong> exponents <strong>of</strong> RR for <strong>QT</strong> <strong>upper</strong> limit <strong>and</strong> <strong>QT</strong> <strong>lower</strong> limit<br />
were replaced with a common exponent <strong>of</strong> 0.31, corresponding to <strong>the</strong> exponent <strong>of</strong> RR for <strong>QT</strong> median , to<br />
give <strong>the</strong> equations <strong>QT</strong> C <strong>upper</strong> limit = 436×RR 0.31 (instead <strong>of</strong> <strong>QT</strong> <strong>upper</strong> limit = 436×RR 0.35 ) <strong>and</strong><br />
<strong>QT</strong> C <strong>lower</strong> limit = 375×RR 0.31 (instead <strong>of</strong> <strong>QT</strong> <strong>lower</strong> limit = 375×RR 0.28 ). Using <strong>the</strong> new equations for <strong>QT</strong> C <strong>upper</strong> limit<br />
<strong>and</strong> <strong>QT</strong> C <strong>lower</strong> limit , 64 cases (2.53%) exceeded <strong>QT</strong> C <strong>upper</strong> limit <strong>and</strong> 65 cases (2.84%) fell below <strong>QT</strong> C <strong>lower</strong> limit<br />
<strong>and</strong> were identified as <strong>the</strong> outliers. <strong>The</strong> detection rates with <strong>the</strong>se equations were consistent with <strong>the</strong><br />
rates <strong>of</strong> 2.45% <strong>and</strong> 2.41% at <strong>the</strong> long <strong>and</strong> short <strong>QT</strong> ends, respectively, obtained using <strong>the</strong> original<br />
equations.
110 豊 橋 創 造 大 学 紀 要 第 16 号<br />
We also investigated <strong>the</strong> detection rate by dividing <strong>the</strong> subjects into two groups based on RR<br />
<strong>interval</strong>s <strong>of</strong> ≤ 1 s <strong>and</strong> > 1 s. For RR ≤ 1 s, 6 <strong>of</strong> 20 outliers based on <strong>QT</strong> <strong>upper</strong> limit <strong>and</strong> 6 <strong>of</strong> 25 outliers based<br />
on <strong>QT</strong> <strong>lower</strong> limit shifted to <strong>the</strong> <strong>reference</strong> <strong>range</strong>; thus, <strong>the</strong> detection rate <strong>of</strong> outliers by <strong>QT</strong> C <strong>upper</strong> limit <strong>and</strong><br />
<strong>QT</strong> C <strong>lower</strong> limit decreased from 2.45% (original equation) to 1.44% <strong>and</strong> from 2.57% to 1.96%, respectively.<br />
For RR >1 s, 8 cases classified in <strong>the</strong> <strong>reference</strong>s <strong>range</strong> by <strong>QT</strong> <strong>upper</strong> limit exceeded <strong>QT</strong> C <strong>upper</strong> limit <strong>and</strong> 10 cases<br />
classified in <strong>the</strong> <strong>reference</strong> <strong>range</strong> by <strong>QT</strong> <strong>lower</strong> limit fell below <strong>QT</strong> C <strong>lower</strong> limit . As a result, <strong>the</strong> detection rate <strong>of</strong><br />
outliers by <strong>QT</strong> C <strong>upper</strong> limit <strong>and</strong> <strong>QT</strong> C <strong>lower</strong> limit increased from 2.70% to 3.21% <strong>and</strong> from 2.31% to 2.90%,<br />
respectively. Collectively, <strong>the</strong>se results show that, compared with use <strong>of</strong> <strong>the</strong> equations for <strong>QT</strong> <strong>upper</strong> limit<br />
<strong>and</strong> <strong>QT</strong> <strong>lower</strong> limit as st<strong>and</strong>ards, 12 false negative cases occurred for subjects with RR ≤ 1 s <strong>and</strong> 18 false<br />
positive cases occurred for subjects with RR > 1 s using <strong>QT</strong> C <strong>upper</strong> limit <strong>and</strong> <strong>QT</strong> C <strong>lower</strong> limit . <strong>The</strong> results <strong>of</strong><br />
<strong>the</strong>se two types <strong>of</strong> misclassifications cancelled each o<strong>the</strong>r out, which gave <strong>the</strong> apparently valid<br />
detection rate <strong>of</strong> around 2.5% with <strong>QT</strong> C <strong>upper</strong> limit <strong>and</strong> <strong>QT</strong> C <strong>lower</strong> limit .<br />
<strong>The</strong> same tendency was found in detection using <strong>the</strong> exponent <strong>of</strong> 1/3 proposed by Fridericia.<br />
Using <strong>QT</strong> F <strong>upper</strong> limit = 436×RR 0.33 instead <strong>of</strong> <strong>QT</strong> <strong>upper</strong> limit = 436 ×RR 0.35 <strong>and</strong> <strong>QT</strong> F <strong>lower</strong> limit = 375 ×RR 0.33<br />
instead <strong>of</strong> <strong>QT</strong> <strong>lower</strong> limit = 375×RR 0.28 , 64 cases (2.53%) exceeded <strong>QT</strong> F <strong>upper</strong> limit <strong>and</strong> 73 cases (2.89%) fell<br />
below <strong>QT</strong> F <strong>lower</strong> limit . <strong>The</strong>se results appeared consistent with <strong>the</strong> classification using <strong>the</strong> original<br />
equations. However, with division <strong>of</strong> <strong>the</strong> subjects into two RR <strong>interval</strong>s, as described above, 11 false<br />
negative cases occurred for <strong>the</strong> shorter RR <strong>interval</strong> <strong>and</strong> 25 false positive cases occurred for <strong>the</strong> longer<br />
RR <strong>interval</strong>.<br />
From <strong>the</strong>se results, we conclude that use <strong>of</strong> individual exponents <strong>of</strong> RR in <strong>the</strong> equations for <strong>the</strong><br />
<strong>upper</strong> <strong>and</strong> <strong>lower</strong> <strong>limits</strong> <strong>of</strong> <strong>QT</strong>, in place <strong>of</strong> a common exponent, is necessary to achieve a better<br />
approximation for <strong>the</strong> broad <strong>range</strong> <strong>of</strong> <strong>the</strong> RR <strong>interval</strong>.<br />
Limitations <strong>of</strong> <strong>the</strong> study<br />
<strong>The</strong> results <strong>of</strong> <strong>the</strong> study are valid for resting ECGs <strong>of</strong> healthy young Japanese men with heart rate<br />
between 40 <strong>and</strong> 100 bpm, with <strong>QT</strong> measured by Fukuda analysis s<strong>of</strong>tware. <strong>The</strong> applicability <strong>of</strong> <strong>the</strong><br />
results to <strong>the</strong> general population under different recording conditions has yet to be proven.<br />
Summary<br />
We investigated <strong>the</strong> relationship between <strong>the</strong> RR <strong>and</strong> <strong>QT</strong> <strong>interval</strong>s in resting ECGs <strong>of</strong> 2529<br />
healthy young Japanese men, <strong>and</strong> found that <strong>the</strong> <strong>upper</strong> <strong>and</strong> <strong>lower</strong> <strong>limits</strong> <strong>of</strong> <strong>the</strong> <strong>reference</strong> <strong>range</strong> <strong>of</strong> <strong>QT</strong><br />
were well approximated by <strong>the</strong> pair <strong>of</strong> exponential equations <strong>QT</strong> <strong>upper</strong> limit = 436×RR 0.35 <strong>and</strong><br />
<strong>QT</strong> <strong>lower</strong> limit = 375×RR 0.28 , respectively. Of <strong>the</strong> 2529 cases, 62 (2.45%) surpassing <strong>the</strong> <strong>upper</strong> limit were<br />
diagnosed as cases <strong>of</strong> <strong>QT</strong> prolongation, <strong>and</strong> 61 (2.41%) with <strong>QT</strong> below <strong>the</strong> <strong>lower</strong> limit were diagnosed<br />
as cases <strong>of</strong> short <strong>QT</strong>. <strong>The</strong> detection rates <strong>of</strong> <strong>the</strong>se outliers agreed well with <strong>the</strong> expected value <strong>of</strong> 2.5%<br />
at both ends <strong>of</strong> <strong>the</strong> broad <strong>range</strong> <strong>of</strong> <strong>the</strong> RR <strong>interval</strong>. From <strong>the</strong>se results, we conclude that <strong>the</strong> two<br />
exponential equations approximating <strong>the</strong> <strong>upper</strong> <strong>and</strong> <strong>lower</strong> <strong>limits</strong> <strong>of</strong> <strong>the</strong> <strong>QT</strong> <strong>reference</strong> <strong>range</strong> coincide<br />
well with <strong>the</strong> <strong>QT</strong> distribution on ECGs <strong>of</strong> healthy Japanese men, <strong>and</strong> <strong>the</strong>refore can be used in<br />
enrollment <strong>of</strong> volunteers in phase 1 trials.
<strong>The</strong> <strong>upper</strong> <strong>and</strong> <strong>lower</strong> <strong>limits</strong> <strong>of</strong> <strong>the</strong> <strong>reference</strong> <strong>range</strong> <strong>of</strong> <strong>the</strong> <strong>QT</strong> <strong>interval</strong> in resting electrocardiograms <strong>of</strong> healthy young Japanese men 111<br />
Acknowledgements<br />
We acknowledge <strong>the</strong> many contributions to preparation <strong>of</strong> data made by <strong>the</strong> staff <strong>of</strong> <strong>the</strong> Tsukuba<br />
International Clinical Pharmacology Clinic.<br />
References<br />
1. Shah, RR. (2002) ‘<strong>The</strong> significance <strong>of</strong> <strong>QT</strong> <strong>interval</strong> in drug development’, Br J Clin Pharmacol, 54, 188 –202.<br />
2. Bjerregaard, P., Nallapaneni, H., Gussak, I. (2010) ‘Short <strong>QT</strong> <strong>interval</strong> in clinical practice’, J Electrocardiol,<br />
43, 390 –395.<br />
3. Bazett, HC. (1920) ‘An analysis <strong>of</strong> <strong>the</strong> time-relations <strong>of</strong> electrocardiograms’ Heart, 7, 353 –370.<br />
4. Fridericia, LS. (1920) ‘Die Systolendauer im Elektrokardio-gramm bei normalen Menschen und bei<br />
Herzkranken’, Acta Medica Sc<strong>and</strong>inavica, 57, 469 – 486.<br />
5. Goto, H., Mamorita, N., Ikeda, N., Miyahara, H. (2008) ‘Estimation <strong>of</strong> <strong>the</strong> <strong>upper</strong> limit <strong>of</strong> <strong>the</strong> <strong>reference</strong> value<br />
<strong>of</strong> <strong>the</strong> <strong>QT</strong> <strong>interval</strong> in rest electrocardiograms in healthy young Japanese men using <strong>the</strong> bootstrap method’, J<br />
Electrocardiol, 41, 703e1–703e10.<br />
6. Hemmi, O., Miyahara, H., Goto, H., Ikeda, N., Mamorita, N., Takeuchi, A., Komatsuzaki, T. (2011)<br />
‘Estimation <strong>of</strong> <strong>the</strong> <strong>lower</strong> limit <strong>of</strong> <strong>the</strong> <strong>reference</strong> value <strong>of</strong> <strong>QT</strong> <strong>interval</strong> in healthy young Japanese men using <strong>the</strong><br />
bootstrap method’, Presented at 36 th Annual meeting <strong>of</strong> ISCE, April 13 – April 17, (San Jose, California).<br />
Abstract 20.<br />
7. Efron, B., Tibshirani, RJ. (1998) An introduction to <strong>the</strong> bootstrap, Chapman & Hall/CRC.<br />
8. Puddu, PE., Jouve, R., Mariotti, S., Giampaoli, S., Lanti, M., Reale, A., Menotti, A. (1988) ‘Evaluation <strong>of</strong><br />
10 <strong>QT</strong> prediction formulas in 881 middle-aged men from <strong>the</strong> seven countries study. Emphasis on <strong>the</strong> cubic<br />
root Fridericia’s equation’, J Electrocardiol, 21, 219 –229.<br />
9. Yoshinaga, M., Tomari, T., Aohoshi, S., Kawashita, T., Nishi, J., Tanaka, Y., Takezaki, T., Kono, Y., Yuasa, Y.,<br />
Nakamura, M., Nomura, Y., Oku, S., Haraguchi, T., Miyata, K. (1993) ‘Exponential correction <strong>of</strong> <strong>QT</strong> <strong>interval</strong><br />
to minimize <strong>the</strong> effect <strong>of</strong> <strong>the</strong> heart rate in children’, Jpn Circ J, 57, 102–108.<br />
Figure Legends<br />
Figure 1. Relationship between <strong>QT</strong> <strong>and</strong> RR <strong>interval</strong>s in resting ECGs <strong>of</strong> 2529 healthy young Japanese men.<br />
<strong>QT</strong> E (bold line) <strong>and</strong> <strong>QT</strong> median (thin line).<br />
Figure 2. U50 i. (■) <strong>and</strong> L50 i (▲) obtained in each RR class using <strong>the</strong> bootstrap method were plotted <strong>and</strong><br />
connected with a dotted line. <strong>The</strong> exponential regression equations for <strong>QT</strong> <strong>upper</strong> limit , <strong>QT</strong> median <strong>and</strong> <strong>QT</strong> <strong>lower</strong> limit are<br />
shown as a st<strong>and</strong>ard, bold <strong>and</strong> thin lines, respectively.
112 豊 橋 創 造 大 学 紀 要 第 16 号<br />
550<br />
500<br />
Linear regression equation (<strong>QT</strong> E )<br />
Figure 1<br />
Linear regression equation (<strong>QT</strong> median )<br />
<strong>QT</strong> <strong>interval</strong> [ms]<br />
450<br />
400<br />
350<br />
300<br />
0.5 0.7 0.9 1.1 1.3 1.5<br />
RR <strong>interval</strong> [s]<br />
550<br />
500<br />
Figure 2<br />
Exponential regression equation (<strong>QT</strong> median )<br />
Exponential regression equation (<strong>QT</strong> <strong>upper</strong> limit )<br />
Exponential regression equation (<strong>QT</strong> <strong>lower</strong> limit )<br />
<strong>QT</strong> <strong>interval</strong> [ms]<br />
450<br />
400<br />
U50 i .<br />
L50 i .<br />
350<br />
300<br />
0.5 0.7 0.9 1.1 1.3 1.5<br />
RR <strong>interval</strong> [s]
<strong>The</strong> <strong>upper</strong> <strong>and</strong> <strong>lower</strong> <strong>limits</strong> <strong>of</strong> <strong>the</strong> <strong>reference</strong> <strong>range</strong> <strong>of</strong> <strong>the</strong> <strong>QT</strong> <strong>interval</strong> in resting electrocardiograms <strong>of</strong> healthy young Japanese men 113<br />
Table 1. Cases excluded from <strong>the</strong> study.<br />
ECG findings Exclusion criterion Number <strong>of</strong> cases<br />
Sinus tachycardia 5<br />
Sinus bradycardia 2<br />
Left axis deviation < –30 13<br />
Right axis deviation > 110 12<br />
Myocardial ischemia 2<br />
Complete right bundle blanch block > 135 5<br />
Intraventricular conduction disturbance > 135 7<br />
Short PR <strong>interval</strong> < 80 1<br />
First degree atrioventricular block > 260 4<br />
Atrioventricular junctional rhythm 15<br />
Premature ventricular contraction 5<br />
Premature supraventricular contraction 3<br />
Escaped beat 3<br />
Second degree atrioventricular block 1<br />
Third degree atrioventricular block 1<br />
WPW 1<br />
Total 80<br />
Table 2. Class value, <strong>range</strong>, sample size, arithmetic mean, SE <strong>of</strong> mean, median, <strong>range</strong> <strong>of</strong> 95% CI <strong>of</strong><br />
median, <strong>and</strong> <strong>QT</strong> median corresponding to class value <strong>of</strong> each RR class.<br />
Class<br />
no.<br />
Class value<br />
(Range)<br />
No. <strong>of</strong><br />
cases<br />
Mean<br />
SE <strong>of</strong> mean Median<br />
Range <strong>of</strong><br />
95% CI<br />
<strong>of</strong> Median<br />
<strong>QT</strong> median<br />
1 662.5 (0.5995–0.7375) 66 356.05 1.64 356 8.5 354.68<br />
2 775 (0.7375– 0.8125) 120 373.08 1.17 372 5.5 372.31<br />
3 850 (0.8125– 0.8875) 215 384.07 1.04 382 3.0 383.10<br />
4 925 (0.8875– 0.9625) 321 394.05 0.81 393 4 393.26<br />
5 1000 (0.9625–1.0375) 491 404.13 0.69 404 3 402.85<br />
6 1075 (1.0375–1.1125) 458 412.36 0.78 411 3 411.97<br />
7 1150 (1.1125–1.1875) 335 421.50 0.88 420 5 420.65<br />
8 1225 (1.1875–1.2625) 257 428.47 1.14 426 5 428.95<br />
9 1300 (1.2625–1.3375) 159 440.63 1.74 439 6 436.91<br />
10 1412.5 (1.3375–1.4665) 107 450.38 2.21 450 10 448.27
114 豊 橋 創 造 大 学 紀 要 第 16 号<br />
Table 3. Upper <strong>and</strong> <strong>lower</strong> <strong>limits</strong> <strong>of</strong> <strong>the</strong> <strong>reference</strong> value <strong>of</strong> <strong>QT</strong> in each class estimated using <strong>the</strong><br />
bootstrap method. Values <strong>of</strong> <strong>QT</strong> <strong>upper</strong> limit <strong>and</strong> <strong>QT</strong> <strong>lower</strong> limit for each RR class are also shown.<br />
Class<br />
no.<br />
Class value<br />
2.5 th<br />
<strong>of</strong> L50<br />
0.28 97.5th<br />
L50 375×RR<br />
<strong>of</strong> L50<br />
2.5 th<br />
<strong>of</strong> U50<br />
0.35 97.5th<br />
U50 436×RR<br />
<strong>of</strong> U50<br />
1 662.5 326 331.25 334.17 338.25 371 383 377.49 386<br />
2 775 344.68 347.98 349.17 353.93 392 397 398.79 402.08<br />
3 850 355.35 357.7 358.32 362 411 416.65 411.89 424<br />
4 925 365 367 366.90 373 420 422 424.26 424<br />
5 1000 373.25 376 375 378 429 432 436 436.28<br />
6 1075 378.98 382.43 382.67 386 441.58 445 447.18 456<br />
7 1150 389 392 389.97 396.35 448.65 451.65 457.86 459<br />
8 1225 391.2 396 396.93 401 459 464.6 468.10 472.4<br />
9 1300 399 402.9 403.59 407 478 487.2 477.93 495<br />
10 1412.5 407.85 411 413.07 419.5 482 500.8 492.02 514.4