The upper and lower limits of the reference range of the QT interval ...
The upper and lower limits of the reference range of the QT interval ...
The upper and lower limits of the reference range of the QT interval ...
You also want an ePaper? Increase the reach of your titles
YUMPU automatically turns print PDFs into web optimized ePapers that Google loves.
106 豊 橋 創 造 大 学 紀 要 第 16 号<br />
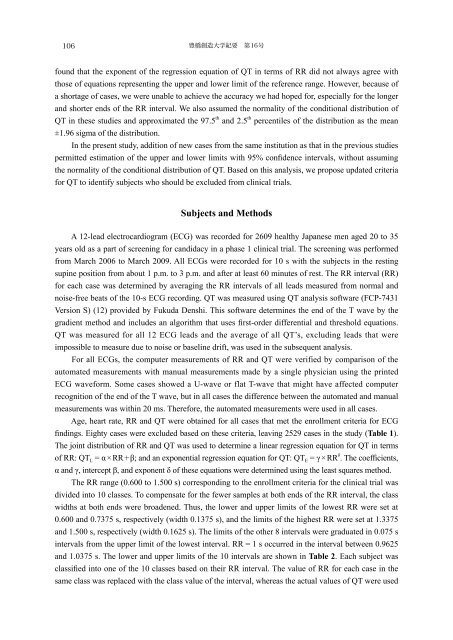
found that <strong>the</strong> exponent <strong>of</strong> <strong>the</strong> regression equation <strong>of</strong> <strong>QT</strong> in terms <strong>of</strong> RR did not always agree with<br />
those <strong>of</strong> equations representing <strong>the</strong> <strong>upper</strong> <strong>and</strong> <strong>lower</strong> limit <strong>of</strong> <strong>the</strong> <strong>reference</strong> <strong>range</strong>. However, because <strong>of</strong><br />
a shortage <strong>of</strong> cases, we were unable to achieve <strong>the</strong> accuracy we had hoped for, especially for <strong>the</strong> longer<br />
<strong>and</strong> shorter ends <strong>of</strong> <strong>the</strong> RR <strong>interval</strong>. We also assumed <strong>the</strong> normality <strong>of</strong> <strong>the</strong> conditional distribution <strong>of</strong><br />
<strong>QT</strong> in <strong>the</strong>se studies <strong>and</strong> approximated <strong>the</strong> 97.5 th <strong>and</strong> 2.5 th percentiles <strong>of</strong> <strong>the</strong> distribution as <strong>the</strong> mean<br />
±1.96 sigma <strong>of</strong> <strong>the</strong> distribution.<br />
In <strong>the</strong> present study, addition <strong>of</strong> new cases from <strong>the</strong> same institution as that in <strong>the</strong> previous studies<br />
permitted estimation <strong>of</strong> <strong>the</strong> <strong>upper</strong> <strong>and</strong> <strong>lower</strong> <strong>limits</strong> with 95% confidence <strong>interval</strong>s, without assuming<br />
<strong>the</strong> normality <strong>of</strong> <strong>the</strong> conditional distribution <strong>of</strong> <strong>QT</strong>. Based on this analysis, we propose updated criteria<br />
for <strong>QT</strong> to identify subjects who should be excluded from clinical trials.<br />
Subjects <strong>and</strong> Methods<br />
A 12-lead electrocardiogram (ECG) was recorded for 2609 healthy Japanese men aged 20 to 35<br />
years old as a part <strong>of</strong> screening for c<strong>and</strong>idacy in a phase 1 clinical trial. <strong>The</strong> screening was performed<br />
from March 2006 to March 2009. All ECGs were recorded for 10 s with <strong>the</strong> subjects in <strong>the</strong> resting<br />
supine position from about 1 p.m. to 3 p.m. <strong>and</strong> after at least 60 minutes <strong>of</strong> rest. <strong>The</strong> RR <strong>interval</strong> (RR)<br />
for each case was determined by averaging <strong>the</strong> RR <strong>interval</strong>s <strong>of</strong> all leads measured from normal <strong>and</strong><br />
noise-free beats <strong>of</strong> <strong>the</strong> 10-s ECG recording. <strong>QT</strong> was measured using <strong>QT</strong> analysis s<strong>of</strong>tware (FCP-7431<br />
Version S) (12) provided by Fukuda Denshi. This s<strong>of</strong>tware determines <strong>the</strong> end <strong>of</strong> <strong>the</strong> T wave by <strong>the</strong><br />
gradient method <strong>and</strong> includes an algorithm that uses first-order differential <strong>and</strong> threshold equations.<br />
<strong>QT</strong> was measured for all 12 ECG leads <strong>and</strong> <strong>the</strong> average <strong>of</strong> all <strong>QT</strong>’s, excluding leads that were<br />
impossible to measure due to noise or baseline drift, was used in <strong>the</strong> subsequent analysis.<br />
For all ECGs, <strong>the</strong> computer measurements <strong>of</strong> RR <strong>and</strong> <strong>QT</strong> were verified by comparison <strong>of</strong> <strong>the</strong><br />
automated measurements with manual measurements made by a single physician using <strong>the</strong> printed<br />
ECG waveform. Some cases showed a U-wave or flat T-wave that might have affected computer<br />
recognition <strong>of</strong> <strong>the</strong> end <strong>of</strong> <strong>the</strong> T wave, but in all cases <strong>the</strong> difference between <strong>the</strong> automated <strong>and</strong> manual<br />
measurements was within 20 ms. <strong>The</strong>refore, <strong>the</strong> automated measurements were used in all cases.<br />
Age, heart rate, RR <strong>and</strong> <strong>QT</strong> were obtained for all cases that met <strong>the</strong> enrollment criteria for ECG<br />
findings. Eighty cases were excluded based on <strong>the</strong>se criteria, leaving 2529 cases in <strong>the</strong> study (Table 1).<br />
<strong>The</strong> joint distribution <strong>of</strong> RR <strong>and</strong> <strong>QT</strong> was used to determine a linear regression equation for <strong>QT</strong> in terms<br />
<strong>of</strong> RR: <strong>QT</strong> L = α×RR+β; <strong>and</strong> an exponential regression equation for <strong>QT</strong>: <strong>QT</strong> E = γ×RR δ . <strong>The</strong> coefficients,<br />
α <strong>and</strong> γ, intercept β, <strong>and</strong> exponent δ <strong>of</strong> <strong>the</strong>se equations were determined using <strong>the</strong> least squares method.<br />
<strong>The</strong> RR <strong>range</strong> (0.600 to 1.500 s) corresponding to <strong>the</strong> enrollment criteria for <strong>the</strong> clinical trial was<br />
divided into 10 classes. To compensate for <strong>the</strong> fewer samples at both ends <strong>of</strong> <strong>the</strong> RR <strong>interval</strong>, <strong>the</strong> class<br />
widths at both ends were broadened. Thus, <strong>the</strong> <strong>lower</strong> <strong>and</strong> <strong>upper</strong> <strong>limits</strong> <strong>of</strong> <strong>the</strong> lowest RR were set at<br />
0.600 <strong>and</strong> 0.7375 s, respectively (width 0.1375 s), <strong>and</strong> <strong>the</strong> <strong>limits</strong> <strong>of</strong> <strong>the</strong> highest RR were set at 1.3375<br />
<strong>and</strong> 1.500 s, respectively (width 0.1625 s). <strong>The</strong> <strong>limits</strong> <strong>of</strong> <strong>the</strong> o<strong>the</strong>r 8 <strong>interval</strong>s were graduated in 0.075 s<br />
<strong>interval</strong>s from <strong>the</strong> <strong>upper</strong> limit <strong>of</strong> <strong>the</strong> lowest <strong>interval</strong>. RR = 1 s occurred in <strong>the</strong> <strong>interval</strong> between 0.9625<br />
<strong>and</strong> 1.0375 s. <strong>The</strong> <strong>lower</strong> <strong>and</strong> <strong>upper</strong> <strong>limits</strong> <strong>of</strong> <strong>the</strong> 10 <strong>interval</strong>s are shown in Table 2. Each subject was<br />
classified into one <strong>of</strong> <strong>the</strong> 10 classes based on <strong>the</strong>ir RR <strong>interval</strong>. <strong>The</strong> value <strong>of</strong> RR for each case in <strong>the</strong><br />
same class was replaced with <strong>the</strong> class value <strong>of</strong> <strong>the</strong> <strong>interval</strong>, whereas <strong>the</strong> actual values <strong>of</strong> <strong>QT</strong> were used


