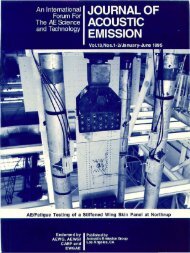
- Page 2 and 3: Journal of Acoustic Emission, Volum
- Page 4 and 5: and HISAKAZU MORI 233-240 27-241 EF
- Page 6 and 7: JOURNAL OF ACOUSTIC EMISSION Editor
- Page 8 and 9: MEETING CALENDAR: EWGAE29 EWGAE-201
- Page 10 and 11: eference in that document to see if
- Page 12 and 13: AE LITERATURE Chinese Acoustic Emis
- Page 14 and 15: Li Guanhai, Liu Shifeng (Tsinghua U
- Page 16 and 17: Monitoring during Landing Gear Cont
- Page 18 and 19: MONITORING THE CIVIL INFRASTRUCTURE
- Page 20 and 21: including stringers, floor beams (i
- Page 22 and 23: Fig. 3. A sensor array for monitori
- Page 24 and 25: Fig. 7. Maintenance follow-up recom
- Page 26 and 27: Fig. 9 Fatigue-prone location on th
- Page 28 and 29: ACOUSTIC EMISSION TESTING OF A DIFF
- Page 30 and 31: adius of each other in order to pas
- Page 32 and 33: Fig. 3. AE transducer arrays. (a) A
- Page 34 and 35: References Holford, K. and Lark, R.
- Page 36 and 37: Unfortunately, there are neither a
- Page 38 and 39: Table 2: Total damage extension of
- Page 40 and 41: Some structures, even when visibly
- Page 42 and 43: identification processes leading to
- Page 44 and 45: ACOUSTIC EMISSION LEAK DETECTION OF
- Page 46 and 47: evaluate and to calculate the linea
- Page 48 and 49: Further analysis was made on-site u
- Page 52 and 53: Fig. 8. (a) Aerial photo of the com
- Page 54 and 55: Fig. 12. ASL measurements at 8.3 ba
- Page 56 and 57: Today’s modern AE systems offer i
- Page 58 and 59: Fig. 1: Primary AE parameters [6].
- Page 60 and 61: Fig. 4: Backpropagation neural netw
- Page 62 and 63: does not drop below the set thresho
- Page 64 and 65: Fig. 8: Amplitude histogram for a t
- Page 66 and 67: Table 2 shows the tests for the 3.8
- Page 68 and 69: Fig. 14: Cumulative energy versus c
- Page 70 and 71: crack jumps have a higher amplitude
- Page 72 and 73: etween these two fatigue life value
- Page 74 and 75: Table 5: 25% HCF BPNN testing file.
- Page 76 and 77: Fig. 23: Range of data used for 50%
- Page 78 and 79: 4. Conclusions and Future Work Acou
- Page 80 and 81: [15] Suleman, J., Korcak, A., Barso
- Page 82 and 83: on the resin plate hardness or its
- Page 84 and 85: Fig. 4 Schematics of cutting load a
- Page 86 and 87: (a) Line force during idle cutting
- Page 88 and 89: (a) Non-arranged die type, f imax /
- Page 90 and 91: Fig. 11 Sensor position and impact
- Page 92 and 93: Fig. 14 Relationship between Δf im
- Page 94 and 95: DAMAGE ONSET AND GROWTH IN CARBON-C
- Page 96 and 97: (a) (b) (c) Fig. 1. (a-b) Polarized
- Page 98 and 99: Fig. 4(c). The dependency of the th
- Page 100 and 101:
Fig. 6 (c) cumulative AE counts at
- Page 102 and 103:
as shown schematically in Fig. 8(a)
- Page 104 and 105:
(a) (b) (c) (d) Fig. 11. Micro-fail
- Page 106 and 107:
FUNDAMENTAL STUDY ON INTEGRITY EVAL
- Page 108 and 109:
Fig. 3 UT C-scan images of internal
- Page 110 and 111:
Fig. 7 AE signal peak amplitude and
- Page 112 and 113:
Fig. 9 Relationship between AE sign
- Page 114 and 115:
monotonically with load. As mention
- Page 116 and 117:
A phenomenon of stress wave generat
- Page 118 and 119:
where plus sign refers to the first
- Page 120 and 121:
kHz. The result of filtration is sh
- Page 122 and 123:
Sphere radius, R, mm Sphere mass, m
- Page 124 and 125:
Regime ρV 2 /Yd (MPa) Approximate
- Page 126 and 127:
a b Fig. 6. AE signal at the remote
- Page 128 and 129:
a b Fig. 9. AE waveforms from impac
- Page 130 and 131:
9. А.А. Harkevich, Spectrums and
- Page 132 and 133:
amplitudes in the AE signals. In th
- Page 134 and 135:
Fig. 2. Signals from small aperture
- Page 136 and 137:
Fig. 4. Signals from small aperture
- Page 138 and 139:
during the duration of the direct w
- Page 140 and 141:
Fig. 8. Expanded time scale view of
- Page 142 and 143:
Fig. 10. Displacement signal result
- Page 144 and 145:
Fig. 12. Top surface out-of-plane d
- Page 146 and 147:
Fig. 14. Signals from small apertur
- Page 148 and 149:
Fig. 16. Filtered signal showing hi
- Page 150 and 151:
Fig. 18. WTs of the first 200 µs o
- Page 152 and 153:
Summary There are three summary obs
- Page 154 and 155:
FRACTURE BEHAVIOR IN BONE CHARACTER
- Page 156 and 157:
Fig. 2. Schematic diagram of static
- Page 158 and 159:
and AE events during loading were d
- Page 160 and 161:
References [1] Hirai T., Katayama T
- Page 162 and 163:
where and stand for the strain-hard
- Page 164 and 165:
Experimental The samples for mechan
- Page 166 and 167:
Fig. 4. Typical AE waveforms and th
- Page 168 and 169:
detected just before the upper yiel
- Page 170 and 171:
the AE energy in iron upon Lüders-
- Page 172 and 173:
The most intriguing issue, which ha
- Page 174 and 175:
ACOUSTIC AND ELECTROMAGNETIC EMISSI
- Page 176 and 177:
Fig. 2 Sample assembly: (a) setup f
- Page 178 and 179:
We have observed that the EME signa
- Page 180 and 181:
EME under Repeated Loading Rectangu
- Page 182 and 183:
the fact that the AE due to the fri
- Page 184 and 185:
Abstract IDENTIFICATION OF AE MULTI
- Page 186 and 187:
sensor/sonde/surface units have fla
- Page 188 and 189:
Fig. 3. Coherency between a pair of
- Page 190 and 191:
These multiplets may be related to
- Page 192 and 193:
Fig. 7. Hypocenter location and sou
- Page 194 and 195:
Accordingly, semi-supervised or uns
- Page 196 and 197:
Indeed, the AE events are also non-
- Page 198 and 199:
Fig. 5. Overlap plot of AE events f
- Page 200 and 201:
(a) Individual Events Test 1 Test 2
- Page 202 and 203:
Fig. 10. The distribution of event
- Page 204 and 205:
loading tests of concrete elements
- Page 206 and 207:
Fig. 4: Typical cracking of specime
- Page 208 and 209:
(a) Plain concrete. (b) Composite.
- Page 210 and 211:
3) T. Shiotani, M. Shigeishi and M.
- Page 212 and 213:
data cannot be recorded by most exp
- Page 214 and 215:
where A and I are the area and mome
- Page 216 and 217:
Fig. 3 Loading condition for the si
- Page 218 and 219:
4. Simulation Results 4.1 Stress-st
- Page 220 and 221:
dilatancy observed in an actual uni
- Page 222 and 223:
Fig. 9. Energy-frequency distributi
- Page 224 and 225:
After the AE cluster formation, mic
- Page 226 and 227:
Fig. 13 Spatial distribution of all
- Page 228 and 229:
7. J.F. Hazzard and R.P. Young: Int
- Page 230 and 231:
obvious that the calibrating AE sou
- Page 232 and 233:
Fig. 2. Geometry and schematic illu
- Page 234 and 235:
The boundary conditions for tempera
- Page 236 and 237:
Calculations have shown that in ord
- Page 238 and 239:
Fig. 9. Example of an AE sensor cal
- Page 240 and 241:
Hence, the distinct features and ad
- Page 242 and 243:
Developed Sensor Configuration Rela
- Page 244 and 245:
In this study, the sensor width was
- Page 246 and 247:
Fig. 8 Typical AE waveforms and the
- Page 248 and 249:
Fig. 11 Relationship between shell
- Page 250 and 251:
CORROSION DETECTION BY FIBER OPTIC
- Page 252 and 253:
sensor by an FOD sensor. Due to the
- Page 254 and 255:
Corrosion AE Monitoring AE monitori
- Page 256 and 257:
operated at the normal condition. S
- Page 258 and 259:
EFFECT OF SHOT PEENING ON THE DELAY
- Page 260 and 261:
Figure 1 shows the SSI and three-po
- Page 262 and 263:
stresses do not give any positive e
- Page 264 and 265:
Fig. 7 Examples of Lamb waveforms p
- Page 266 and 267:
Figure 10 shows results of an SSI t
- Page 268 and 269:
as-received strip. It is noted that
- Page 270 and 271:
Almen strips were charged in less a
- Page 272 and 273:
more AE transducers. AE events may
- Page 274 and 275:
Given the data with , and the new d
- Page 276 and 277:
Fig. 4. Projection of AE data: (a)
- Page 278 and 279:
Table 2. Feature-discriminated stat
- Page 280 and 281:
FLEXURAL FAILURE BEHAVIOR OF RC BEA
- Page 282 and 283:
Table 2. Weight loss of rebar after
- Page 284 and 285:
(a) Global (b) Close up (only skele
- Page 286 and 287:
AE hits. By comparison among corros
- Page 288 and 289:
dots). It seems that the ratio of A
- Page 290 and 291:
Fig. 1. The scheme of double-bottom
- Page 292 and 293:
Fig. 3. The other two at 2 and 7 o
- Page 294 and 295:
Fig. 6. Located AE sources with the
- Page 296 and 297:
Fig. 10. The intensity of recorded
- Page 298 and 299:
STUDY OF IDENTIFICATION AND REMOVAL
- Page 300 and 301:
Fig. 4 2D Location result with ch5-
- Page 302 and 303:
Fig. 8 Noise removal result with th
- Page 304 and 305:
Identification and removal for drop
- Page 306 and 307:
It was confirmed that a minimum thi
- Page 308 and 309:
A GENERIC TECHNIQUE FOR ACOUSTIC EM
- Page 310 and 311:
where ∆t exp are the experimental
- Page 312 and 313:
stone disc. Oolitic limestone is a
- Page 314 and 315:
CFC plate test, larger errors occur
- Page 316 and 317:
ACOUSTIC EMISSION TESTING - DEFININ
- Page 318 and 319:
What is the detection performance o
- Page 320 and 321:
A.3. Performance analysis - Calcula
- Page 322 and 323:
- Planar testing configuration (2.5
- Page 324 and 325:
Whereas in the planar testing confi
- Page 326 and 327:
We can see that full use of the pla
- Page 328 and 329:
B.3. Influence of the minimum numbe
- Page 330 and 331:
technique such as GBP in France, au
- Page 332 and 333:
Page 149 Elastic Waves in Solids Ro
- Page 334 and 335:
A Note from the Editor Kanji Ono Nu
- Page 336 and 337:
Page 173 5th Colloquium on AE D. Sc
- Page 338 and 339:
S78 S82 S86 S90 S94 On the Applicat
- Page 340 and 341:
S247 In-Process Acoustic Emission M
- Page 342 and 343:
Page i Appreciation K. Ono / Europe
- Page 344 and 345:
Page 83 Number 2 Page 85 Page 93 Pr
- Page 346 and 347:
Page 111 Page 119 Page 129 Page 129
- Page 348 and 349:
S53 S57 S62 S66 S70 S71 S75 "AE App
- Page 350 and 351:
S231 S236 Vessels", S238 S239 "Tool
- Page 352 and 353:
Number 4 Page 65 Page 93 Page 99 A
- Page 354 and 355:
Page 197 Page 203 Nondestructive Ev
- Page 356 and 357:
M. Momayez, F. P. Hassani and H. R.
- Page 358 and 359:
Number 3 Page C1-C24 Page 95-99 Pag
- Page 360 and 361:
12th International Acoustic Emissio
- Page 362 and 363:
Source Simulation Analysis Hiroaki
- Page 364 and 365:
Page S70-S79 Page S80-S88 Page S90-
- Page 366 and 367:
Page S343 Page i-iii Page iii Page
- Page 368 and 369:
A. Tsimogiannis, B. Georgali, and A
- Page 370 and 371:
VOLUME 19, 2001 ACOUSTIC EMISSION E
- Page 372 and 373:
VOLUME 20, 2002 Contents 20-001 DAM
- Page 374 and 375:
20-285 ACOUSTIC EMISSION CHARACTERI
- Page 376 and 377:
21-197 New Concept Of Ae Standard:
- Page 378 and 379:
22-243 Rods And Tubes As Ae Wavegui
- Page 380 and 381:
23-196 Ae And Electrochemical Noise
- Page 382 and 383:
Kazuaki Arai, Katsuyuki Kaiho, Hiro
- Page 384 and 385:
25-132 A SIMPLE METHOD TO COMPARE T
- Page 386 and 387:
25-373 IMPACT IMAGING METHOD TO MAP
- Page 388 and 389:
High-Voltage Electric Devices Jan P
- Page 390 and 391:
27-212 ELECTROMAGNETIC METHOD OF EL
- Page 392 and 393:
Authors Index, Volumes 1-27 (1982-2
- Page 394 and 395:
Thomas Bidlingmaier 14-S47 Jacek M.
- Page 396 and 397:
S. Y. Chuang 4-S137 S. S. Christian
- Page 398 and 399:
J.-P. Favre 9-97 Carol Featherston,
- Page 400 and 401:
Y. Haddad 8-S314 M. E. Hager 8-S42
- Page 402 and 403:
Y. Ichimura 19-142 Makoto Ichinose
- Page 404 and 405:
Kunihisa Katsuyama 11-S27 Harold E.
- Page 406 and 407:
MOSHE KUPIEC, 27-077 D. S. Kupperma
- Page 408 and 409:
Eric Madaras 23-037 M. R. Madhava 8
- Page 410 and 411:
F. Mostert 18-189 Andre Moura 23-10
- Page 412 and 413:
Tatsuma Ohnishi 19-109 Tadashi Onis
- Page 414 and 415:
M. Raab 20-274 Amani Raad 20-300 Ja
- Page 416 and 417:
Keiichi Sato, 4-S240, 8-S213, 9-209
- Page 418 and 419:
Wolfgang Stengel 4-S312 D. Stöver
- Page 420 and 421:
R.G. Tobin 8-25 Akira Todoroki 26-1
- Page 422 and 423:
M. Wevers, 4-S186, 8-S272, 13-79, 1
- Page 424:
Daihua Zou 5-S1 Ryszard Zuchowski 2


