- Page 1 and 2: TRACING ABUNDANCES IN GALAXIES WITH
- Page 3 and 4: TRACING ABUNDANCES IN GALAXIES WITH
- Page 5 and 6: BIOGRAPHICAL SKETCH Shannon was bor
- Page 7 and 8: ACKNOWLEDGEMENTS First and foremost
- Page 9 and 10: thank my husband Ryan. The rest of
- Page 11 and 12: 3 Chemical Abundances and Dust in P
- Page 13 and 14: LIST OF FIGURES 1.1 Diagram of the
- Page 15 and 16: ditionally we find that these nebul
- Page 17 and 18: seed nuclei relative to the β deca
- Page 19 and 20: shape (Carollo et al., 2007). These
- Page 21 and 22: Boltzmann velocity distribution cha
- Page 23 and 24: etween recapture and photoionizatio
- Page 25 and 26: a whole. Additionally, abundances f
- Page 27 and 28: at the appropriate temperature and
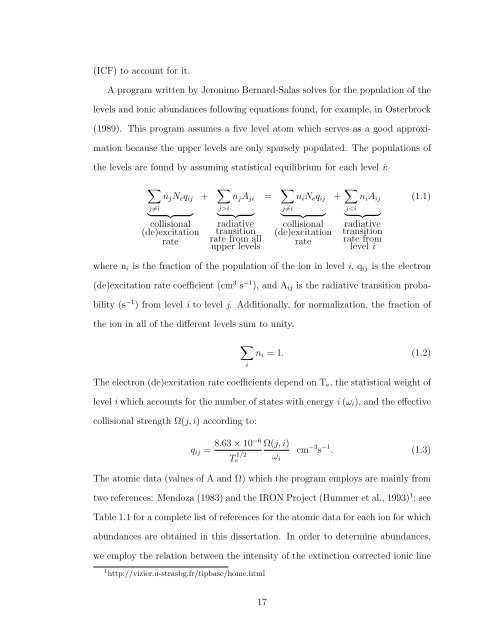
- Page 29: (a) 3.37 eV 1.40 eV 0.10 eV 0.04 eV
- Page 33 and 34: lines. For example, changing the ad
- Page 35 and 36: Figure 1.4 Starburst99 synthetic sp
- Page 37 and 38: Figure 1.5 Example of crystalline s
- Page 39 and 40: H H H H H H H H H Anthanthrene C H
- Page 41 and 42: year lifetime. Spitzer is in an Ear
- Page 43 and 44: CHAPTER 2 THE SPITZER IRS INFRARED
- Page 45 and 46: these elements than previous studie
- Page 47 and 48: dust is seen in the spectrum. We se
- Page 49 and 50: Figure 2.2 Close-ups of emission li
- Page 51 and 52: 2.4 Optical and UV Data We compleme
- Page 53 and 54: 2.5 Data Analysis Our goal is to ca
- Page 55 and 56: 2.5.2 Electron Density We assume an
- Page 57 and 58: Table 2.6 Electron temperatures ass
- Page 59 and 60: O, N, and C. The helium ionic abund
- Page 61 and 62: Barlow (1994) use UV lines for impo
- Page 63 and 64: is a spherical nebula with a low ma
- Page 65 and 66: CHAPTER 3 CHEMICAL ABUNDANCES AND D
- Page 67 and 68: essential data on important ionizat
- Page 69 and 70: are members of the Bulge, (Acker et
- Page 71 and 72: Table 3.2 Properties of observed GB
- Page 73 and 74: nod-averaged line fluxes. Uncertain
- Page 75 and 76: Table 3.3 Multiplicative scaling fa
- Page 77 and 78: Table 3.4 Observed infrared line fl
- Page 79 and 80: 3.5 Data Analysis 3.5.1 Abundances
- Page 81 and 82:
Table 3.6 Comparison of the derived
- Page 83 and 84:
from the most reliable line(s), and
- Page 85 and 86:
Table 3.7 Electron temperatures and
- Page 87 and 88:
Table 3.9 Ionic abundances Ion x a
- Page 89 and 90:
3.5.2 Crystalline Silicates Crystal
- Page 91 and 92:
argon, neon, and sulfur tend to be
- Page 93 and 94:
Figure 3.2 Continuum subtracted spe
- Page 95 and 96:
Figure 3.3 Profiles of PAH features
- Page 97 and 98:
mean argon and sulfur abundances ar
- Page 99 and 100:
of two smaller than that of Simpson
- Page 101 and 102:
towards the Galactic Center. On the
- Page 103 and 104:
Table 3.14 Parameters of linear fit
- Page 105 and 106:
models that show how a binary compa
- Page 107 and 108:
y an outer dense O-rich torus, indi
- Page 109 and 110:
CHAPTER 4 ABUNDANCES IN H II REGION
- Page 111 and 112:
expect their abundance ratio to rem
- Page 113 and 114:
We extract spectra processed throug
- Page 115 and 116:
Figure 4.2 IRS spectra of H II regi
- Page 117 and 118:
IRS slits from these WIRC observati
- Page 119 and 120:
S IV) we employ is equal to Te(O +2
- Page 121 and 122:
Figure 4.3 M51 H II region Ne III/N
- Page 123 and 124:
Figure 4.4 shows a plot of the (Ne
- Page 125 and 126:
James Webb Space Telescope (JWST);
- Page 127 and 128:
Bernard-Salas, J. & Tielens, A. G.
- Page 129 and 130:
Edgar, R. G., Nordhaus, J., Blackma
- Page 131 and 132:
Hummer, D. G., Berrington, K. A., E
- Page 133 and 134:
Matsuura, M., Zijlstra, A. A., Mols
- Page 135 and 136:
Pradhan, A. K., Montenegro, M., Nah
- Page 137:
Vassiliadis, E. & Wood, P. R. 1993,