TRACING ABUNDANCES IN GALAXIES WITH THE SPITZER ...
TRACING ABUNDANCES IN GALAXIES WITH THE SPITZER ...
TRACING ABUNDANCES IN GALAXIES WITH THE SPITZER ...

Create successful ePaper yourself
Turn your PDF publications into a flip-book with our unique Google optimized e-Paper software.
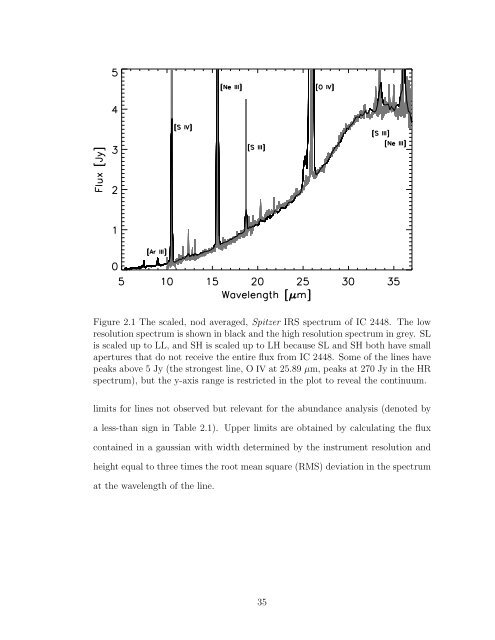
Figure 2.1 The scaled, nod averaged, Spitzer IRS spectrum of IC 2448. The low<br />
resolution spectrum is shown in black and the high resolution spectrum in grey. SL<br />
is scaled up to LL, and SH is scaled up to LH because SL and SH both have small<br />
apertures that do not receive the entire flux from IC 2448. Some of the lines have<br />
peaks above 5 Jy (the strongest line, O IV at 25.89 µm, peaks at 270 Jy in the HR<br />
spectrum), but the y-axis range is restricted in the plot to reveal the continuum.<br />
limits for lines not observed but relevant for the abundance analysis (denoted by<br />
a less-than sign in Table 2.1). Upper limits are obtained by calculating the flux<br />
contained in a gaussian with width determined by the instrument resolution and<br />
height equal to three times the root mean square (RMS) deviation in the spectrum<br />
at the wavelength of the line.<br />
35