H & M HENNES & MAURITZ AB THREE-MONTH REPORT - Cision
H & M HENNES & MAURITZ AB THREE-MONTH REPORT - Cision
H & M HENNES & MAURITZ AB THREE-MONTH REPORT - Cision

You also want an ePaper? Increase the reach of your titles
YUMPU automatically turns print PDFs into web optimized ePapers that Google loves.
<strong>THREE</strong>-<strong>MONTH</strong> <strong>REPORT</strong> 2013<br />
H & M <strong>HENNES</strong> & <strong>MAURITZ</strong> <strong>AB</strong><br />
<strong>THREE</strong>-<strong>MONTH</strong> <strong>REPORT</strong><br />
1 December 2012 – 28 February 2013<br />
FIRST QUARTER<br />
<br />
The H&M Group’s sales including VAT increased in local currencies by 6 percent during the first quarter.<br />
Sales in the quarter have been negatively affected by calendar effects by slightly more than 2 percentage<br />
points. Converted into SEK, sales excluding VAT amounted to SEK 28,392 m (27,832), an increase of<br />
2 percent. The difference in sales performance in local currencies versus SEK is explained by substantial<br />
negative currency translation effects as a result of the continued strengthening of the Swedish krona against<br />
most sales countries’ currencies.<br />
Gross profit amounted to SEK 15,679 m (15,537), corresponding to a gross margin of 55.2 percent (55.8).<br />
Increased markdowns have negatively affected the gross margin by 0.5 percentage points in relation to<br />
sales compared to the corresponding quarter last year.<br />
<br />
<br />
<br />
Profit after financial items amounted to SEK 3,234 m (3,701). The Group’s profit after tax amounted to<br />
SEK 2,458 m (2,739), corresponding to SEK 1.49 (1.65) per share. Profits have been negatively affected<br />
by large long-term investments but also by substantial negative currency translation effects.<br />
------------------------------------------------------------------------------------------------------------------<br />
Fantastic reception for the new fashion brand & Other Stories launched in March.<br />
H&M is ramping up the pace of expansion. The expansion plan for financial year 2013 has been<br />
increased to around 350 new stores net from the 325 previously planned.<br />
Chile, Estonia, Lithuania, Serbia and, via franchise, Indonesia will become new H&M markets in 2013.<br />
Australia will become a new market for H&M in 2014.<br />
An extended sports concept will be launched at the beginning of 2014.<br />
Comments by CEO Karl-Johan Persson<br />
“The first quarter has been characterised by the continued challenging situation for the fashion retail industry in<br />
many of our markets mainly due to a continued tough macro-economic climate, but also due to unfavourable<br />
weather during parts of the quarter. This meant that sales in the first quarter did not reach our expectations.<br />
The reported sales increase in SEK has been affected by substantial negative currency translation and calendar<br />
effects of almost SEK 2 billion – adjusted for these negative effects the sales increase was 8 percent.<br />
Our new fashion brand & Other Stories has been tremendously well received at its launch this March. Sales, both<br />
in stores and online, have far exceeded our high expectations. This clearly shows that the long-term work behind<br />
the development of & Other Stories has been completely right. This opens the possibility that & Other Stories can<br />
expand more widely and faster than we originally planned. We see great potential for & Other Stories in both the<br />
short and the long term, and are convinced that our new brand will become an important part of the H&M Group.<br />
2013 will be a challenging and exciting year with continued strong expansion. We are ramping up the rate of<br />
expansion to approximately 350 new stores net compared to the originally planned 325. We will open in five new<br />
countries in 2013 and are also preparing to open in other countries in 2014, such as in Australia. We are also<br />
continuing to work on our long-term investments in IT, online, & Other Stories and the broadening of our range.<br />
An example of this will be the launch of H&M’s updated and extended sports concept for women, men and<br />
children at the beginning of 2014. The range will be significantly broader than today and will consist of sportswear<br />
and accessories in specially developed functional materials suited to various kinds of sporting activities.”<br />
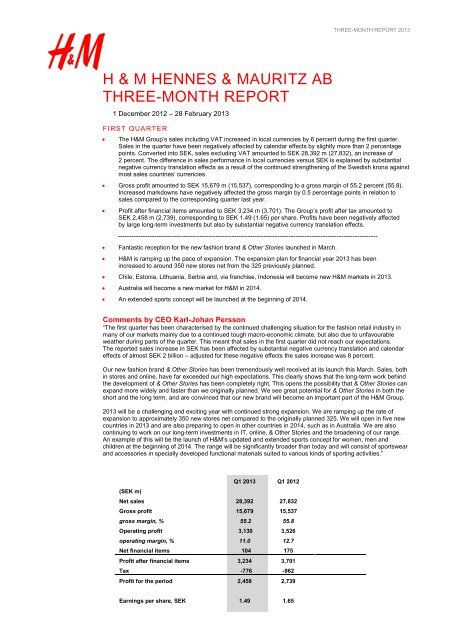
Q1 2013 Q1 2012<br />
(SEK m)<br />
Net sales 28,392 27,832<br />
Gross profit 15,679 15,537<br />
gross margin, % 55.2 55.8<br />
Operating profit 3,130 3,526<br />
operating margin, % 11.0 12.7<br />
Net financial items 104 175<br />
Profit after financial items 3,234 3,701<br />
Tax -776 -962<br />
Profit for the period 2,458 2,739<br />
Earnings per share, SEK 1.49 1.65
<strong>THREE</strong>-<strong>MONTH</strong> <strong>REPORT</strong> 2013<br />
Sales and store openings<br />
Sales including VAT increased by 6 percent, in local currencies, in the first quarter. Sales<br />
in comparable units decreased by 3 percent. Converted into SEK, sales increased by<br />
2 percent to SEK 33,146 m (32,503). Sales excluding VAT increased to SEK 28,392 m<br />
(27,832), an increase of 2 percent. Sales in the first quarter were negatively affected by<br />
calendar effects by slightly more than 2 percentage points.<br />
In February 2013, sales including VAT increased by 5 percent in local currencies<br />
compared to the same month last year. Sales in comparable units decreased by<br />
3 percentage points. Sales in February were negatively affected by slightly more than<br />
3 percentage points due to the leap day on 29 February 2012.<br />
The Group opened 54 (29) stores and closed 12 (10) stores during the first quarter. The<br />
total number of stores in the Group as per 28 February 2013 thus amounted to 2,818<br />
(2,491), including 92 franchise stores, 65 COS stores, 61 Monki stores, 21 Weekday stores<br />
and 4 Cheap Monday stores.<br />
Results for the first quarter<br />
Gross profit for the Group for the first three months amounted to SEK 15,679 m (15,537).<br />
This corresponds to a gross margin of 55.2 percent (55.8).<br />
The operating profit amounted to SEK 3,130 m (3,526). This corresponds to an operating<br />
margin of 11.0 percent (12.7).<br />
Operating profit for the first quarter has been charged with depreciation amounting to SEK<br />
1,030 m (911).<br />
Consolidated net interest income was SEK 104 m (175).<br />
Profit after financial items amounted to SEK 3,234 m (3,701).<br />
The Group’s profit for the three-month period after an estimated tax rate of 24 percent (26)<br />
was SEK 2,458 m (2,739), which represents earnings per share of SEK 1.49 (1.65), a<br />
decrease of 10 percent.<br />
Return on shareholders’ equity was 36.3 percent (34.9) and return on capital employed<br />
was 47.3 percent (45.8).<br />
2
<strong>THREE</strong>-<strong>MONTH</strong> <strong>REPORT</strong> 2013<br />
Comments on the first quarter<br />
Sales have been characterised by the challenging situation for the fashion retail industry in<br />
many of H&M’s markets, mostly due to the continued tough macro-economic climate and<br />
unfavourable weather during parts of the quarter primarily in Europe and North America.<br />
Although sales in Asia continued to be strong and that the completely mobile-adapted H&M<br />
shop online which was launched in January in eight existing online markets was very well<br />
received by customers, Group sales did not live up to the company’s own expectations.<br />
Reported sales in SEK in the quarter were affected by substantial currency translation<br />
effects as a result of the continued strengthening of the Swedish krona against most sales<br />
countries’ currencies. To illustrate the great impact of the currency translation effects on<br />
sales in the quarter: the reported sales figure of SEK 33,146 m would have been<br />
SEK 1.3 billion higher using the same currency rates as in Q1 2012. The quarter has<br />
also been affected by negative calendar effects of slightly more than 2 percentage points<br />
compared to Q1 2012.<br />
H&M’s gross margin is a result of many different factors, internal as well as external, and is<br />
also affected by the decisions that H&M makes in line with its strategy to always have the<br />
best customer offering in each individual market – based on the combination of fashion,<br />
quality, price and sustainability. The gross margin for the quarter amounted to 55.2 percent<br />
(55.8). The overall effect of cotton prices, cost inflation and the US dollar – which is the<br />
most significant purchasing currency – are considered to have had a neutral effect on<br />
purchases for the first quarter compared to the corresponding purchasing period the<br />
previous year.<br />
Markdowns in relation to sales had a negative effect on the gross margin of 0.5 percentage<br />
points compared to the first quarter 2012.<br />
Selling and administrative expenses in the quarter amounted to SEK 12,549 m (12,011),<br />
an increase of 4 percent. In local currencies the increase was 8 percent. The cost increase<br />
compared to the first quarter 2012 is due to the expansion and to the long-term<br />
investments within IT, online sales, & Other Stories as well as in broadening the range.<br />
These investments aim to further strengthen H&M’s market position in the long term and to<br />
secure future expansion. Cost control in the Group remains good and costs in comparable<br />
stores decreased compared to the same quarter last year.<br />
Operating profit amounted to SEK 3,130 m (3,526), corresponding to an operating margin<br />
of 11.0 percent (12.7). Profit after financial items amounted to SEK 3,234 m (3,701). Profits<br />
were negatively affected by the above-mentioned long-term investments and also by<br />
substantial negative currency translation effects. Currency translation effects arise when<br />
converting local currencies into SEK, H&M’s reporting currency.<br />
The stock-in-trade increased by 12 percent compared to the same time the previous year<br />
and amounted to SEK 13,825 m (12,397). In local currencies the increase was 14 percent.<br />
The increase is mainly explained by the expansion but also by the fact that sales did not<br />
increase as much as planned. The stock-in-trade amounted to 11.4 percent (10.9) of sales<br />
excluding VAT (rolling 12 months) and 22.8 percent (21.0) of total assets. The composition<br />
of the stock-in-trade as of 28 February 2013 is deemed to be satisfactory, but the level is<br />
somewhat higher than planned.<br />
3
<strong>THREE</strong>-<strong>MONTH</strong> <strong>REPORT</strong> 2013<br />
Financial position and cash flow<br />
Expansion<br />
Consolidated total assets as per 28 February 2013 amounted to SEK 60,734 m (59,078).<br />
The current operations generated a positive cash flow of SEK 3,777 m (2,218). Cash flow<br />
was among other things affected by investments in fixed assets of SEK -1,635 m (-1,134)<br />
and by changes in short-term investments with a duration of four to twelve months of<br />
SEK -4,023 m (-1,411). During the three-month period, the Group generated a cash flow of<br />
SEK -1,874 m (-309). Liquid funds and short-term investments amounted to SEK 18,959 m<br />
(22,029).<br />
The equity/assets ratio was 75.1 percent (77.6) and the share of risk-bearing capital was<br />
78.4 percent (79.1).<br />
Shareholders’ equity apportioned on the outstanding 1,655,072,000 (1,655,072,000)<br />
shares as per 28 February 2013 was SEK 27.57 (27.70).<br />
H&M remains positive as regards future expansion and the Group’s business<br />
opportunities.<br />
H&M’s growth target remains intact. The growth target is to increase the number of stores<br />
by 10-15 percent per year with continued high profitability, while at the same time<br />
increasing sales in comparable units.<br />
H&M is ramping up the pace of expansion. The expansion plan for financial year 2013 has<br />
been increased to around 350 new stores net from the 325 previously planned. Most new<br />
stores during 2013 are planned to open in China and the US. There are also still great<br />
opportunities for expansion in markets such as Russia, Germany, the UK, Italy, Poland and<br />
France. In 2013 H&M plans to open stores in the following five new countries: Chile,<br />
Estonia, Lithuania, Serbia and, via franchise, Indonesia.<br />
On 23 March, 2013, H&M will open its first store in South America in Santiago de Chile.<br />
The store will be a flagship store in the best location in the Costanera Center shopping<br />
mall. In autumn 2013, the first H&M stores will open in Lithuania – one store in Vilnius and<br />
one in Klaipeda. During the autumn the first three H&M stores will open in Tallinn, Estonia<br />
along with the first two H&M stores in Belgrade in Serbia. During autumn 2013 the first<br />
H&M store in Jakarta, Indonesia will open via franchise in cooperation with the franchisee<br />
J.S. Gill.<br />
In summer 2013 H&M will launch its online sales in the US, the world’s largest online<br />
market.<br />
Expansion continues for the Group’s other brands COS, Monki, Weekday and Cheap<br />
Monday. COS, for example, opened its first store in Dubai, UAE in February 2013 and in<br />
Oslo, Norway in March 2013. Monki and Weekday will open their first stores in Japan<br />
during spring 2013 and Monki will also open its first store in Paris, France during the<br />
spring. Cheap Monday will open its first store in Paris, France in the autumn. In addition to<br />
this, Weekday has launched online shopping in 18 countries in early 2013. H&M Home will<br />
also continue to expand.<br />
The new fashion brand & Other Stories has had a fantastic reception for the launch of its<br />
collections in ten European countries in the month of March. Online shopping at<br />
stories.com was launched on 8 March in Belgium, Denmark, Finland, France, Germany,<br />
Italy, the Netherlands, Spain, Sweden and the UK. & Other Stories has so far opened<br />
stores in London and Copenhagen and will open its first store in Stockholm tomorrow,<br />
22 March. This will be followed by openings in Barcelona, Berlin, Milan and Paris during<br />
spring 2013.<br />
4
<strong>THREE</strong>-<strong>MONTH</strong> <strong>REPORT</strong> 2013<br />
In early 2014 H&M will launch an updated and extended sports concept for women, men<br />
and children. The range will be significantly broader than today and will consist of<br />
sportswear and accessories in specially developed functional materials suited to various<br />
kinds of sporting activities. The concept will initially be launched in H&M’s existing online<br />
markets as well as in selected H&M stores in 15 countries.<br />
H&M will open in Australia during 2014.<br />
Tax<br />
The Swedish corporate tax rate was reduced from 26.3 percent to 22 percent as of<br />
1 January 2013. The Group’s final tax rate depends on the results of its various companies<br />
and the corporate tax rates in each country. The H&M Group’s tax rate for the financial<br />
year 2012/2013 is expected to be 23 – 24 percent and a tax rate of 24 has been used in<br />
the first quarter 2013.<br />
Parent company<br />
The parent company’s external sales amounted to SEK 1 m (1) in the first quarter 2013.<br />
Profit after financial items amounted to SEK 187 m (382). Investments in fixed assets<br />
amounted to SEK 14 m (180).<br />
Comments on the current quarter<br />
The unusually cold weather and snowstorms in many markets in March have delayed the<br />
start of the season for the spring collection. The late spring has had a negative effect on<br />
sales, particularly in Europe and North America. Sales in March, which will be published on<br />
15 April 2013, should be seen in the light of a very strong sales increase of 26 percent in<br />
March 2012.<br />
Annual Report 2012<br />
The Annual Report and the Corporate Governance Report are expected to be published on<br />
26 March 2013 on www.hm.com and will be sent out by post to shareholders that have so<br />
requested and will also be available at the company’s head office.<br />
Accounting principles<br />
The Group applies the International Financial Reporting Standards (IFRS) as adopted by the EU.<br />
This report has been prepared according to IAS 34 Interim Financial Reporting as well as the<br />
Swedish Annual Accounts Act.<br />
The accounting principles and calculation methods applied in this report are unchanged<br />
from those used in the preparation of the Annual Report and Consolidated Financial<br />
Statements for 2010/2011 which is described in Note 1 – Accounting principles.<br />
The parent company applies the Swedish Annual Accounts Act and the Swedish Financial<br />
Reporting Board’s recommendation RFR 2 Accounting for Legal Entities, which essentially<br />
involves applying IFRS. In accordance with RFR 2 the parent company does not apply IAS<br />
39 to the measurement of financial instruments; nor does it capitalise development<br />
expenditure.<br />
Risks and uncertainties<br />
A number of factors may affect H&M’s results and business. Most of these can be dealt<br />
with through internal routines, while certain others are affected more by external<br />
influences. There are risks and uncertainties related to fashion, weather situations,<br />
negative macro-economic changes, changes in consumer behaviour, climate changes,<br />
trade interventions, external factors in production countries and foreign currency, but also<br />
in connection with expansion into new markets, the launch of new concepts and how the<br />
brand is managed.<br />
For a more detailed description of risks and uncertainties, refer to the Administration<br />
Report and to Note 2 in the Annual Report and Consolidated Accounts for 2011.<br />
5
<strong>THREE</strong>-<strong>MONTH</strong> <strong>REPORT</strong> 2013<br />
Key-ratio definitions<br />
Return on equity: Profit for the year in relation to average shareholders’ equity.<br />
Return on capital employed: Profit after financial items plus interest expense in relation<br />
to average shareholders’ equity plus average interest-bearing liabilities.<br />
Share of risk-bearing capital: Shareholders’ equity plus deferred tax liability in relation to<br />
the balance sheet total.<br />
Equity/assets ratio: Shareholders’ equity in relation to the balance sheet total.<br />
Equity per share: Shareholders’ equity divided by number of shares.<br />
P/E ratio: Price per share divided by earnings per share.<br />
Comparable units: Comparable units comprise the stores and the internet and catalogue<br />
sales countries that have been in operation for at least one financial year. H&M’s financial<br />
year is from 1 December to 30 November.<br />
All figures within parenthesis refer to the corresponding period or point of time the previous year.<br />
CALENDAR<br />
26 March 2013 The Annual Report 2012 to be published<br />
23 April 2013 Annual General Meeting 2013, Victoriahallen, at the Stockholm<br />
International Fairs at 3 p.m.<br />
19 June 2013 Six-month report, 1 December 2012 – 31 May 2013<br />
26 September 2013 Nine-month report, 1 December 2012 – 31 August 2013<br />
30 January 2014 Full-year report, 1 December 2012 – 30 November 2013<br />
The three-month report has not been audited by the company’s auditors.<br />
Stockholm, 20 March 2013<br />
Board of Directors<br />
The information in this Interim Report is that which H & M Hennes & Mauritz <strong>AB</strong> (publ) is required<br />
to disclose under Sweden’s Securities Market Act. It will be released for publication at 8.00 (CET)<br />
on 21 March 2013.<br />
CONTACT PERSONS<br />
Nils Vinge, IR +46-8-796 52 50<br />
Karl-Johan Persson, CEO<br />
Jyrki Tervonen, CFO<br />
+46-8-796 55 00 (switchboard)<br />
+46-8-796 55 00 (switchboard)<br />
H & M Hennes & Mauritz <strong>AB</strong> (publ)<br />
SE-106 38 Stockholm<br />
Phone: +46-8-796 55 00, Fax: +46-8-24 80 78, E-mail: info@hm.com<br />
Registered office: Stockholm, Reg. No. 556042-722<br />
H & M Hennes & Mauritz <strong>AB</strong> (publ) was founded in Sweden in 1947 and is quoted on NASDAQ OMX Stockholm. The company’s<br />
business concept is to offer fashion and quality at the best price. In addition to H&M, the group includes the brands COS, Monki,<br />
Weekday and Cheap Monday, & Other Stories as well as H&M Home. The H&M Group has more than 2,800 stores in 48 markets<br />
including franchise markets. In 2012, sales including VAT were SEK 140,948 million and the number of employees was more than<br />
104,000. For further information, visit www.hm.com.<br />
6
GROUP INCOME STATEMENT (SEK m)<br />
<strong>THREE</strong>-<strong>MONTH</strong> <strong>REPORT</strong> 2013<br />
1 Dec 2012- 1 Dec 2011- 1 Dec 2011-<br />
28 Feb 2013 29 Feb 2012 30 Nov 2012<br />
Sales including VAT 33,146 32,503 140,948<br />
Sales excluding VAT 28,392 27,832 120,799<br />
Cost of goods sold -12,713 -12,295 -48,928<br />
GROSS PROFIT 15,679 15,537 71,871<br />
Gross margin, % 55.2 55.8 59.5<br />
Selling expenses -11,581 -11,168 -46,608<br />
Administrative expenses -968 -843 -3,509<br />
OPERATING PROFIT 3,130 3,526 21,754<br />
Operating margin, % 11.0 12.7 18.0<br />
Interest income 104 176 536<br />
Interest expense 0 -1 -5<br />
PROFIT AFTER FINANCIAL ITEMS 3,234 3,701 22,285<br />
Tax -776 -962 -5,418<br />
PROFIT FOR THE PERIOD 2,458 2,739 16,867<br />
All profit is attributable to the shareholders of the parent company H & M Hennes & Mauritz <strong>AB</strong>.<br />
Earnings per share, SEK* 1.49 1.65 10.19<br />
Number of shares, thousands* 1,655,072 1,655,072 1,655,072<br />
Depreciation, total 1,030 911 3,705<br />
of which cost of goods sold 115 102 415<br />
of which selling expenses 852 754 3,065<br />
of which administrative expenses 63 55 225<br />
* Before and after dilution.<br />
CONSOLIDATED STATEMENT OF COMPREHENSIVE INCOME (SEK m)<br />
1 Dec 2012- 1 Dec 2011- 1 Dec 2011-<br />
28 Feb 2013 29 Feb 2012 30 Nov 2012<br />
PROFIT FOR THE PERIOD 2,458 2,739 16,867<br />
Other comprehensive income<br />
Translation differences -918 -833 -1,212<br />
Change in hedging reserves 338 -214 -272<br />
Tax attributable to other comprehensive income -88 56 71<br />
OTHER COMPREHENSIVE INCOME -668 -991 -1,413<br />
TOTAL COMPREHENSIVE INCOME FOR THE PERIOD 1,790 1,748 15,454<br />
All comprehensive profit is attributable to the shareholders of the parent company H & M Hennes & Mauritz <strong>AB</strong>.<br />
7
<strong>THREE</strong>-<strong>MONTH</strong> <strong>REPORT</strong> 2013<br />
GROUP BALANCE SHEET IN SUMMARY (SEK m)<br />
ASSETS<br />
28 Feb 2013 29 Feb 2012 30 Nov 2012<br />
Fixed assets<br />
Intangible fixed assets 1,729 1,123 1,558<br />
Tangible fixed assets 18,944 16,972 19,131<br />
Financial assets 2,161 1,846 2,252<br />
22,834 19,941 22,941<br />
Current assets<br />
Stock-in-trade 13,825 12,397 15,213<br />
Current receivables 5,116 4,711 4,876<br />
Short-term investments, 4-12 months 7,018 8,369 2,995<br />
Liquid funds 11,941 13,660 14,148<br />
37,900 39,137 37,232<br />
TOTAL ASSETS 60,734 59,078 60,173<br />
EQUITY AND LI<strong>AB</strong>ILITIES<br />
Equity 45,625 45,852 43,835<br />
Long-term liabilities* 2,399 1,255 2,328<br />
Current liabilities** 12,710 11,971 14,010<br />
TOTAL EQUITY AND LI<strong>AB</strong>ILITIES 60,734 59,078 60,173<br />
* Only provisions for pensions are interest-bearing.<br />
** No current liabilities are interest-bearing.<br />
CHANGE IN GROUP EQUITY IN SUMMARY (SEK m)<br />
28 Feb 2013 29 Feb 2012 30 Nov 2012<br />
Shareholders' equity at the beginning of the period 43,835 44,104 44,104<br />
Total comprehensive income for the period 1,790 1,748 15,454<br />
Dividend - - -15,723<br />
Shareholders' equity at the end of the period 45,625 45,852 43,835<br />
8
<strong>THREE</strong>-<strong>MONTH</strong> <strong>REPORT</strong> 2013<br />
GROUP CASH FLOW STATEMENT (SEK m)<br />
Current operations<br />
1 Dec 2012- 1 Dec 2011-<br />
28 Feb 2013 29 Feb 2012<br />
Profit after financial items* 3,234 3,701<br />
Provisions for pensions 18 12<br />
Depreciation 1,030 911<br />
Tax paid -303 -2,784<br />
Cash flow from current operations before changes<br />
in working capital 3,979 1,840<br />
Cash flow from changes in working capital<br />
Current receivables -483 -88<br />
Stock-in-trade 1,158 1,255<br />
Current liabilities -877 -789<br />
CASH FLOW FROM CURRENT OPERATIONS 3,777 2,218<br />
Investment activities<br />
Investment in intangible fixed assets -245 -168<br />
Investment in tangible fixed assets -1,390 -966<br />
Change in short-term investments, 4 - 12 months -4,023 -1,411<br />
Other investments 7 18<br />
CASH FLOW FROM INVESTMENT ACTIVITIES -5,651 -2,527<br />
CASH FLOW FOR THE PERIOD -1,874 -309<br />
Liquid funds at beginning of the financial year 14,148 14,319<br />
Cash flow for the period -1,874 -309<br />
Exchange rate effect -333 -350<br />
Liquid funds at end of the period** 11,941 13,660<br />
* Interest paid for the Group amounts to SEK 0 m (1).<br />
** Liquid funds and short-term investments 4-12 months at the end of the period amounted to SEK 18,959 m (22,029).<br />
9
SALES INCLUDING VAT BY COUNTRY AND NUMBER OF STORES<br />
<strong>THREE</strong>-<strong>MONTH</strong> <strong>REPORT</strong> 2013<br />
First quarter, 1 December - 28 February<br />
SEK m SEK m Change in % No. of stores New Closed<br />
COUNTRY Q1-2013 Q1-2012 SEK Local currency 28 Feb 2013 stores stores<br />
Sweden 1,938 2,010 -4 -4 176 1<br />
Norway 1,352 1,359 -1 0 110 1<br />
Denmark 1,044 1,021 2 7 94<br />
United Kingdom 2,226 2,366 -6 -2 228 2<br />
Switzerland 1,269 1,403 -10 -5 82<br />
Germany 7,010 7,289 -4 0 406 3 3<br />
Netherlands 1,486 1,567 -5 -1 127 3<br />
Belgium 777 801 -3 1 71 1<br />
Austria 1,099 1,137 -3 1 68<br />
Luxembourg 86 93 -8 -2 10<br />
Finland 592 572 3 8 53<br />
France 2,343 2,383 -2 3 185 4 1<br />
USA 3,010 2,797 8 13 269 4 4<br />
Spain 1,373 1,462 -6 -2 149 4 1<br />
Poland 726 666 9 9 106 3<br />
Czech Republic 190 172 10 15 31<br />
Portugal 205 221 -7 -4 23<br />
Italy 1,117 1,057 6 10 105 2 1<br />
Canada 668 656 2 6 62 1<br />
Slovenia 103 111 -7 -4 12<br />
Ireland 136 139 -2 2 16<br />
Hungary 162 128 27 27 27 1<br />
Slovakia 88 75 17 22 13<br />
Greece 216 202 7 11 25<br />
China 1,319 1,075 23 27 145 11<br />
Japan 571 409 40 64 24 2<br />
Russia 502 372 35 40 40 3<br />
South Korea 144 109 32 32 11<br />
Turkey 105 83 27 30 11<br />
Romania 188 127 48 59 22 3<br />
Croatia 140 98 43 50 11<br />
Singapore 144 98 47 48 2<br />
Bulgaria 46 6 2<br />
Lettland 27 2<br />
Malaysia 89 3 1<br />
Mexico 79 1<br />
Franchise 576 445 29 36 92 4<br />
Total 33,146 32,503 2 6 2,818 54 12<br />
10
FIVE YEAR SUMMARY<br />
First quarter, 1 December - 28 February<br />
<strong>THREE</strong>-<strong>MONTH</strong> <strong>REPORT</strong> 2013<br />
2013 2012 2011 2010 2009<br />
Sales including VAT, SEK m 33,146 32,503 28,708 29,095 27,282<br />
Sales excluding VAT, SEK m 28,392 27,832 24,503 24,846 23,299<br />
Change from previous year, % 2 14 -1 7 18<br />
Operating profit, SEK m 3,130 3,526 3,408 4,978 3,364<br />
Operating margin, % 11.0 12.7 13.9 20.0 14.4<br />
Depreciation for the period, SEK m 1,030 911 808 772 721<br />
Profit after financial items, SEK m 3,234 3,701 3,538 5,055 3,554<br />
Profit after tax, SEK m 2,458 2,739 2,618 3,741 2,577<br />
Liquid funds and short-term investments, SEK m 18,959 22,029 24,355 26,200 23,625<br />
Stock-in-trade, SEK m 13,825 12,397 10,822 8,402 9,052<br />
Equity, SEK m 45,625 45,852 45,587 43,746 41,043<br />
Number of shares, thousands* 1,655,072 1,655,072 1,655,072 1,655,072 1,655,072<br />
Earnings per share, SEK* 1.49 1.65 1.58 2.26 1.56<br />
Shareholders' equity per share, SEK* 27.57 27.70 27.54 26.43 24.80<br />
Cash flow from current operations<br />
per share, SEK* 2.28 1.34 0.46 3.25 0.75<br />
Share of risk-bearing capital, % 78.4 79.1 81.4 80.8 77.9<br />
Equity/assets ratio, % 75.1 77.6 79.9 77.2 74.6<br />
Total number of stores 2,818 2,491 2,212 1,992 1,748<br />
Rolling twelve months<br />
Earnings per share, SEK* 10.02 9.63 10.61 10.60 9.02<br />
Return on shareholders' equity, % 36.3 34.9 39.3 41.4 39.4<br />
Return on capital employed, % 47.3 45.8 52.3 55.4 54.3<br />
* Before and after dilution.<br />
Definition on key figures see page 6.<br />
11
KEY RATIOS PER QUARTER<br />
<strong>THREE</strong>-<strong>MONTH</strong> <strong>REPORT</strong> 2013<br />
2010 2011 2012<br />
Q1 Q2 Q3 Q4 Q1 Q2 Q3 Q4 Q1 Q2 Q3 Q4 Q1<br />
2013<br />
Sales including VAT, SEK m 29,095 31,604 31,475 34,792 28,708 32,400 31,511 36,191 32,503 36,947 33,568 37,930 33,146<br />
Sales excluding VAT, SEK m 24,846 27,033 26,893 29,711 24,503 27,632 26,912 30,952 27,832 31,658 28,806 32,502 28,392<br />
Change from previous year, % 7 2 14 6 -1 2 0 4 14 15 7 5 2<br />
Operating profit, SEK m 4,978 6,965 5,656 7,060 3,408 5,599 4,707 6,665 3,526 6,893 4,802 6,533 3,130<br />
Operating margin, % 20.0 25.8 21.0 23.8 13.9 20.3 17.5 21.5 12.7 21.8 16.7 20.1 11.0<br />
Depr. for the period, SEK m 772 783 777 729 808 826 831 797 911 929 921 944 1,030<br />
Profit after financial items, SEK m 5,055 7,040 5,735 7,178 3,538 5,752 4,850 6,802 3,701 7,053 4,895 6,636 3,234<br />
Profit after tax, SEK m 3,741 5,209 4,244 5,487 2,618 4,257 3,589 5,357 2,739 5,219 3,622 5,287 2,458<br />
Liquid assets*, SEK m 26,200 18,992 21,362 24,858 24,355 15,207 16,895 21,277 22,029 13,543 13,552 17,143 18,959<br />
Stock-in-trade, SEK m 8,402 8,562 10,545 11,487 10,822 10,414 13,310 13,819 12,397 11,299 13,501 15,213 13,825<br />
Equity, SEK m 43,746 36,064 39,352 44,172 45,587 33,946 38,214 44,104 45,852 36,516 38,275 43,835 45,625<br />
Earnings per share, SEK** 2.26 3.15 2.56 3.32 1.58 2.57 2.17 3.24 1.65 3.15 2.19 3.19 1.49<br />
Equity per share, SEK** 26.43 21.79 23.78 26.69 27.54 20.51 23.09 26.65 27.70 22.06 23.13 26.49 27.57<br />
Cash flow from current<br />
operations per share, SEK** 3.25 4.30 2.23 3.42 0.46 4.70 1.62 3.75 1.34 5.11 1.43 3.54 2.28<br />
Share of risk-bearing capital, % 80.8 75.9 75.8 76.2 81.4 73.0 72.9 74.9 79.1 73.5 74.0 76.1 78.4<br />
Equity/assets ratio, % 77.2 71.8 72.3 74.6 79.9 71.3 71.4 73.3 77.6 71.5 72.3 72.8 75.1<br />
Total number of stores 1,992 2,062 2,078 2,206 2,212 2,297 2,325 2,472 2,491 2,575 2,629 2,776 2,818<br />
Rolling 12 months<br />
Earnings per share, SEK** 10.61 11.22 11.69 11.29 10.61 10.03 9.64 9.56 9.63 10.21 10.23 10.19 10.02<br />
Return on shareholders' equity, % 41.4 54.8 52.3 44.1 39.3 47.4 41.1 35.8 34.9 48.0 44.3 38.4 36.3<br />
Return on capital employed, % 55.4 72.9 69.3 58.7 52.3 63.0 54.6 47.1 45.8 63.0 58.2 50.3 47.3<br />
Stock-in-trade in % of turnover 8.2 8.3 9.9 10.6 10.0 9.6 12.2 12.6 10.9 9.6 11.3 12.6 11.4<br />
* Liquid funds and short-term investments<br />
** Calculation based on 1,655,072,000 shares in all periods before and after dilution.<br />
Definitions on key figures see page 6.<br />
12
SEGMENT <strong>REPORT</strong>ING (SEK m)<br />
<strong>THREE</strong>-<strong>MONTH</strong> <strong>REPORT</strong> 2013<br />
1 Dec 2012- 1 Dec 2011-<br />
28 Feb 2013 29 Feb 2012<br />
Asia<br />
External net sales 2,669 2,008<br />
Operating profit 225 309<br />
Operating margin, % 8.4 15.4<br />
Europe<br />
External net sales 22,196 22,574<br />
Operating profit -934 -656<br />
Operating margin, % -4.2 -2.9<br />
North- and South America<br />
External net sales 3,527 3,250<br />
Operating profit -336 7<br />
Operating margin, % -9.5 0.2<br />
Group Functions<br />
Net sales to other segments 13,399 14,457<br />
Operating profit 4,175 3,866<br />
Eliminations<br />
Net sales to other segments -13,399 -14,457<br />
Total<br />
External net sales 28,392 27,832<br />
Operating profit 3,130 3,526<br />
Operating margin, % 11.0 12.7<br />
In order to better reflect the company's current geographical spread, as of 2013 the segment reporting has been divided<br />
into the following three segments: Europa, Asia and North- and South America. The parent company and other subsidiaries<br />
with no external sales are reported in a separate Group-wide segment.<br />
13
PARENT COMPANY INCOME STATEMENT (SEK m)<br />
<strong>THREE</strong>-<strong>MONTH</strong> <strong>REPORT</strong> 2013<br />
1 Dec 2012- 1 Dec 2011- 1 Dec 2011-<br />
28 Feb 2013 29 Feb 2012 30 Nov 2012<br />
External sales excluding VAT 1 1 30<br />
Internal sales excluding VAT* 1,726 1,647 7,271<br />
GROSS PROFIT 1,727 1,648 7,301<br />
Selling expenses -593 -658 -2,788<br />
Administrative expenses -968 -660 -3,281<br />
OPERATING PROFIT 166 330 1,232<br />
Dividend from subsidiaries - - 14,518<br />
Interest income 21 52 139<br />
Interest expense - - -1<br />
PROFIT AFTER FINANCIAL ITEMS 187 382 15,888<br />
Year-end appropriations - - -328<br />
Tax -49 -100 -255<br />
PROFIT FOR THE PERIOD 138 282 15,305<br />
* Includes royalty received from Group companies<br />
PARENT COMPANY STATEMENT OF COMPREHENSIVE INCOME (SEK m)<br />
1 Dec 2012- 1 Dec 2011- 1 Dec 2011-<br />
28 Feb 2013 29 Feb 2012 30 Nov 2012<br />
PROFIT FOR THE PERIOD 138 282 15,305<br />
Other comprehensive income - - -<br />
TOTAL COMPREHENSIVE INCOME FOR THE PERIOD 138 282 15,305<br />
14
<strong>THREE</strong>-<strong>MONTH</strong> <strong>REPORT</strong> 2013<br />
PARENT COMPANY BALANCE SHEET IN SUMMARY (SEK m)<br />
ASSETS 28 Feb 2013 29 Feb 2012 30 Nov 2012<br />
Fixed assets<br />
Intangible fixed assets - 150 -<br />
Tangible fixed assets 446 445 459<br />
Financial fixed assets 1,736 1,761 1,602<br />
2,182 2,356 2,061<br />
Current assets<br />
Current receivables 11,562 10,112 12,780<br />
Short-term investments, 4-12 months 3,009 5,535 2,993<br />
Liquid funds 1,115 400 305<br />
15,686 16,047 16,078<br />
TOTAL ASSETS 17,868 18,403 18,139<br />
EQUITY AND LI<strong>AB</strong>ILITIES<br />
Equity 16,764 17,326 16,626<br />
Untaxed reserves 456 128 456<br />
Long-term liabilities* 229 240 229<br />
Current liabilities** 419 709 828<br />
TOTAL EQUITY AND LI<strong>AB</strong>ILITIES 17,868 18,403 18,139<br />
* Relates to provisions for pensions.<br />
** No current liabilities are interest-bearing.<br />
15