Final Accounts 2012 (PDF, 4MB) - Concordia Maritime
Final Accounts 2012 (PDF, 4MB) - Concordia Maritime
Final Accounts 2012 (PDF, 4MB) - Concordia Maritime
- No tags were found...

Create successful ePaper yourself
Turn your PDF publications into a flip-book with our unique Google optimized e-Paper software.
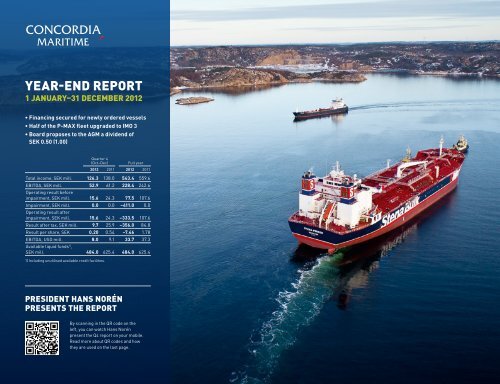
YEAR-END REPORT1 January–31 December <strong>2012</strong>• Financing secured for newly ordered vessels• Half of the P-MAX fleet upgraded to IMO 3• Board proposes to the AGM a dividend ofSEK 0.50 (1.00)Quarter 4(Oct–Dec)Full year<strong>2012</strong> 2011 <strong>2012</strong> 2011Total income, SEK mill. 126.3 138.0 543.4 559.6EBITDA, SEK mill. 52.9 61.2 228.4 242.6Operating result beforeimpairment, SEK mill. 15.6 24.3 77.5 107.6Impairment, SEK mill. 0.0 0.0 –411.0 0.0Operating result afterimpairment, SEK mill. 15.6 24.3 –333.5 107.6Result after tax, SEK mill. 9.7 25.9 –356.0 84.8Result per share, SEK 0.20 0.54 –7.46 1.78EBITDA, USD mill. 8.0 9.1 33.7 37.3Available liquid funds 1) ,SEK mill. 484.0 625.4 484.0 625.41) Including unutilised available credit facilities.PRESIDENT HANS NORÉNPRESENTS THE REPORTBy scanning in the QR code on theleft, you can watch Hans Norénpresent the Q4 report on your mobile.Read more about QR codes and howthey are used on the last page.
CONCORDIA MARITIME IN 60 SECONDS<strong>Concordia</strong> <strong>Maritime</strong> is an international tanker shipping company. Our focus is on cost-effective andsafe transportation of refined petroleum products and vegetable oils. The company’s B shares wereadmitted to trading on Nasdaq OMX Stockholm in 1984.CONTENTSPresident’s overview 3Business activities 4Freight market development 6Financial summary 7Other information 9Financial statements 11OUR BUSINESS CONCEPTTo provide our customers with safe and cost-efficient tankertransportation based on innovation and performance.OUR VISIONTo be our customers’ first choice for safe, innovative andefficient tanker transportation, which will result in goodprofitability, steady growth and financial stability.OUR STRATEGY• To continue to develop our position as a partner of choicein the transportation of refined petroleum products andvegetable oils.• To continue to identify the market’s need for efficienttransportation and thereafter to develop vessels and logisticssolutions based on transport economy, flexibility and a welldevelopedsafety and environmental philosophy.• To continue to utilise our strong financial position to dobusiness with the right timing.• To continue to take advantage of the unique competenceexisting in the Stena Sphere with respect to market knowhow,shipbuilding and ship operation.OUR CUSTOMERSOur customers include some of the world’s largest oil andenergy companies. Customer relations are characterised bypartnership, cooperation and a long-term perspective.WHAT WE TRANSPORTOur main focus is on the transportation of refined petroleumproducts and vegetable oils. As a complement to this focus,we are also active in the transportation of crude oil.OUR BUSINESS MODELOur business and income model consists of providing vesselsto customers in need of safe and cost-efficient transportationof oil and petroleum products. Income is generated mainly bychartering out vessels (spot or time charters), profit-sharingclauses in charters and the sale of ships.FINANCIAL OBJECTIVESGROWTH >10%per year while maintaining profitabilityPROFITABILITY >12%return on equityEQUITY RATIO >50%over a business cycle2 CONCORDIA MARITIME | YEAR-END REPORT JAN–DEC <strong>2012</strong>
PRESIDENT’S OVERVIEW<strong>2012</strong> was an eventful year. This was a year in which we moved another step closer to the open market,with five of our thirteen ships employed on the open market at year-end. We took delivery of one vesseland ordered two new ones, all three with the latest fuel-efficient design. We achieved a result beforetax, excluding impairment, of SEK 41.6 (76.3) million for the full year. After the fleet’s book value waswritten down in this year’s six-month report, result before tax was SEK –369.4 million.This was another strenuous year for tanker shipping. Thiswas reflected in the fact that our P-MAX vessels employedon the open market generated an average income of just overUSD 13,500 per day. Our fixed contracts continued to generateincome of approx. USD 20,000 per day. Despite theweak market, we reported a relatively strong EBITDA ofUSD 33.7 (37.3) million for <strong>2012</strong>.Fourth quarterResult after tax amounted to SEK 9.7 (25.9) million, whileEBITDA was SEK 52.9 (61.2) million. Income from ourP-MAX tankers in the open market was approx. USD13,500 per day.During the quarter, an agreement was signed on thefinancing of the two IMO II MAX product tankers orderedin June and scheduled for delivery in late 2014/early 2015.The agreement, which is with SEB, is expected to be fullycompleted during the first quarter of 2013.In late December, an incident occurred in which StenaPrimorsk ran aground near New York, resulting in somedamage to the outer hull. The tanker underwent repairs andis back in service. Thanks to our insurance cover, which alsoincludes loss of income, the results were only marginallyaffected by the incident.Expectations for 2013Our operations have undergone a gradual change over thelast two years, moving from fixed income contract coveragefor the entire fleet towards increasing exposure to the openmarket. As at February 2013, seven of our thirteen vesselsare employed on the open market, and, as would be expected,the market’s short-term ups and downs are having a significantimpact on our earnings and cash flow. We are employingvessels on the open market at this time because we wantto avoid locking in earnings for long periods in this weakmarket cycle that has brought low time charter rates. In otherwords, with this positioning we see scope for better earningsboth in the short and long term.During 2013, we expect the market to gradually continue tostrengthen. An improvement was seen towards the end of <strong>2012</strong>and this has continued into January and February. However, wedo not believe that income from our open vessels during the yearwill reach the average levels of our remaining time charters.Product tanker market’s long-term developmentIn addition to an improvement in the fundamental balancebetween supply and demand in the product tanker market,there are a number of driving forces of a structural nature.One example is the shift in refinery capacity from west to east.Another is price differentials between different markets whichfrom time to time present arbitrage opportunities in the oiltrade. This can lead to an increasing demand for transport.The product tanker segment is currently attracting significantinterest from investors, particularly in the U.S., and iswidely considered to be leading the recovery of the generallyweak shipping markets. We share this assessment and believethat we are well positioned to exploit the opportunitiescreated by a dynamic and changing product tanker market.Key ratios Q4, Oct–Dec Full year<strong>2012</strong> 2011 <strong>2012</strong> 2011EBITDA, SEK mill. 52.9 61.2 228.4 242.6Operating result beforeimpairment, SEK mill. 15.6 24.3 77.5 107.6Impairment, SEK mill. 0.0 0.0 –411.0 1) 0.0Operating result afterimpairment, SEK mill. 15.6 24.3 –333.5 107.6Result after tax, SEK mill. 9.7 25.9 –356.0 84.8Available liquid funds,including unutilised creditfacilities, SEK mill. 484.0 625.4 484.0 625.4Result per share after tax, SEK 0.20 0.54 –7.46 1.78EBITDA per share, SEK 1.1 1.28 4.8 5.08Dividend per share, SEK — — 1.00 2) 1.00Equity per share, SEK 27.88 37.24 27.88 37.24Equity ratio, % 38 47 38 47Growth in equity, % 1 2 –25 4Return on equity, % 3 6 –23 51) The impairment loss of USD 60 million was defined using the average rateof 6.85 SEK/USD at 30 June and corresponds to SEK 411.0 million.2) Relates to dividend per share in May <strong>2012</strong>.CONCORDIA MARITIME | YEAR-END REPORT JAN–DEC <strong>2012</strong> 3
BUSINESS ACTIVITIESAt the end of the fourth quarter, five of the fleet’s 13 vessels were employed on the open market.Half of our ten P-MAX tankers have now been upgraded to allow them to transport vegetable oils.VESSEL TYPESCrude oil tankersP-MAXApart from the incident involving Stena Primorsk, the vesselsin the fleet operated well. Our insurance cover meantthat repairs to the tanker did not have an adverse effect onthe financial results.In December, Stena Perros was taken in to drydock inthe French port of Brest, where she was also converted toIMO III class. The scheduled drydock resulted in a loss of19 income days. In total, five of our ten P-MAX tankershave now been upgraded to allow them to carry vegetableoils in addition to refined petroleum products.PanamaxStena Poseidon and Palva, the Panamax tankers we own ina joint venture with Neste Shipping, operated accordingto plan during the quarter.SuezmaxStena Supreme’s employment in Stena Sonangol SuezmaxPool generated income of approx. USD 14,000 per day inthe fourth quarter. Although this is lower than in the previousquarter, it is relatively good in what was a very weakquarter for the segment.Newbuilding programProject work on the two 50,000 DWT tankers that wereordered in <strong>2012</strong> is progressing according to plan atthe Chinese Guangzhou Shipyard International (GSI).VLCC Very Large Crude CarrierDWT 200,000–320,000SuezmaxDWT 120,000–165,000AframaxDWT 80,000–120,000Product tankersPanamaxDWT 55,000–75,000P-MAX (Product-MAX)DWT 65,200Medium Range (MR)DWT approx. 35,000–55,000EBITDA per quarterUSD millionsQ4<strong>2012</strong>Q3<strong>2012</strong>Q2<strong>2012</strong>Q1<strong>2012</strong>Q42011Q32011Q22011Q12011HandysizeDWT 10,000–35,000We are active here as at 31 December <strong>2012</strong>.P-MAX, timecharter 1) 5.9 5) 7.0 5) 6.3 5) 8.7 8.8 11.2 3) 8.3 8.8P-MAX, spot 1.8 0.3 2.5 0.5 –0.8 –0.5Panamax 1.1 1.0 1.0 1.2 0.8 1.2 1.4 1.2Suezmax 0.4 0.8 — — — — — —Admin. and other –1.2 –1.3 –1.1 –1.2 0.2 4) –1.0 –1.2 –1.1Total 8.0 2) 7.8 2) 8.7 2) 9.2 2) 9.0 10.9 8.5 8.91) 0% of accumulated income is attributable to profit sharing.2) The company reports depreciation of drydock as an operating cost.3) Includes one-time payment of USD 2.3 million for redelivery of Stena Provence.4) Includes one-time payment of USD 1.9 million on conclusion of insurance case relating to V-MAX tanker.5) For quarter 4, <strong>2012</strong>, includes insurance payment of USD 0.2 million. One-time payment of USD 1.0 million(Q2 and Q3 <strong>2012</strong>) and USD 0.3 million (Q4 <strong>2012</strong>) for redelivery of Stena Primorsk and Stena President.TYPES OF CONTRACTSpot charter (open market)Hiring of vessels on a voyage-by-voyage basis.Time charterHiring of vessels for a specified period ata fixed rate.4 CONCORDIA MARITIME | YEAR-END REPORT JAN–DEC <strong>2012</strong>
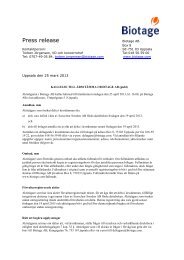
BUSINESS ACTIVITIES , CONT’DProduct fleet’s average freight rate per vessel and dayUSD per day20,00015,000The chart illustrates developmentof the spot and time charter marketsand <strong>Concordia</strong> <strong>Maritime</strong>’s incomefor vessels employed in these twomarkets. The company’s income isdepicted by green and red lines.10,0005,0000Jan Feb Mar Apr May Jun Jul Aug Sep Oct Nov Dec<strong>Concordia</strong> <strong>Maritime</strong>’s income,time charter (base rate + profit-sharing)<strong>Concordia</strong> <strong>Maritime</strong>’s income, spotMarket, time charter (3 years)Market, spotContract portfolioP-MAXStena PremiumStena PenguinStena PolarisStena ProgressStena PerrosStena PresidentStena PerformanceStena PrimorskStena ProvenceStena ParisPanamaxStena PoseidonPalvaSuezmaxStena SupremeIMOIIMAXIMOIIMAX 1IMOIIMAX 22010 2011 <strong>2012</strong> 2013 2014 2015 2016 20172010 2011 <strong>2012</strong> 2013 2014 2015 2016 2017ContractedEmployment on the open marketVessel’s delivery date
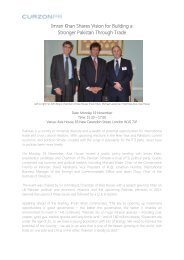
FREIGHT MARKET DEVELOPMENTUSD per day15,00010,000Q1 <strong>2012</strong> Q2 <strong>2012</strong> Q3 <strong>2012</strong> Q4 <strong>2012</strong>NEWBUILDING PRICESNewbuilding prices – product tankerMUSD555,0004025001 02 03 04 05 06 07 08 09 10 11 12Jan Feb Mar Apr May Jun Jul Aug Sep Oct Nov DecSpotTime charterProducttankers(MR)Average spot rates wereapprox. USD 11,000 per day.In the time-charter market,3-year charter contracts atrates of approx. USD 14,750per day were in place at theend of the period.A decline in the spot marketmeans average rates ofapprox. USD 7,100 per day.In the time-charter market,3-year charter contracts atrates of approx. USD 14,600per day were in place at theend of the period.Spot rates fell sharply at thebeginning of the quarter andaveraged approx. USD 2,700per day. In the time-chartermarket, 3-year charter contractsat rates of approx. USD14,000 per day were in placeat the end of the period.Spot market rates rosesharply at the end of the year,averaging approx. USD 8,000per day. In the time-chartermarket, 3-year charter contractsat rates of USD 14,250per day were in place at theend of the period.Newbuilding prices – suezmaxMUSD90705001 02 03 04 05 06 07 08 09 10 11 12USD per day30,000USD per day30,00020,00020,00010,00010,00000Jan Feb Mar Apr May Jun Jul Aug SepJan Feb Mar Apr May Jun Jul Aug SepThe charts show the average value per month on a strictly round trip basis.OctOctNovNovDecDecSuezmaxRates on the open marketrecovered slightly during thequarter, but remained weakat an average of approx.USD 11,500 per day. In thetime–charter market, 3–yearcharter contracts at ratesof USD 20,000 per day were inplace at the end of the period.SpotTime charterSpotTime charterSource: FearnleysLow newbuilding pricesNewbuilding prices for ships have recently showna downward trend, and looking over the pastdecade, the development is even clearer. At theend of the fourth quarter, newbuilding prices forboth product tankers (approx. USD 32 million)and Suezmax tankers (approx. USD 57 million)were at their lowest level in 10 years.The charts show the value at the end of each period.Source: Clarkson6 CONCORDIA MARITIME | YEAR-END REPORT JAN–DEC <strong>2012</strong>
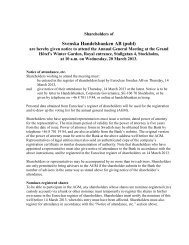
FINANCIAL SUMMARY, CONT’DImpairmentThe Group’s assets are assessed on a six-monthly basis todetermine whether there is any indication of impairment.The fleet is defined as a cash-generating unit, and an impairmentloss is recognised when the carrying amount of anasset or cash generating unit exceeds its recoverable amount.An impairment loss of USD 60 million (SEK 411 million)was recognised for the fleet on 30 June <strong>2012</strong> and was basedon an overall assessment of future earnings, newbuildingprices and average values from three independent ship brokers.When assessing asset values at 31 December, noimpairment was found.Seasonal variationsThe fact that 8 of our total fleet of 13 vessels were charteredout on fixed contracts partly counteracts the seasonal variationsthat can otherwise occur in tanker shipping.Employees and option programsThe number of employees in the Group at 31 December<strong>2012</strong> was 427 (380), 421 (374) of whom were seagoingemployees. There are no option programs in place.Financial investmentsThe bond portfolio is classified under available-for-salefinancial assets and is recognised at market value in OCI.At the end of the quarter, bonds were owned in TeekayOffshore, Teekay LNG, Rabobank, Golden Close <strong>Maritime</strong>,Kungs leden Fastigheter, Wind Acquisition, Bonheur andSvensk Exportkredit. The total value of the bond portfoliowas USD 14.9 (15.2) million.Total short-term investments corresponded to SEK 97.1(104.8) million.Parent CompanyThe parent company’s total income for the fourth quarteramounted to SEK 0 (0.6) million. Intragroup invoicingrepresented SEK 0 (0) million of this amount. The parentcompany’s result after financial items for the fourth quarteramounted to SEK –5.4 (–7.2) million. The parent company’savailable liquid funds, including unutilised credit facilities,amounted to SEK 1,723.8 (1,928.9) million.The Board’s comments on the dividend proposalThe Board proposes a dividend of SEK 0.50. This is lowerthan the previous year’s dividend, which was SEK 1.00.The dividend decision is based on the fact that the net resultfor the year has declined compared with the previous year,despite the write-down of the fleet’s carrying amount.The Company’s financial position and available liquidityis good, even after the proposed dividend.Exchange differences in other comprehensive incomeSEK millions3001500–150–30002 03 04 05 06 07 08 09 10 11Exchange differencesExchange rate USD/SEKAs a result of SEK/USD exchange rate movements in <strong>2012</strong>, the company’s profitin SEK has changed, while profit in USD remains unchanged.12SEK1296308 CONCORDIA MARITIME | YEAR-END REPORT JAN–DEC <strong>2012</strong>
OTHER INFORMATIONRelated party transactions<strong>Concordia</strong> <strong>Maritime</strong> has a small internal organisation, andpurchases services from related-party companies in StenaSphere, which include Stena Bulk. The latter companyconducts tanker business which competes with <strong>Concordia</strong><strong>Maritime</strong> in some respects. Accordingly, there is an agreement,entered into many years ago, which regulates the relationshipbetween the two companies with respect to newbusiness. Under the terms of this agreement, <strong>Concordia</strong><strong>Maritime</strong> has the right to opt for 0, 50 or 100 percent participationin each new transaction.At the beginning of April 2011, Stena Bulk started a 50–50joint venture together with the Danish company Weco, resultingin a newly established company, Stena Weco. Stena Wecospecialises mainly in the transportation of vegetable oils.Under a new agreement with Stena Bulk, <strong>Concordia</strong><strong>Maritime</strong> is entitled to the financial result arising from vesselsthat may from time to time be chartered in by Stena Weco fora period of more than one year, should <strong>Concordia</strong> <strong>Maritime</strong>decide to participate in such charters. Other business generatedby Stena Weco is not available to <strong>Concordia</strong> <strong>Maritime</strong>.<strong>Concordia</strong> <strong>Maritime</strong> purchases services on a regular basisfrom the Stena Sphere in the following areas:• Vessel charter. Payment is based on a commission of 1.25percent on freight rates.• Commission on the purchase and sale of vessels. Paymentis based on a commission of 1 percent.• Operation and manning of the Group’s vessels, alsoreferred to as ship management. Payment is based on afixed price per year and vessel.• Purchases of bunker oil. Payment is based on a fixed commissionper ton purchased.• Administration, marketing, insurance, technical monitoringand development of <strong>Concordia</strong> <strong>Maritime</strong>’s fleet.Payment is based on a fixed price per month and vessel.With regard to technical consulting services for newbuildprojects, an hourly rate is applied on a cost-plus basis,which is then charged to the project.• Office rent and office services. A fixed annual price ischarged.All related party transactions are conducted on commercialterms and at market-related prices.Type of risk1. Corporate risks A Brand2 . M a r ke t–relatedrisks3. OperationalrisksB EmployeesC LiquidityD Financing riskA Economic trendB Freight ratesC Oil priceD Political riskE War and instabilityA Ship operation and insuranceB Environment4. Credit risks A Counterparty risks – customerB Counterparty risks – shipyards and partnersStena TeknikNewbuilding andconversion projects,R & D and procurementstenateknik.com<strong>Concordia</strong> <strong>Maritime</strong>Stena BulkStena WecoCharteringand commercialoperationstenabulk.comstenaweco.comNorthern MarineManagementOperation, manningand maintenancenmm-stena.comFlexible and safe transportation with good transport economyRisks and uncertainties<strong>Concordia</strong> <strong>Maritime</strong> is exposed to a number of risks of varioustypes. The main market-related factors affecting the companyinclude the general economy, freight rates, oil prices andpolitical factors. Risks related to operational activities includeship management, insurance and employees. <strong>Concordia</strong><strong>Maritime</strong> is also exposed to credit and financial risks.The management and the board work actively to minimiserisk exposure and to minimise the consequences and effectsof a risk nevertheless materialising.Further information can be found in the 2011 annualreport.ImpactVery largeLargeMediumSmallNegligibleAImprobableProbabilityAB AC BDUnlikelyBCDPossibleAEBLikelyProbableCONCORDIA MARITIME | YEAR-END REPORT JAN–DEC <strong>2012</strong> 9
GROUPINCOME STATEMENT, OTHER COMPREHENSIVEINCOME AND PER-SHARE DATASEK millions Quarter 4 <strong>2012</strong> Quarter 4 2011 Full year <strong>2012</strong> Full year 2011CONSOLIDATED INCOME STATEMENTAverage exchange rate SEK/USD 6.66 6.75 6.78 6.50Time charter income 87.1 128.1 411.3 541.5Spot charter income 39.2 9.9 132.1 18.1Total income 126.3 138.0 543.4 559.6Operating costs, ships –30.7 –34.0 –139.7 –162.6Seagoing personnel costs –33.3 –31.6 –134.2 –114.5Other external costs –4.3 –6.9 –26.0 –27.4Personnel expenses –5.1 –4.3 –15.1 –12.5Depreciation –37.3 –36.9 –150.9 –135.0Total operating costs –110.7 –113.7 –465.9 –452.0Operating result before impairment 15.6 24.3 77.5 107.6Impairment 0.0 0.0 –411.0 1) 0.0Operating result after impairment 15.6 24.3 –333.5 107.6Dividends 0.0 0.0 0.0 0.5Interest and similar income 3.4 3.5 12.4 7.8Interest and similar expense –14.4 –8.5 –48.3 –39.6Financial net –11.0 –5.0 –35.9 –31.3Result after financial net 4.6 19.3 –369.4 76.3Tax 5.1 6.6 13.4 8.5Result after tax 9.7 25.9 –356.0 84.8Other comprehensive incomeResult for the period 9.7 25.9 –356.0 84.8Exchange differences, net of tax –7.7 12.3 –82.6 41.3Equity hedges, net of tax 2.9 –3.6 29.6 –6.8Available-for-sale financial assets, net of tax 2.4 0.0 0.5 –0.6Cash flow hedges, currency-related, net of tax 0.6 1.0 0.7 1.4Cash flow hedges, interest-related, net of tax 4.7 5.2 8.7 –10.2Comprehensive income for the period 12.6 40.8 –399.1 109.9Per-share data, SEKNumber of shares 47,729,798 47,729,798 47,729,798 47,729,798Result per share, before/after dilution 0.20 0.54 –7.46 1.78Equity per share, SEK 27.88 37.24 27.88 37.241) The impairment loss of USD 60 million was defined using the average rate of 6.85 SEK/USD at 30 June and corresponds to SEK 411.0 million.CONCORDIA MARITIME | YEAR-END REPORT JAN–DEC <strong>2012</strong> 11
GROUPCONDENSED BALANCE SHEETSEK millions 31 Dec <strong>2012</strong> 31 Dec 2011Closing exchange rate SEK/USD 6.51 6.87AssetsShips and equipment 3,064.5 3,291.1Ships under construction 48.0 143.0Financial assets 0.0 1.8Total non-current assets 3,112.5 3,435.9Current receivables 126.7 80.5Short-term investments 97.1 113.6Cash and bank balances 144.4 128.2Total current assets 368.2 322.3Total assets 3,480.7 3,758.2Equity and liabilitiesEquity 1,330.8 1,777.6Non-current liabilities 1,979.6 1,820.2Current liabilities 170.3 160.4Total equity and liabilities 3,480.7 3,758.2CHANGES IN EQUITYSEK millionsSharecapitalOther paidincapitalTranslationreserveHedgingreserveFair valuereserveRetainedearningsTotalChanges Jan–Dec <strong>2012</strong>Opening balance 01.01.<strong>2012</strong> 381.8 61.9 83.6 –46.6 4.2 1,292.7 1,777.6Comprehensive income for the period –53.0 9.4 0.5 –356.0 –399.1Dividend –47.7 –47.7Closing balance 31.12.<strong>2012</strong> 381.8 61.9 30.6 –37.2 4.7 889.0 1,330.8Changes Jan–Dec 2011Opening balance 01.01.2011 381.8 61.9 49.1 –37.8 4.8 1,255.6 1,715.4Comprehensive income for the period 34.5 –8.8 –0.6 84.8 109.9Dividend –47.7 –47.7Closing balance 31.12.2011 381.8 61.9 83.6 –46.6 4.2 1,292.7 1,777.612 CONCORDIA MARITIME | YEAR-END REPORT JAN–DEC <strong>2012</strong>
GROUPCONDENSED CASH FLOW STATEMENTSEK millions Quarter 4 <strong>2012</strong> Quarter 4 2011 Full year <strong>2012</strong> Full year 2011Operating activitiesResult after financial net 4.6 19.2 –369.4 76.2Adjustments:Depreciation/impairment 35.2 43.7 573.2 153.8Result, sale of non-current assets 0.0 –0.6 0.4 –0.6Result, sale of securities –0.7 –0.4 –5.0 1.7Other items –5.5 0.0 –8.7 0.0Cash flow from operating activitiesbefore changes in working capital33.6 61.9 190.5 231.1Changes in working capital –19.8 6.2 –22.6 65.5Cash flow from operating activities 13.8 68.1 167.9 296.6Investing activitiesSale of non-current assets 0.0 5.4 –0.4 5.4Investment in non-current assets –17.7 –26.0 –428.3 –330.1Investment in financial assets –6.6 –50.6 –65.8 –57.0Sale of financial assets 4.6 11.5 75.8 27.0Cash flow from investing activities –19.7 –59.7 –418.7 –354.7Financing activitiesNew loans 245.8 1,271.8 815.1 3,545.5Amortisation of loans –229.5 –1,249.4 –500.0 –3,380.3Dividend to shareholders 0.0 0.0 –47.7 –47.7Cash flow from financing activities 16.3 22.4 267.4 117.5Cash flow for the period 10.4 30.8 16.6 59.4Balance at beginning of period (Note 1) 135.1 98.6 128.2 68.3Exchange differences (Note 2) –1.1 –1.2 –0.4 0.5Balance at end of period (Note 1) 144.4 128.2 144.4 128.2Note 1. Balance consists of cash,bank balances and credit facilityNote 2. Exchange differences attributable to:Balance at beginning of year 0.7 0.0 0.5 0.1Cash flow for the period –1.8 –1.2 –0.9 0.4–1.1 –1.2 –0.4 0.5
QUARTERLY OVERVIEWSEK millionsQuarter 4<strong>2012</strong>Quarter 3<strong>2012</strong>Quarter 2<strong>2012</strong>Quarter 1<strong>2012</strong>Quarter 42011Quarter 32011Quarter 22011Quarter 12011Profit/loss items Total income 126.3 135.8 144.0 137.3 138.0 145.5 117.1 159.0Operating costs excluding impairment –110.7 –120.6 –121.9 –112.7 –113.7 –110.8 –94.4 –133.1Operating result (EBIT) 15.6 15.2 –388.9 24.6 24.3 34.7 22.7 25.9of which profit/loss on ship salesFinancial net –11.0 –11.1 –6.7 –7.1 –5.0 –12.9 –6.5 –6.9Result after financial items 4.6 4.1 –395.6 17.5 19.3 21.8 16.2 19.0Result after tax 9.7 7.4 –393.7 20.6 25.9 20.1 17.9 20.9Cash flow from operating activities 33.6 44.6 55.1 57.1 61.9 60.2 56.0 53.0EBITDA 52.9 52.7 60.6 61.8 61.2 70.6 53.3 57.5Balance-sheet items Ships (number) 3,064.5 (12) 3,105.1 (12) 3,287.5 (12) 3,130.4 (11) 3,291.1 (11) 3,295.0 (11) 3,066.8 (11) 2,706.5 (10)Ships under construction (number) 48 (2) 46.6 (2) 0 142.5 (1) 143.0 (1) 138.9 (1) 87.5 (1) 291.3 (2)Liquid funds incl. investments 241.5 230.0 280.7 265.5 241.8 163.1 162.0 180.4Other assets 126.7 102.3 113.1 75.8 82.3 85.8 102.3 105.1Interest-bearing liabilities 1,993.3 2,000.8 2,130.0 1,698.6 1,815.4 1,777.5 1,619.8 1,480.0Other liabilities and provisions 156.6 165.0 182.4 160.8 165.2 168.5 158.9 132.4Equity 1,330.8 1,318.2 1,368.9 1,754.8 1,777.6 1,736.8 1,639.9 1,670.9Total assets 3,480.7 3,484.0 3,681.3 3,614.2 3,758.2 3,682.8 3,418.6 3,283.3Key ratios, % Equity ratio 38 38 37 49 47 47 48 51Return on total capital 2 2 –10 3 3 3 3 3Return on capital employed 2 2 –9 3 3 3 3 3Return on equity 3 2 –24 5 5 5 5 5Operating margin 12 11 –270 18 18 24 19 16Share data Total income 2.65 2.85 3.02 2.88 2.89 3.05 2.45 3.33Operating costs excluding impairment –2.32 –2.53 –2.55 –2.36 –2.38 –2.32 –1.98 –2.79Operating result before impairment 0.33 0.32 0.46 0.52 0.51 0.73 0.48 0.54Financial net –0.23 –0.23 –0.14 –0.15 –0.10 –0.27 –0.14 –0.14Result after tax 0.20 0.15 –8.25 0.43 0.54 0.42 0.38 0.44Cash flow 0.70 0.93 1.15 1.20 1.30 1.26 1.17 1.11EBITDA 1.11 1.10 1.27 1.29 1.28 1.48 1.12 1.20Equity 27.88 27.62 28.68 36.77 37.24 36.39 34.36 35.01Please note that there has been no dilution effect since 2002. Definitions: see page 1614 CONCORDIA MARITIME | YEAR-END REPORT JAN–DEC <strong>2012</strong>
PARENT COMPANYCONDENSED INCOME STATEMENT AND BALANCE SHEETSEK millions Full year <strong>2012</strong> Full year 2011Total income 38.9Operating costs, ships –38.6Other external costs –13.6 –14.8Personnel expenses –11.1 –8.6Operating result –24.7 –23.1Other interest and similar income 59.9 25.3Interest and similar expense –30.8 –37.1Result after financial items 4.4 –34.9Tax –5.7 9.5Result for the period –1.3 –25.4The <strong>Concordia</strong> <strong>Maritime</strong> Group applies International Financial Reporting Standards(IFRS) as adopted by the EU. The Group prepares its interim reports in accordance withthe accounting policies and calculation methods used in the 2011 annual report, unlessotherwise indicated in this report.The Group’s interim report has been prepared in accordance with IAS 34. The report forthe Parent Company has been prepared in accordance with the Swedish Annual <strong>Accounts</strong>Act and RFR recommendations. This report gives a true and fair view of the operations,financial position and performance of the Parent Company and Group, and describes significantrisks and uncertainties to which the Group is exposed. The report has not beenreviewed by the company’s auditors.SEK millions 31 Dec <strong>2012</strong> 31 Dec 2011AssetsShips and equipment 0.0 0.1Financial assets 29.4 35.0Shares in Group companies 745.8 745.8Total non-current assets 775.2 780.9Current receivables 7.8 7.0Short-term investments 0.3 26.0Cash and bank balances 1,384.2 1,431.7Total current assets 1,392.3 1,464.7Total assets 2,167.5 2,245.6Equity and liabilitiesEquity 551.1 600.4Non-current liabilities 1,577.2 1,610.4Current liabilities 39.2 34.8Total equity and liabilities 2,167.5 2,245.6Pledged assets 65.1 68.7Contingent liabilities 1) 302.11) The parent company has provided a guarantee for a subsidiary, which relates to vessel financing.Gothenburg, 21 February 2013<strong>Concordia</strong> <strong>Maritime</strong> AB (publ)Carl-Johan Hagman Carl Mikael von Mentzer Stefan BrockerChairmanDeputy ChairmanJens Ole Hansen Mats Jansson Jörgen LorénMichael G:son LöwHans NorénPresidentMorten Chr. MoDan Sten OlssonCONCORDIA MARITIME | YEAR-END REPORT JAN–DEC <strong>2012</strong> 15
ACCOUNTING POLICIESDEFINITIONSThis interim financial report in summary for the Group has beenprepared in accordance with IAS 34 Interim Financial Reportingand relevant provisions of the Swedish Annual <strong>Accounts</strong> Act.The interim report for the parent company has been prepared inaccordance with chapter 9 of the Swedish Annual <strong>Accounts</strong> Act.For the Group and parent company, the same accounting principlesand computation methods have been applied as in the mostrecent annual report, apart from the fact that currency-relatedhedge accounting is no longer used.This information in this report is information that <strong>Concordia</strong><strong>Maritime</strong> is required to disclose in accordance with theSwedish Securities Market Act and/or the Swedish FinancialInstruments Trading Act. The information was made publicon 21 February 2013 at approx. 2 p.m.Cash flow from operating activities Result after net financialitems plus depreciation minus tax paid (cash flow beforechange in working capital and investments and before effectof ship sales).Return on total capital Result after net financial items plusfinancial expenses as a percentage of average total assets.Return on capital employed Result after net financialitems plus financial expenses as a percentage of averagecapital employed. Capital employed refers to total assetsminus non-interest-bearing liabilities,including deferredtax liability.Return on equity Result for the year as a percentage ofaverage equity.Equity ratio Equity as a percentage of total assets.www.solberg.seINFORMATION AND CONTACTThe AGM will be held at Lorensbergsteatern, Lorensbergsparken,Gothenburg, at 2.00 p.m. on 23 April 2013. The interimreport for the first quarter will be also be presented at themeeting. The annual report for <strong>2012</strong> will be sent to all registeredshareholders in April and will be available at <strong>Concordia</strong><strong>Maritime</strong>’s offices from week 13.Reports and informationQ1 Interim Report 2013 23 April 2013Q2 Interim Report 2013 14 August 2013Q3 Interim Report 2013 6 November 2013Hans Norén, President+46 31 85 51 01or +46 704 85 51 01hans.noren@concordiamaritime.comAnna Forshamn, CFO+46 31 85 51 72or +46 704 85 51 72anna.forshamn@concordiamaritime.comAbout QR codesQR codes are used to refer to more information on theInternet. The code in this report links to a video. The videocan also be viewed on <strong>Concordia</strong> <strong>Maritime</strong>’s website.The QR code is scanned in with the help of your smartphonecamera. You are then taken to the web page containingthe information To be able to use QR codes, yourmobile must be equipped with a camera, a QR reader andan Internet connection.If you do not already have a QR reader in your mobile,it can be downloaded free of charge. There are differentreaders for different types of mobile phones. Search forQR on sites where you download applications for yoursmartphone, e.g. App Store or Android Market.<strong>Concordia</strong> <strong>Maritime</strong>405 19 Gothenburg, SwedenTel +46 31 85 50 00Reg. no. 556068-5819www.concordiamaritime.com16 CONCORDIA MARITIME | YEAR-END REPORT JAN–DEC <strong>2012</strong>