2006 - GRS-Batterien
2006 - GRS-Batterien
2006 - GRS-Batterien

You also want an ePaper? Increase the reach of your titles
YUMPU automatically turns print PDFs into web optimized ePapers that Google loves.
10<br />
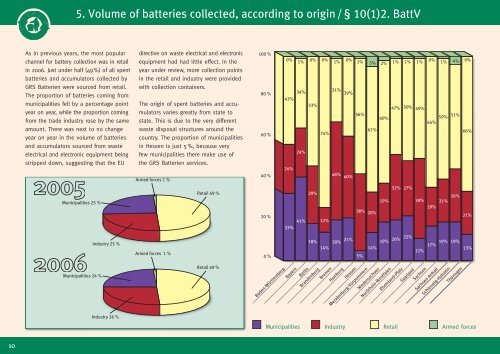
5. Volume of batteries collected, according to origin / § 10(1)2. BattV<br />
As in previous years, the most popular<br />
channel for battery collection was in retail<br />
in <strong>2006</strong>. Just under half (49 %) of all spent<br />
batteries and accumulators collected by<br />
<strong>GRS</strong> <strong>Batterien</strong> were sourced from retail.<br />
The proportion of batteries coming from<br />
municipalities fell by a percentage point<br />
year on year, while the proportion coming<br />
from the trade industry rose by the same<br />
amount. There was next to no change<br />
year on year in the volume of batteries<br />
and accumulators sourced from waste<br />
electrical and electronic equipment being<br />
stripped down, suggesting that the EU<br />
Municipalities 25 %<br />
Municipalities 24 %<br />
Industry 25 %<br />
Industry 26 %<br />
directive on waste electrical and electronic<br />
equipment had had little effect. In the<br />
year under review, more collection points<br />
in the retail and industry were provided<br />
with collection containers.<br />
The origin of spent batteries and accumulators<br />
varies greatly from state to<br />
state. This is due to the very different<br />
waste disposal structures around the<br />
country. The proportion of municipalities<br />
in Hessen is just 5 %, because very<br />
few municipalities there make use of<br />
the <strong>GRS</strong> <strong>Batterien</strong> services.<br />
Armed forces 1 %<br />
Armed forces 1 %<br />
Retail 49 %<br />
Retail 49 %<br />
Municipalities Industry<br />
Retail Armed forces