pdf (5.0 MB) - Metro Group
pdf (5.0 MB) - Metro Group
pdf (5.0 MB) - Metro Group

You also want an ePaper? Increase the reach of your titles
YUMPU automatically turns print PDFs into web optimized ePapers that Google loves.
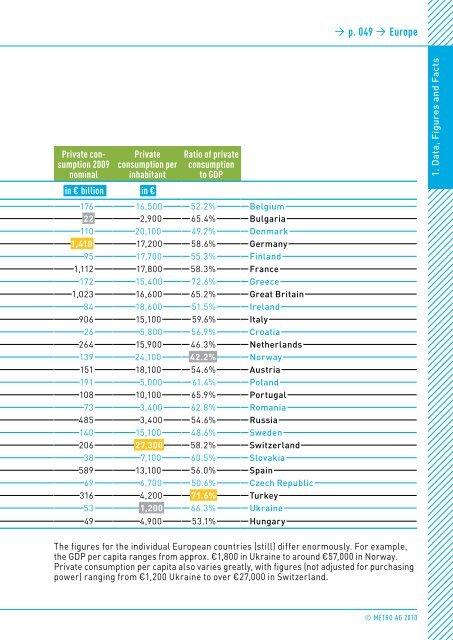
p. 049 Europe<br />
Private consumption<br />
2009<br />
nominal<br />
Private<br />
consumption per<br />
inhabitant<br />
in € billion in €<br />
Ratio of private<br />
consumption<br />
to gdP<br />
176 16,500 52.2% Belgium <br />
22 2,900 65.4% Bulgaria <br />
110 20,100 49.2% Denmark <br />
1,410 17,200 58.6% Germany <br />
95 17,700 55.3% Finland <br />
1,112 17,800 58.3% France <br />
172 15,400 72.6% Greece <br />
1,023 16,600 65.2% Great Britain <br />
84 18,600 51.5% Ireland <br />
906 15,100 59.6% Italy <br />
26 5,800 56.9% Croatia <br />
264 15,900 46.3% Netherlands <br />
139 24,100 42.2% Norway <br />
151 18,100 54.6% Austria <br />
191 5,000 61.4% Poland <br />
108 10,100 65.9% Portugal <br />
73 3,400 62.8% Romania <br />
485 3,400 54.6% Russia <br />
140 15,100 48.6% Sweden <br />
206 27,300 58.2% Switzerland <br />
38 7,100 60.5% Slovakia <br />
589 13,100 56.0% Spain <br />
69 6,700 50.6% Czech Republic <br />
316 4,200 71.6% Turkey <br />
53 1,200 66.3% Ukraine <br />
49 4,900 53.1% Hungary <br />
1. Data, Figures and Facts<br />
The figures for the individual European countries (still) differ enormously. For example,<br />
the GDP per capita ranges from approx. €1,800 in Ukraine to around €57,000 in Norway.<br />
Private consumption per capita also varies greatly, with figures (not adjusted for purchasing<br />
power) ranging from €1,200 ukraine to over €27,000 in Switzerland.<br />
© METro AG 2010