Patterns of climate change across Scotland: technical report - Sniffer
Patterns of climate change across Scotland: technical report - Sniffer
Patterns of climate change across Scotland: technical report - Sniffer

You also want an ePaper? Increase the reach of your titles
YUMPU automatically turns print PDFs into web optimized ePapers that Google loves.
SNIFFER Project CC03: <strong>Patterns</strong> <strong>of</strong> Climate Change <strong>across</strong> <strong>Scotland</strong> April 2006<br />
has increased significantly. At a regional level there have been significant temperature rises<br />
since 1914, particularly in East and West <strong>Scotland</strong> where temperatures have risen from an<br />
annual average <strong>of</strong> approximately 6.7°C (East <strong>Scotland</strong>) and 7.8°C (West <strong>Scotland</strong>) to 7.5°C<br />
and 8.3°C respectively. The apparent inconsistency between these two sets <strong>of</strong> figures, with<br />
the fact that more <strong>of</strong> the regions and seasons show significant trends during the later<br />
(shorter) period, suggests a more rapid rise in temperatures over this later part <strong>of</strong> the<br />
twentieth century. This can also be seen in Figure 3, which presents the ninety-year timeseries<br />
<strong>of</strong> annual mean temperatures for the regions (1914 to 2004).<br />
Table 2 - Mean Temperature <strong>change</strong>s (°C), 1961 to 2004 and 1914 to 2004. Statistically<br />
significant trends are shown in bold (significant at the 1% level) or italic (significant at the 5%<br />
level) type.<br />
1961-2004 1914-2004<br />
North East West<br />
North East West<br />
<strong>Scotland</strong> <strong>Scotland</strong> <strong>Scotland</strong> <strong>Scotland</strong> <strong>Scotland</strong> <strong>Scotland</strong> <strong>Scotland</strong> <strong>Scotland</strong><br />
Spring 1.03 1.23 1.20 1.14 0.59 0.83 0.66 0.69<br />
Summer 1.06 1.12 1.08 1.08 0.50 0.59 0.43 0.51<br />
Autumn 0.64 0.68 0.66 0.66 0.46 0.85 0.68 0.64<br />
Winter 1.03 1.39 1.31 1.22 0.02 0.45 0.33 0.24<br />
Annual 0.92 1.08 1.04 1.00 0.37 0.66 0.51 0.50<br />
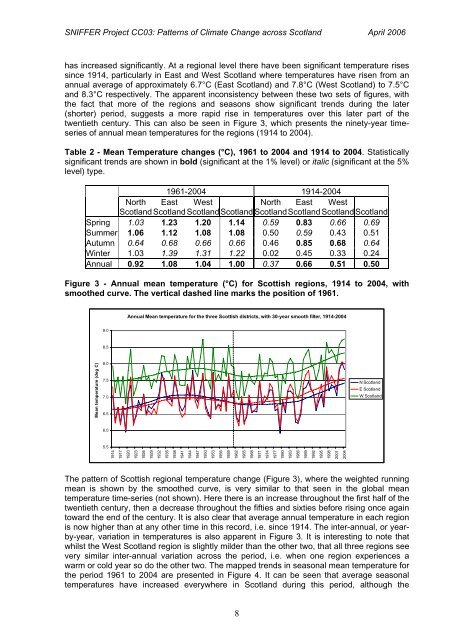
Figure 3 - Annual mean temperature (°C) for Scottish regions, 1914 to 2004, with<br />
smoothed curve. The vertical dashed line marks the position <strong>of</strong> 1961.<br />
Annual Mean temperature for the three Scottish districts, with 30-year smooth filter, 1914-2004<br />
9.0<br />
8.5<br />
Mean temperature (deg C)<br />
8.0<br />
7.5<br />
7.0<br />
6.5<br />
6.0<br />
5.5<br />
1914<br />
1917<br />
1920<br />
1923<br />
1926<br />
1929<br />
1932<br />
1935<br />
1938<br />
1941<br />
1944<br />
1947<br />
1950<br />
1953<br />
1956<br />
1959<br />
1962<br />
1965<br />
1968<br />
1971<br />
1974<br />
1977<br />
1980<br />
1983<br />
1986<br />
1989<br />
1992<br />
1995<br />
1998<br />
2001<br />
2004<br />
N <strong>Scotland</strong><br />
E <strong>Scotland</strong><br />
W <strong>Scotland</strong><br />
The pattern <strong>of</strong> Scottish regional temperature <strong>change</strong> (Figure 3), where the weighted running<br />
mean is shown by the smoothed curve, is very similar to that seen in the global mean<br />
temperature time-series (not shown). Here there is an increase throughout the first half <strong>of</strong> the<br />
twentieth century, then a decrease throughout the fifties and sixties before rising once again<br />
toward the end <strong>of</strong> the century. It is also clear that average annual temperature in each region<br />
is now higher than at any other time in this record, i.e. since 1914. The inter-annual, or yearby-year,<br />
variation in temperatures is also apparent in Figure 3. It is interesting to note that<br />
whilst the West <strong>Scotland</strong> region is slightly milder than the other two, that all three regions see<br />
very similar inter-annual variation <strong>across</strong> the period, i.e. when one region experiences a<br />
warm or cold year so do the other two. The mapped trends in seasonal mean temperature for<br />
the period 1961 to 2004 are presented in Figure 4. It can be seen that average seasonal<br />
temperatures have increased everywhere in <strong>Scotland</strong> during this period, although the<br />
8