Patterns of climate change across Scotland: technical report - Sniffer
Patterns of climate change across Scotland: technical report - Sniffer
Patterns of climate change across Scotland: technical report - Sniffer

You also want an ePaper? Increase the reach of your titles
YUMPU automatically turns print PDFs into web optimized ePapers that Google loves.
SNIFFER Project CC03: <strong>Patterns</strong> <strong>of</strong> Climate Change <strong>across</strong> <strong>Scotland</strong> April 2006<br />
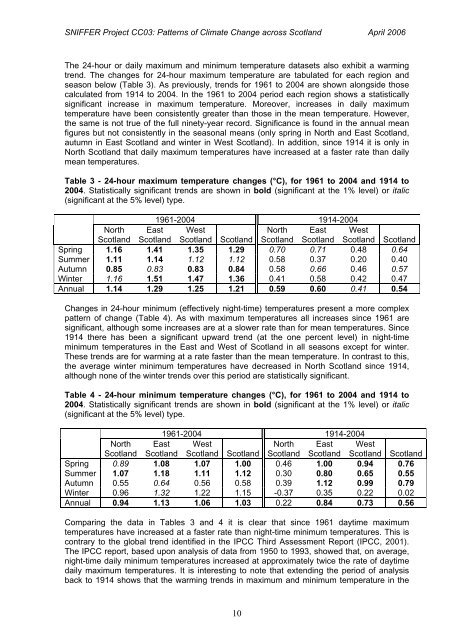
The 24-hour or daily maximum and minimum temperature datasets also exhibit a warming<br />
trend. The <strong>change</strong>s for 24-hour maximum temperature are tabulated for each region and<br />
season below (Table 3). As previously, trends for 1961 to 2004 are shown alongside those<br />
calculated from 1914 to 2004. In the 1961 to 2004 period each region shows a statistically<br />
significant increase in maximum temperature. Moreover, increases in daily maximum<br />
temperature have been consistently greater than those in the mean temperature. However,<br />
the same is not true <strong>of</strong> the full ninety-year record. Significance is found in the annual mean<br />
figures but not consistently in the seasonal means (only spring in North and East <strong>Scotland</strong>,<br />
autumn in East <strong>Scotland</strong> and winter in West <strong>Scotland</strong>). In addition, since 1914 it is only in<br />
North <strong>Scotland</strong> that daily maximum temperatures have increased at a faster rate than daily<br />
mean temperatures.<br />
Table 3 - 24-hour maximum temperature <strong>change</strong>s (°C), for 1961 to 2004 and 1914 to<br />
2004. Statistically significant trends are shown in bold (significant at the 1% level) or italic<br />
(significant at the 5% level) type.<br />
1961-2004 1914-2004<br />
North<br />
<strong>Scotland</strong><br />
East<br />
<strong>Scotland</strong><br />
West<br />
<strong>Scotland</strong> <strong>Scotland</strong><br />
North<br />
<strong>Scotland</strong><br />
East<br />
<strong>Scotland</strong><br />
West<br />
<strong>Scotland</strong> <strong>Scotland</strong><br />
Spring 1.16 1.41 1.35 1.29 0.70 0.71 0.48 0.64<br />
Summer 1.11 1.14 1.12 1.12 0.58 0.37 0.20 0.40<br />
Autumn 0.85 0.83 0.83 0.84 0.58 0.66 0.46 0.57<br />
Winter 1.16 1.51 1.47 1.36 0.41 0.58 0.42 0.47<br />
Annual 1.14 1.29 1.25 1.21 0.59 0.60 0.41 0.54<br />
Changes in 24-hour minimum (effectively night-time) temperatures present a more complex<br />
pattern <strong>of</strong> <strong>change</strong> (Table 4). As with maximum temperatures all increases since 1961 are<br />
significant, although some increases are at a slower rate than for mean temperatures. Since<br />
1914 there has been a significant upward trend (at the one percent level) in night-time<br />
minimum temperatures in the East and West <strong>of</strong> <strong>Scotland</strong> in all seasons except for winter.<br />
These trends are for warming at a rate faster than the mean temperature. In contrast to this,<br />
the average winter minimum temperatures have decreased in North <strong>Scotland</strong> since 1914,<br />
although none <strong>of</strong> the winter trends over this period are statistically significant.<br />
Table 4 - 24-hour minimum temperature <strong>change</strong>s (°C), for 1961 to 2004 and 1914 to<br />
2004. Statistically significant trends are shown in bold (significant at the 1% level) or italic<br />
(significant at the 5% level) type.<br />
1961-2004 1914-2004<br />
North<br />
<strong>Scotland</strong><br />
East<br />
<strong>Scotland</strong><br />
West<br />
<strong>Scotland</strong> <strong>Scotland</strong><br />
North<br />
<strong>Scotland</strong><br />
East<br />
<strong>Scotland</strong><br />
West<br />
<strong>Scotland</strong> <strong>Scotland</strong><br />
Spring 0.89 1.08 1.07 1.00 0.46 1.00 0.94 0.76<br />
Summer 1.07 1.18 1.11 1.12 0.30 0.80 0.65 0.55<br />
Autumn 0.55 0.64 0.56 0.58 0.39 1.12 0.99 0.79<br />
Winter 0.96 1.32 1.22 1.15 -0.37 0.35 0.22 0.02<br />
Annual 0.94 1.13 1.06 1.03 0.22 0.84 0.73 0.56<br />
Comparing the data in Tables 3 and 4 it is clear that since 1961 daytime maximum<br />
temperatures have increased at a faster rate than night-time minimum temperatures. This is<br />
contrary to the global trend identified in the IPCC Third Assessment Report (IPCC, 2001).<br />
The IPCC <strong>report</strong>, based upon analysis <strong>of</strong> data from 1950 to 1993, showed that, on average,<br />
night-time daily minimum temperatures increased at approximately twice the rate <strong>of</strong> daytime<br />
daily maximum temperatures. It is interesting to note that extending the period <strong>of</strong> analysis<br />
back to 1914 shows that the warming trends in maximum and minimum temperature in the<br />
10