Patterns of climate change across Scotland: technical report - Sniffer
Patterns of climate change across Scotland: technical report - Sniffer
Patterns of climate change across Scotland: technical report - Sniffer

You also want an ePaper? Increase the reach of your titles
YUMPU automatically turns print PDFs into web optimized ePapers that Google loves.
SNIFFER Project CC03: <strong>Patterns</strong> <strong>of</strong> Climate Change <strong>across</strong> <strong>Scotland</strong> April 2006<br />
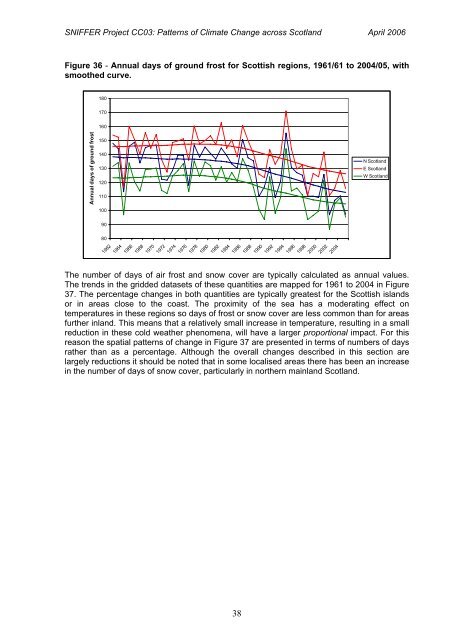
Figure 36 - Annual days <strong>of</strong> ground frost for Scottish regions, 1961/61 to 2004/05, with<br />
smoothed curve.<br />
180<br />
170<br />
Annual days <strong>of</strong> ground frost<br />
160<br />
150<br />
140<br />
130<br />
120<br />
110<br />
100<br />
90<br />
80<br />
1962<br />
1964<br />
1966<br />
1968<br />
1970<br />
1972<br />
1974<br />
1976<br />
1978<br />
1980<br />
1982<br />
1984<br />
1986<br />
1988<br />
1990<br />
1992<br />
1994<br />
1996<br />
1998<br />
2000<br />
2002<br />
2004<br />
N <strong>Scotland</strong><br />
E <strong>Scotland</strong><br />
W <strong>Scotland</strong><br />
The number <strong>of</strong> days <strong>of</strong> air frost and snow cover are typically calculated as annual values.<br />
The trends in the gridded datasets <strong>of</strong> these quantities are mapped for 1961 to 2004 in Figure<br />
37. The percentage <strong>change</strong>s in both quantities are typically greatest for the Scottish islands<br />
or in areas close to the coast. The proximity <strong>of</strong> the sea has a moderating effect on<br />
temperatures in these regions so days <strong>of</strong> frost or snow cover are less common than for areas<br />
further inland. This means that a relatively small increase in temperature, resulting in a small<br />
reduction in these cold weather phenomena, will have a larger proportional impact. For this<br />
reason the spatial patterns <strong>of</strong> <strong>change</strong> in Figure 37 are presented in terms <strong>of</strong> numbers <strong>of</strong> days<br />
rather than as a percentage. Although the overall <strong>change</strong>s described in this section are<br />
largely reductions it should be noted that in some localised areas there has been an increase<br />
in the number <strong>of</strong> days <strong>of</strong> snow cover, particularly in northern mainland <strong>Scotland</strong>.<br />
38