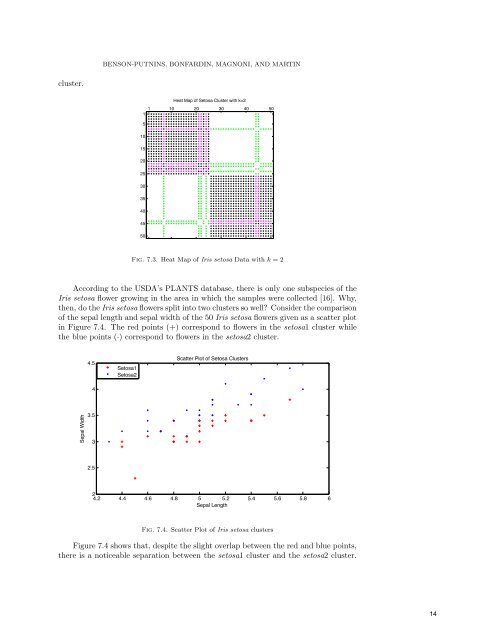
BENSON-PUTNINS, BONFARDIN, MAGNONI, <strong>AND</strong> MARTIN cluster. Heat Map of Setosa Cluster with k=2 1 10 20 30 40 50 1 5 10 15 20 25 30 35 40 45 50 Fig. 7.3. Heat Map of Iris setosa Data with k = 2 According to the USDA’s PLANTS database, there is only one subspecies of the Iris setosa flower growing in the area in which the samples were collected [16]. Why, then, do the Iris setosa flowers split into two clusters so well? Consider the comparison of the sepal length and sepal width of the 50 Iris setosa flowers given as a scatter plot in Figure 7.4. The red points (+) correspond to flowers in the setosa1 cluster while the blue points (·) correspond to flowers in the setosa2 cluster. 4.5 4 Setosa1 Setosa2 Scatter Plot of Setosa Clusters Sepal Width 3.5 3 2.5 2 4.2 4.4 4.6 4.8 5 5.2 5.4 5.6 5.8 6 Sepal Length Fig. 7.4. Scatter Plot of Iris setosa clusters Figure 7.4 shows that, despite the slight overlap between the red and blue points, there is a noticeable separation between the setosa1 cluster and the setosa2 cluster. 14
CLUSTER <strong>AND</strong> DATA ANALYSIS Flowers in the setosa2 cluster have a greater sepal width to sepal length ratio than flowers in the setosa1 cluster. Although we will not make any definitive conclusions on this matter, one possible explanation for this data is the existence of a different subspecies of iris flower. 8. Conclusion. In clustering, there are several issues, including determining the appropriate number of clusters for a particular dataset and visualizing the strength of these clusters. We have described methods to deal with these problems, and we have made a practical application of the proposed method studying what is known as Fisher’s Iris Data Set. Through the use of our methods for determining the appropriate number of clusters and for visualizing the strength of these clusters, we concluded that there could be four clusters, instead of the generally accepted three clusters, by splitting the Iris setosa cluster in two. These two sub-clusters differ significantly in their sepal width to sepal length ratio, perhaps indicating the existence of another subspecies of iris flower. Acknowledgments. We would like to thank our advisors C. <strong>Meyer</strong> and C. Wessell for guiding us through the research process and the process of writing this paper. They gave many hours of their time, reading multiple drafts and listening to much conjecture. We would also like to thank North Carolina State University for providing this research experience and the National Science Foundation and National Security Agency for providing funding to the REU program that made this experience possible. REFERENCES [1] E. Anderson, The irises of the Gaspé Peninsula, Bulletin of the American Iris Society, 59 (1935), pp. 2–5. [2] W. N. Anderson Jr. and T. D. Morley, Eigenvalues of the laplacian of a graph, 1968. [3] J. A. Bondy and U. S. R. Murty, Graph Theory, Springer, 2008. [4] J. P. Brunet, P. Tamayo, T. R. Golub, and J. P. Mesirov, Metagenes and molecular pattern discovery using matrix factorization, PNAS, 101(12) (2004), pp. 4164–4169. [5] F. R. K. Chung, Spectral Graph Theory, American Mathematical Society,1992. [6] C. Ding, X. He, H. Zha, M. Gu, and H. D. Simon, A MinMaxCut Spectral Method for Data Clustering and Graph Partitioning, Lawrence Berkeley National Laboratory, Tech. Rep. 54111 (2003). [7] M. Fiedler, Algebraic connectivity of graphs, Czechoslovak Mathematical Journal, 23 (1973), pp. 298–305. [8] M. Fiedler, A property of eigenvectors of nonnegative symmetric matrices and its application to graph theory, Czechoslovak Mathematical Journal, 25 (1975), pp. 619–633. [9] R. A. Fisher, The use of multiple measurements in taxonomical problems, Ann. Eugen., 7 (1936), pp. 179–188. [10] T. R. Golub, D. K. Slonim, P. Tamayo, C. Huard, M. Gaasenbeek, J. P. Mesirov, H. Coller, M. L. Loh, J. R. Downing, M. A. Caligiuri, C. D. Bloomfield, and E. S. Lander, Molecular Classification of Cancer: Class Discovery and Class Prediction by Gene Expression Monitoring, Science, 286(5439) (1999), pp. 531–537. [11] J. Kogan, Introduction to Clustering Large and High-Dimensional Data, Cambridge University Press, 2007. [12] U. Luxburg, A tutorial on spectral clustering, Statistics and Computing, 17(4) (2007), pp. 395–416. [13] C. D. <strong>Meyer</strong>, Matrix Analysis and Applied Linear Algebra, SIAM, 2000. [14] S. Monti, P. Tamayo, J. Mesirov, and T. Golub , Consensus Clustering: A resampling- Based Method for Class Discovery and Visualization of Gene Expression Microarray Data, Machine Learning, 52 (2003), pp. 91–118. [15] A. Pothen, H. D. Simon, and K. P. Liou, Partitioning sparse matrices with eigenvectors of graphs, SIAM Journal on Matrix Analysis and Applications, 11(3) (1990), pp. 430–452. [16] USDA, NRCS. 2010. The PLANTS Database (http://plants.usda.gov, 15 July 2010). National Plant Data Center, Baton Rouge, LA 70874-4490 USA. 15